Method for detecting illegal cooking oil doped in edible blend oil
A technology for blending oil and waste oil, applied in Raman scattering, material excitation analysis, etc., can solve difficult method steps, cumbersome problems, etc., and achieve the effects of good versatility, accurate results, and rapid identification
- Summary
- Abstract
- Description
- Claims
- Application Information
AI Technical Summary
Problems solved by technology
Method used
Image
Examples
Embodiment 1
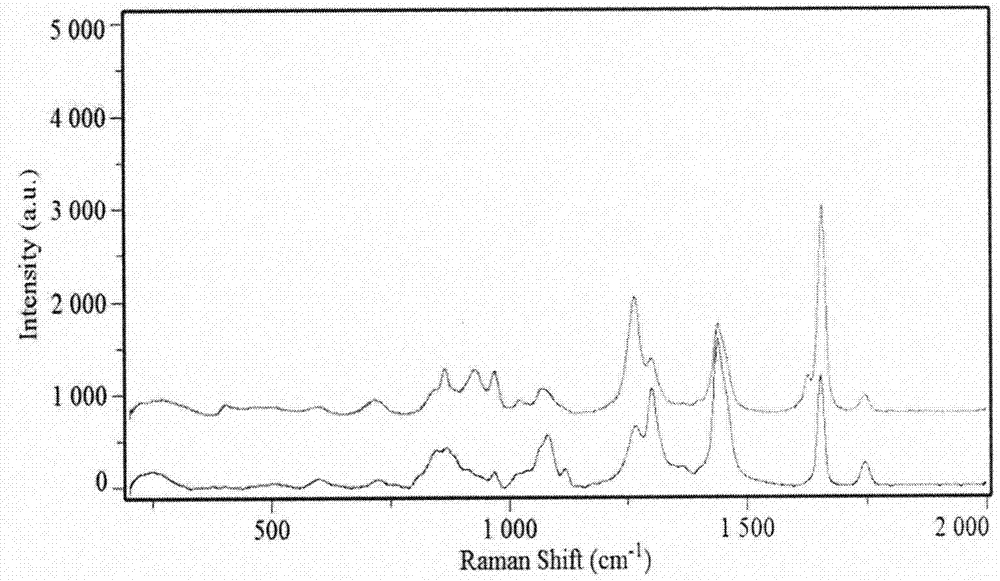
[0039]1) Instrument: Metrohm MIRA Raman spectrometer; 2) Sample to be tested 1: Soybean oil, peanut oil and refined waste oil are prepared according to the mass ratio of 1:1 to prepare the oil sample to be tested; The laser light source measures the Raman spectra of pure samples of soybean oil and peanut oil, and determines that the components in each are at 1200-1300cm -1 and at 1400-1600cm -1 There are two characteristic peaks at the position, and the total peak area S of the characteristic peaks at the above positions is calculated 1 =89.5, S 2 =56.8, determine that the maximum value is S 1 and minimum S 2 ;
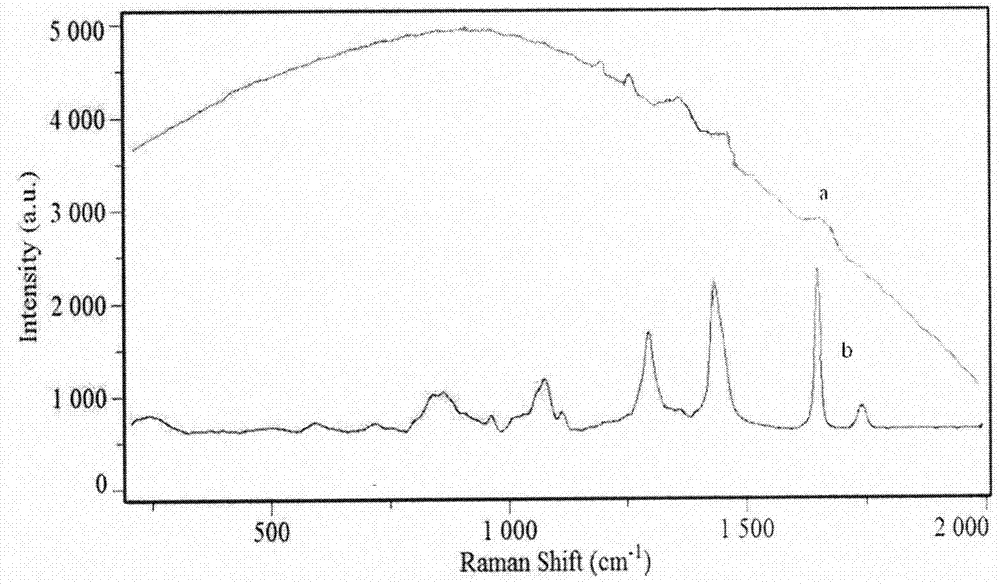
[0040] Adopt the Raman spectrogram of tested sample oil 1 under the same condition as figure 2 The spectrum of a in 1200-1300cm -1 and at 1400-1600cm -1 There is a characteristic peak at , calculate the area S of the characteristic peak x = 61.9;
[0041] Contrast S 2 x 1 , it is determined that the sample oil is mixed with waste oil, and the judgment resul...
Embodiment 2
[0043] 1) Instrument: Metrohm MIRA Raman spectrometer 2) Sample 2 to be tested: soybean oil, peanut oil, and refined waste oil are prepared into the oil samples to be tested according to the mass ratio of 1:1:4; The incident laser light source measures the Raman spectra of pure samples of soybean oil and peanut oil, and determines that the components in each are at 1200-1300cm -1 and at 1400-1600cm -1 There are two characteristic peaks at the position, and the total peak area S of the characteristic peaks at the above positions is calculated 1 =89.5, S 2 =56.8, determine that the maximum value is S 1 and minimum S 2 ;
[0044] Adopt the Raman spectrogram of tested sample oil 1 under the same condition as figure 2 The b spectrum in 1200-1300cm -1 and at 1400-1600cm -1 There is a very faint peak at , calculate the area S of the characteristic peak y = 6.9;
[0045] Contrast S y 2 , it is determined that more than half of the waste oil is mixed in the sample oil, and t...
PUM
 Abstract
Description
Claims
Application Information
 - R&D
- Intellectual Property
- Life Sciences
- Materials
- Tech Scout
- Unparalleled Data Quality
- Higher Quality Content
- 60% Fewer Hallucinations
Browse by: Latest US Patents, China's latest patents, Technical Efficacy Thesaurus, Application Domain, Technology Topic, Popular Technical Reports.
© 2025 PatSnap. All rights reserved.Legal|Privacy policy|Modern Slavery Act Transparency Statement|Sitemap|About US| Contact US: help@patsnap.com


