
A social security big data visualization method and system

A big data and social security technology, applied in the field of big data processing, can solve the problems of users not knowing that the response is slow, lack of user feedback information, difficult real-time dynamic interaction, etc., to avoid repeated generation and redundant data transmission, and improve scalability. The effect of improving the efficiency of visualization

Inactive Publication Date: 2019-05-14
SOUTH CHINA UNIV OF TECH
View PDF3 Cites 0 Cited by
  • Summary
  • Abstract
  • Description
  • Claims
  • Application Information

AI Technical Summary

Problems solved by technology

Also, certain operations on the object can cause the computer to become unresponsive, such as displaying a large map, selecting a portion of a detailed diagram, scrolling, printing, and modifying the object, making real-time dynamic interaction difficult
At the same time, there is often a lack of feedback information to the user during the interaction process, which makes the user unable to know the reason for the slow response, which is very unfriendly to the user

Method used


Image

  • A social security big data visualization method and system
  • A social security big data visualization method and system
  • A social security big data visualization method and system

Examples


Embodiment Construction

[0054] The present invention will be further described below in conjunction with specific examples.

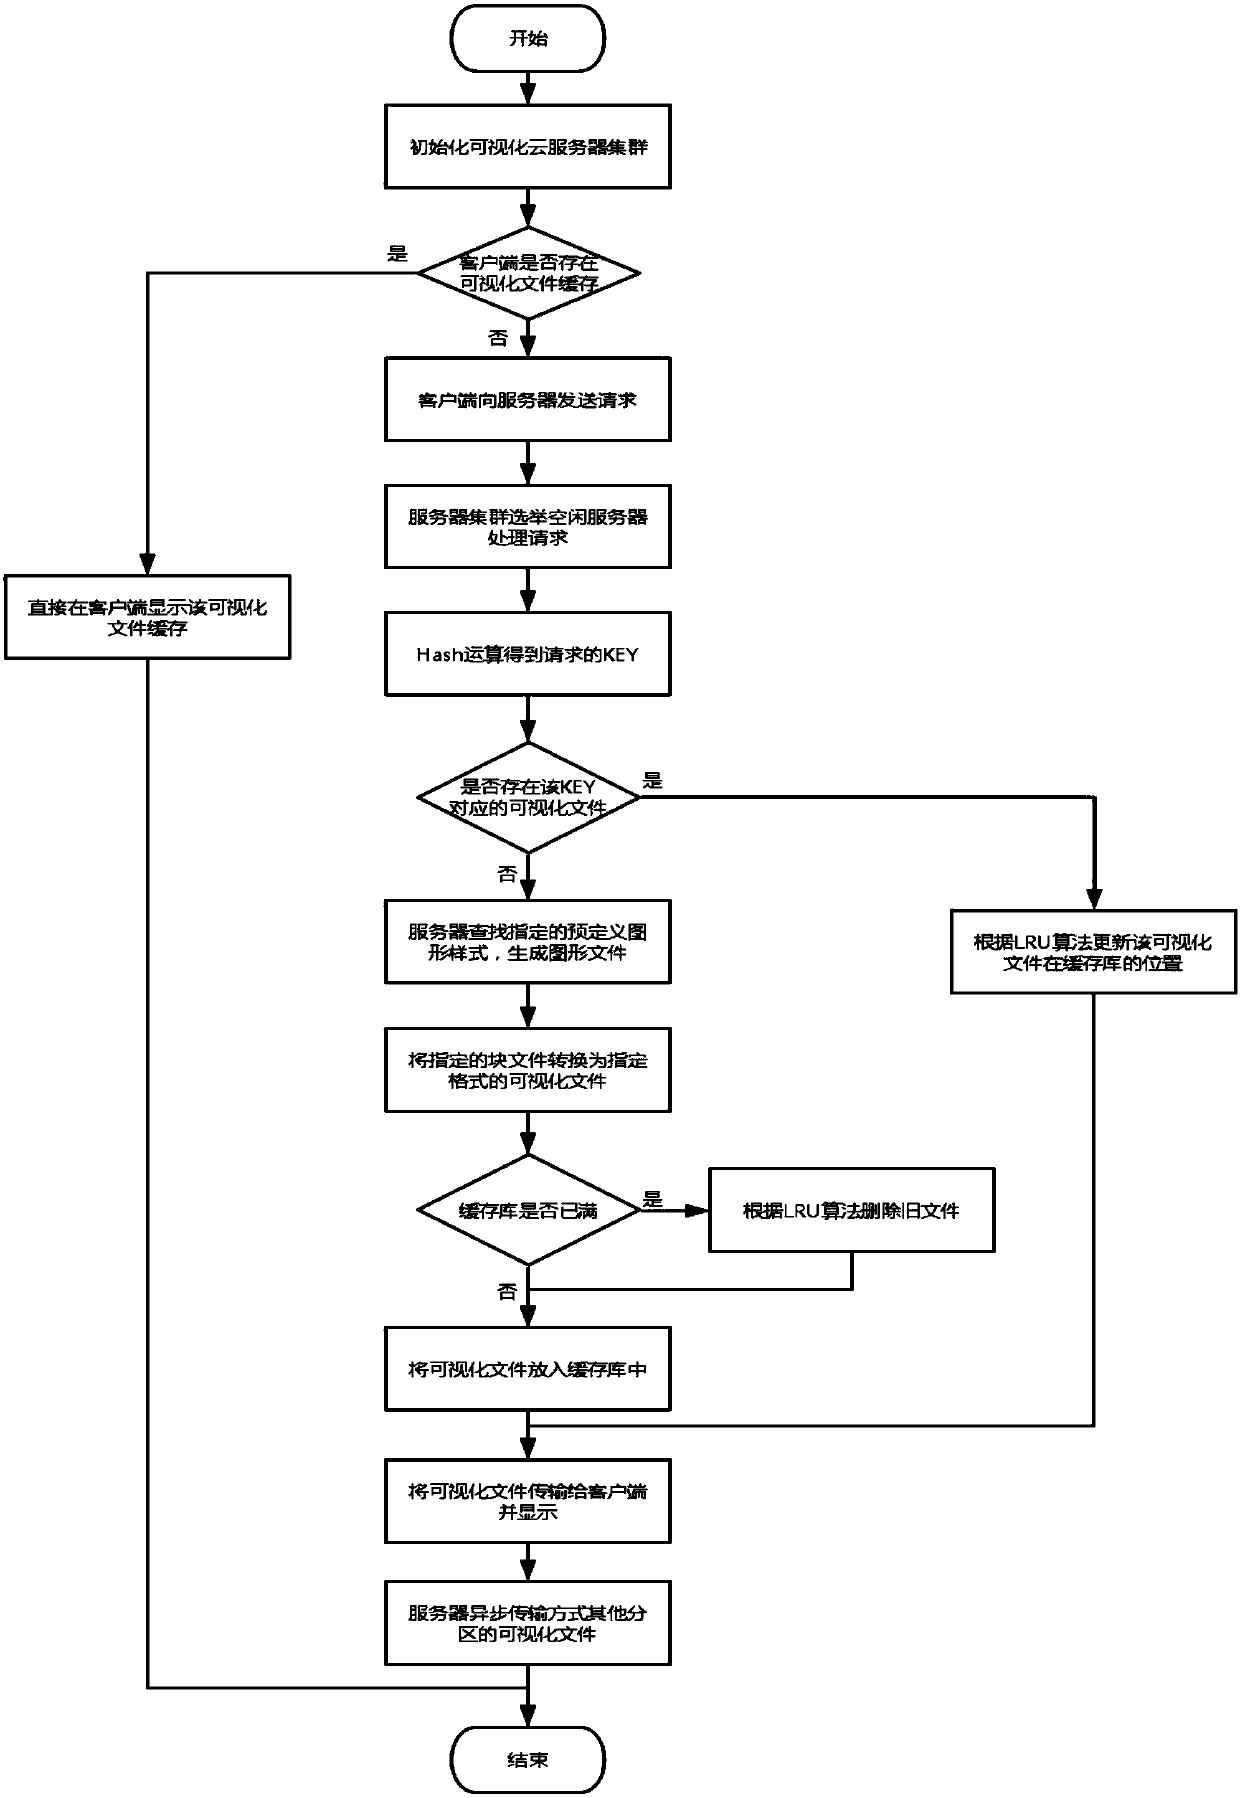
[0055] The social security big data visualization method provided by this embodiment is characterized in that a graphic file is generated through a feedback interactive mechanism, and the visualization efficiency is improved through a predefined chart and map template, a cache mechanism, and an asynchronous transmission mechanism; at the same time, through a cloud server cluster Elect idle servers to process client requests to ensure that client requests can be processed in a timely and efficient manner.

[0056] Such as figure 1 As shown, it is a flowchart of the above data visualization method, and the specific steps are as follows:

[0057] Step 1.1: The cloud platform allocates the required resources for the cloud server, and initializes the visualization cloud server cluster.

[0058] Step 1.2: The client checks whether there is a visual file cache in the local cache. I...


PUM


Abstract

The invention discloses a method and system for visualizing social security big data. The technical solution is mainly to generate graphic files through a feedback-type interactive mechanism to improve real-time interaction and friendliness; at the same time, through predefined charts and map templates, a cache mechanism, Asynchronous transfer mechanism to improve visualization efficiency. In addition, the cloud server cluster elects idle servers to process client requests, ensuring that client requests can be processed in a timely and efficient manner. The present invention gives full play to the processing performance of the visualization cloud server and overcomes the performance bottleneck of a single server; at the same time, it avoids repeated generation of the same visualization result and redundant data transmission through the caching mechanism, and improves the efficiency from visualization generation to client display, thereby improving The efficiency of data visualization.

Description

technical field [0001] The invention relates to the technical field of big data processing, in particular to a method and system for visualizing social security big data. Background technique [0002] Since 2002, the State Council has proposed a national-level informatization planning program "Golden Insurance Project". The "Gold Insurance Project" is a nationwide unified labor insurance project that uses advanced information technology and relies on the central, provincial, and municipal networks to support core applications such as labor and social security business management, public services, fund supervision, and macro decision-making. and social security e-government projects. Today, social security has covered more than one billion people, and the "Golden Insurance Project" has accumulated a large amount of social security big data. Therefore, it is urgent to use increasingly mature big data technology to effectively mine and analyze these data and discover the hidde...

Claims


Application Information

Patent Timeline
Patent Type & Authority Patents(China)
IPC IPC(8): H04L29/08
CPCH04L67/06H04L67/10H04L67/568H04L67/60
Inventor 张星明李作权梁桂煌陈霖古振威
Owner SOUTH CHINA UNIV OF TECH
Learn More