Method for detecting potency of heparin or heparin with low molecular weight through a coagulometer
A technology of low molecular weight heparin and blood coagulation instrument, which is applied in the detection field of heparin (salt) or low molecular weight heparin (salt) anti-Xa titer by blood coagulation instrument, and can solve the problem of large error, high cost and chromogenic substrate method. Cumbersome and other problems, to achieve the effect of fast speed, low cost, and improved experimental accuracy
- Summary
- Abstract
- Description
- Claims
- Application Information
AI Technical Summary
Problems solved by technology
Method used
Image
Examples
Embodiment 1
[0033] (1) Configuration of standard series solutions
[0034] 1.1 Tris-NaCl buffer solution (PH7.4)
[0035] Take 6.08g of trishydroxymethylaminomethane and 8.77g of sodium chloride, add 500ml of water to dissolve, add 10g of bovine serum albumin, adjust the pH value to 7.4 with hydrochloric acid, and add water to dilute to 1000ml.
[0036] 1.2 Tris-EDTA disodium buffer solution (PH8.4)
[0037] Take 5.12g of sodium chloride, 3.03g of trishydroxymethylaminomethane and 1.4g of disodium edetate, add 250ml of water to dissolve, adjust the pH value to 8.4 with hydrochloric acid, and dilute to 500ml with water.
[0038] 1.3 Antithrombin (ATIII) solution
[0039] Make a solution containing 1 IU per 1 ml of water.
[0040] 1.4 Chromogenic substrate S-2765 (or other FXa-specific chromogenic substrate) solution
[0041] Make a 0.003mol / L solution with water, and dilute to 0.0005mol / L with Tris-EDTA disodium buffer solution (PH8.4) before use.
[0042] 1.5 Factor Xa (FXa) solution...
Embodiment 2
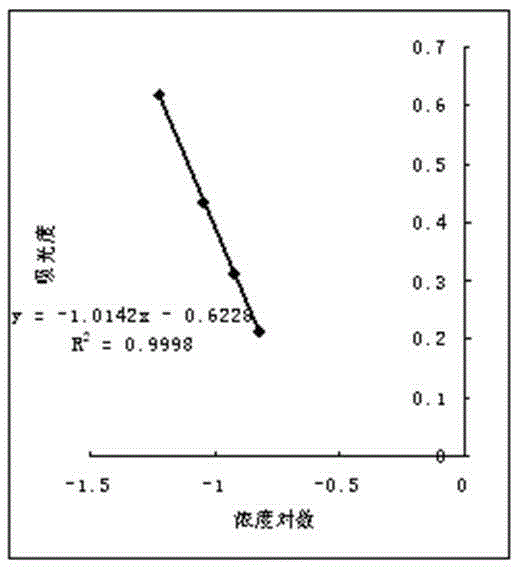
[0061] The concentrations of the standards and other reagents in the assay can be varied as long as the absorbance at several points is linearly related to the logarithm of the concentration. Use the first sample with a concentration of 0.2IU / ml to draw a standard curve (the addition of FXa is 60ul and the dilution ratio is 0.8).
[0062] The experimental data are as follows:
[0063]
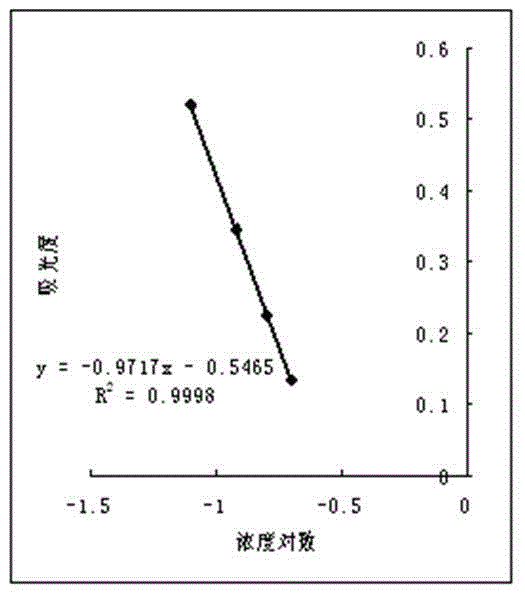
[0064] Draw a logarithmic curve with this data, such as figure 2 , the standard curve regression equation is: y=-0.9717x-0.5464, the linear correlation coefficient R 2 =0.9998 (x is logarithm of concentration, y is absorbance).
[0065] Take the 0.2IU / ml sample as the sample to be tested, measure the absorbance after the reaction, and calculate the actual concentration by using the concentration logarithm-absorbance standard curve. Three parallel experiments were done at the same concentration (0.2IU / ml), and the results were as follows:
[0066] Absorbance 0.134 0.132 0.13...
Embodiment 3
[0069] The potency determination of the sample to be tested is heparin sodium: take the sample to be tested and estimate the potency, dilute and detect according to the low molecular weight heparin sodium assay method in Example 1, as long as the absorbance is within the linear range, the obtained linear equation can be used to calculate the potency. As the dilution ratio 0.8 times of embodiment 1 and embodiment 2 becomes 0.5 times, the results can be obtained as follows:
[0070]
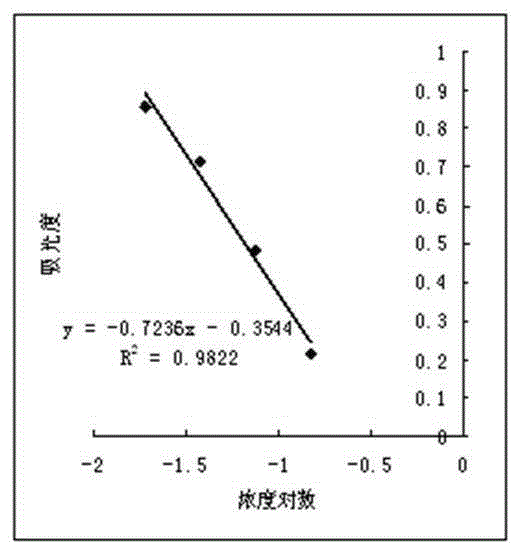
[0071] Draw a logarithmic curve with this data, such as image 3 , the standard curve regression equation is: y=-0.7236x-0.3544, the linear correlation coefficient R 2 =0.9822 (x is the logarithm of the concentration, y is the absorbance).
[0072] That is to say, increasing the dilution ratio can make the standard curve cover a larger range and further save reagents.
PUM
 Abstract
Description
Claims
Application Information
 - R&D
- Intellectual Property
- Life Sciences
- Materials
- Tech Scout
- Unparalleled Data Quality
- Higher Quality Content
- 60% Fewer Hallucinations
Browse by: Latest US Patents, China's latest patents, Technical Efficacy Thesaurus, Application Domain, Technology Topic, Popular Technical Reports.
© 2025 PatSnap. All rights reserved.Legal|Privacy policy|Modern Slavery Act Transparency Statement|Sitemap|About US| Contact US: help@patsnap.com


