A simplification method of near-infrared spectroscopy quantitative model based on principal component analysis
A near-infrared spectroscopy and principal component analysis technology, applied in the field of near-infrared spectroscopy quantitative model simplification based on principal component analysis technology, can solve the problems of model overfitting, easy to fall into local optimum, long calculation cycle of genetic algorithm, etc. Reliable results, high practical value, accurate extraction effect
- Summary
- Abstract
- Description
- Claims
- Application Information
AI Technical Summary
Problems solved by technology
Method used
Image

Examples
Embodiment 1
[0028] The content of total sugar components in tobacco samples was determined by near-infrared spectroscopic analysis. The specific steps are as follows:
[0029] 1) A quantitative analysis model was established by measuring the near-infrared spectra of 1003 tobacco samples. The spectra were measured by an MPA FT-NIR spectrometer (Bruker, Germany), with a wavenumber range of 3999.8-11996 cm -1 (2500.2-833.7nm), the sampling interval is about 4 wavenumbers, a total of 2074 wavelength variables. Adopt AAIII type continuous flow analyzer (BRAN+LUBBE, Germany) to determine the content of total sugar in the sample according to the standard method;
[0030] 2) Use continuous wavelet transform (Haar wavelet, scale factor 20) to preprocess the collected sample spectrum to subtract the influence of background drift. Use the KS algorithm to divide the preprocessed sample spectrum into three parts: training set, test set and prediction set. The number of samples in the training set is...
Embodiment 2
[0039] The content of nicotine components in tobacco samples was determined by near-infrared spectroscopic analysis. The specific steps are as follows:
[0040] 1) A quantitative analysis model was established by measuring the near-infrared spectra of 1003 tobacco samples, and the spectra used Antaris TM Measured by II FT-NIR spectrometer (Thermo Electron Corporation, USA), the wavenumber range is 4000-10000cm -1 (2500-1000nm), the sampling interval is about 4 wavenumbers, a total of 1557 wavelength variables. Adopt AAIII type continuous flow analyzer (BRAN+LUBBE, Germany) to measure the content of nicotine in the sample according to standard method;
[0041] 2) Use continuous wavelet transform (Haar wavelet, scale factor 20) to preprocess the collected sample spectrum to subtract the influence of background drift. Use the KS algorithm to divide the preprocessed sample spectrum into three parts: training set, test set and prediction set. The number of samples in the traini...
Embodiment 3
[0050] The content of total nitrogen in tobacco samples was determined by near-infrared spectroscopic analysis. Establish a quantitative analysis model by measuring the near-infrared spectra of 1003 tobacco samples, using Antaris TM Measured by II FT-NIR spectrometer (Thermo Electron Corporation, USA), the wavenumber range is 4000-10000cm -1 (2500-1000nm), the sampling interval is about 4 wavenumbers, a total of 1557 wavelength variables. AAIII type continuous flow analyzer (BRAN+LUBBE, Germany) was used to determine the content of total nitrogen in the samples according to the standard method. The implementation steps are basically the same as those in Examples 1 and 2, wherein the number of model factors of the partial least squares regression is 12.
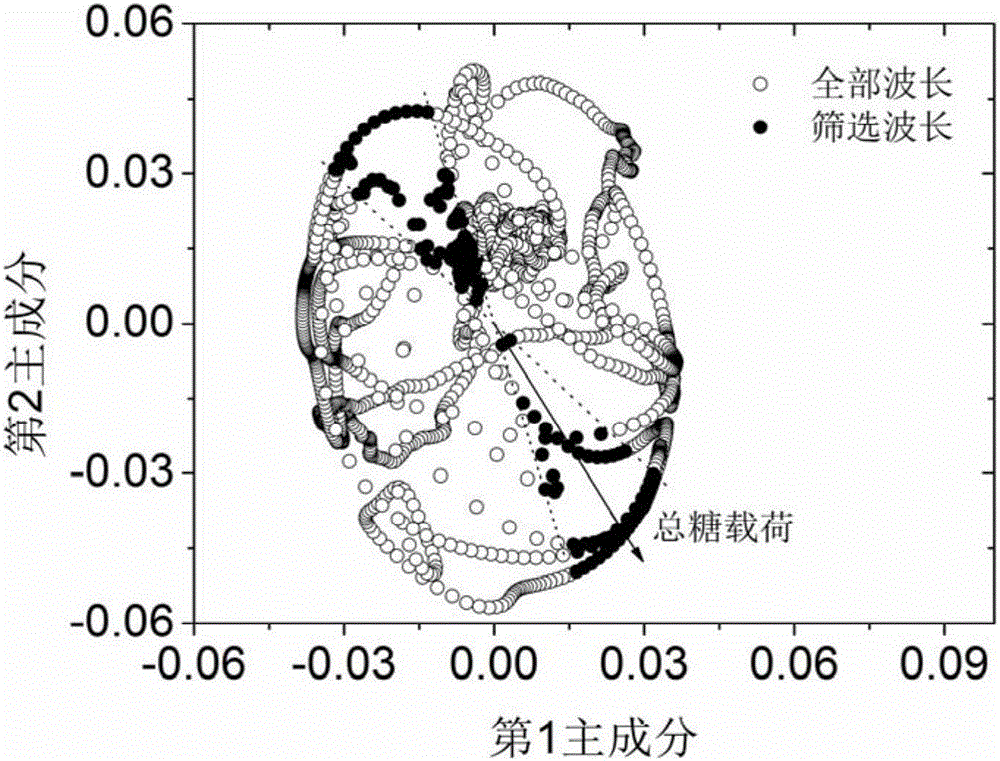
[0051] Figure 6 It is the load distribution diagram of the near-infrared spectrum wavelength variable, the selected wavelength variable and the total sugar component of the tobacco sample on the 1 and 2 principal component...
PUM
 Abstract
Description
Claims
Application Information
 - R&D
- Intellectual Property
- Life Sciences
- Materials
- Tech Scout
- Unparalleled Data Quality
- Higher Quality Content
- 60% Fewer Hallucinations
Browse by: Latest US Patents, China's latest patents, Technical Efficacy Thesaurus, Application Domain, Technology Topic, Popular Technical Reports.
© 2025 PatSnap. All rights reserved.Legal|Privacy policy|Modern Slavery Act Transparency Statement|Sitemap|About US| Contact US: help@patsnap.com