
Method for chart interpretation of water content of oil well

A technology of water cut and oil well, which is applied in the field of fluid production profile logging interpretation in oilfields, can solve the problems of large water cut interpretation errors, and achieve the effect of increasing crude oil production and interpretation accuracy

Active Publication Date: 2014-01-29
CHINA PETROLEUM & CHEM CORP +1
View PDF4 Cites 9 Cited by
  • Summary
  • Abstract
  • Description
  • Claims
  • Application Information

AI Technical Summary

Problems solved by technology

Especially the output (flow rate) is less than 100m 3 / d low-production well section, the interpretation error of water cut is very large, which is a major technical shortcoming for liquid production profile logging with the ultimate goal of calculating oil and water production

Method used


Image

  • Method for chart interpretation of water content of oil well
  • Method for chart interpretation of water content of oil well
  • Method for chart interpretation of water content of oil well

Examples


Embodiment 1

[0145] Well TK112H is a development horizontal well in XX Oilfield. The well was drilled to a depth of 4,986 meters, with a horizontal section length of 278 meters. In order to understand the formation fluid production situation of the horizontal section of the well at present and find out the main water production sections, the fluid production profile logging of the horizontal well under production conditions was carried out by using the crawler construction technology and the new SONDEX multi-parameter production testing technology. The measured well section ranges from 4670 meters to 4977 meters, and the effective interpretation interval is 4709 meters to 4977 meters.

[0146] Interpretation of moisture content and other parameters using the technique of the present invention

[0147] 1. Use the simulated oil well experimental device to conduct experiments, and measure the water holdup in the well under the conditions of known water cut, total flow rate, well inclination ...


PUM


Abstract

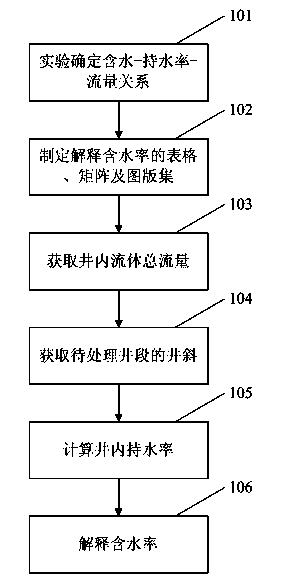
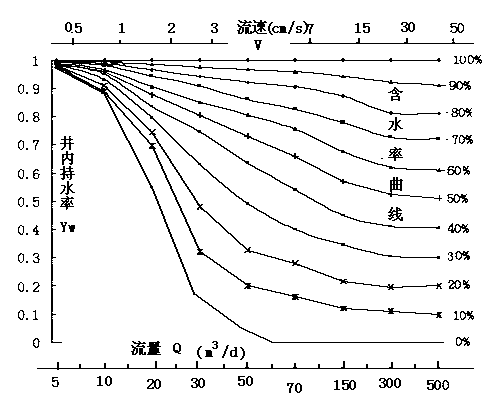
The invention provides a method for chart interpretation of the water content of oil well. The method comprises the steps that 1, multiple experiments are carried out through an oil well simulation experiment device and the standard water holding rate inside the oil well is measured; 2, according to experiment results of the step 1, a form and an array for chart interpretation of the water holding rate-the water content and a general interpretation chart are made; 3, a total flow numerical value of fluid inside the oil well is obtained according to flow logging information; 4, according to the logging information or drilling data, a well deviation numerical value of a well section to be treated is obtained; 5, according to the characteristics of a water holding rate instrument and a log response, the water holding rate inside the oil well is calculated; 6, chart interpretation is conducted on the water holding rate and the oil-water yield is calculated. The method for chart interpretation of the water content of the oil well is suitable for interpretation of the water content of any non-flow-collecting water holding rate instrument, the water content is no longer obtained according to manual qualitative judgments, the water content is obtained in a quantitative mode according to the interpretation chart, and the interpretation accuracy is improved.

Description

technical field [0001] The invention relates to the technical field of well logging interpretation of fluid production profiles in oil fields, in particular to a method for interpreting oil well water cut with a chart. Background technique [0002] Oil wells need to perform non-stop logging during production, the purpose is to measure the oil and water production at different depths under the state of fluid flow in the oil well. The logging to achieve this goal is called fluid production profile logging. [0003] Existing instruments for measuring liquid production profiles can measure multiple parameters of well fluid and well conditions, such as "seven parameters" such as water holdup, flow rate, density, temperature, pressure, gamma, and magnetic positioning. However, for measuring oil, For well logging with water production as the target, another important parameter-water cut is needed to calculate oil and water production. Water cut cannot be directly measured by logg...

Claims


Application Information

Patent Timeline
Patent Type & Authority Applications(China)
IPC IPC(8): E21B47/00
Inventor 李山生谢景平王学元姜文芝王强赵国华刘树勤
Owner CHINA PETROLEUM & CHEM CORP
Learn More