Gathering abnormity detection method for single sensor data flow
An anomaly detection and single data stream technology, applied in the field of anomaly detection, can solve the problems that the anomaly detection method cannot meet the real-time requirements, and achieve the effect of reducing the amount of calculation and increasing the efficiency of algorithm execution
- Summary
- Abstract
- Description
- Claims
- Application Information
AI Technical Summary
Problems solved by technology
Method used
Image
Examples
specific Embodiment approach 1
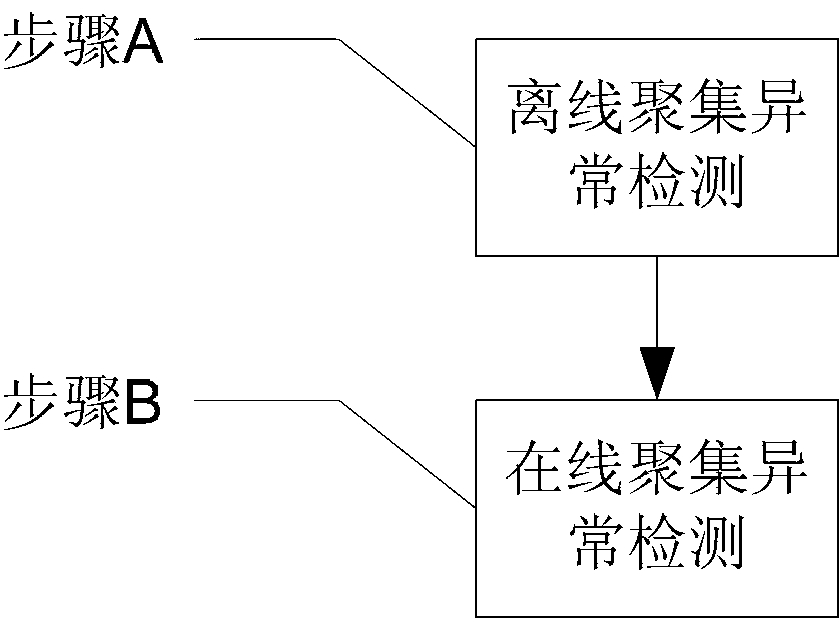
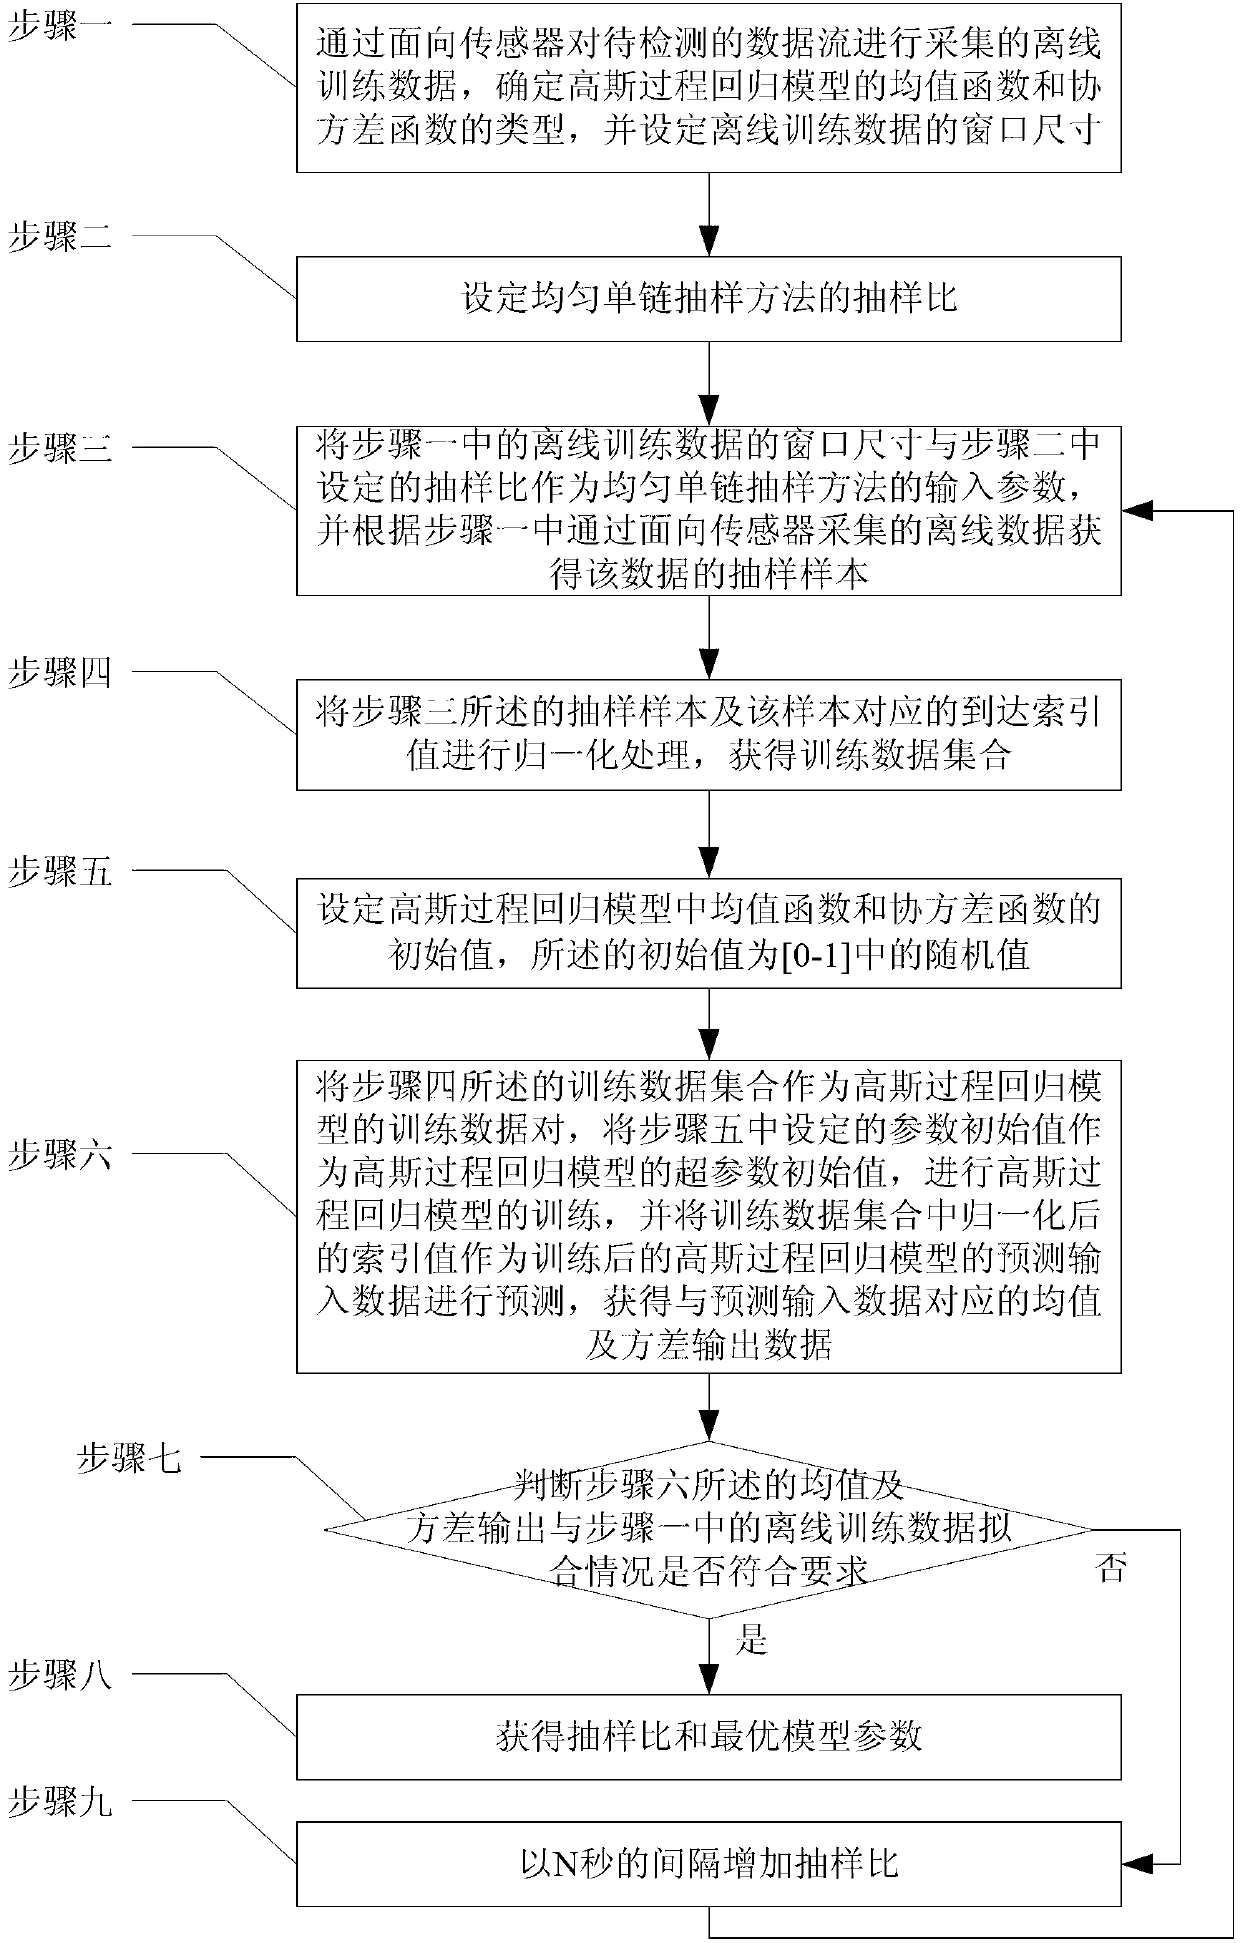
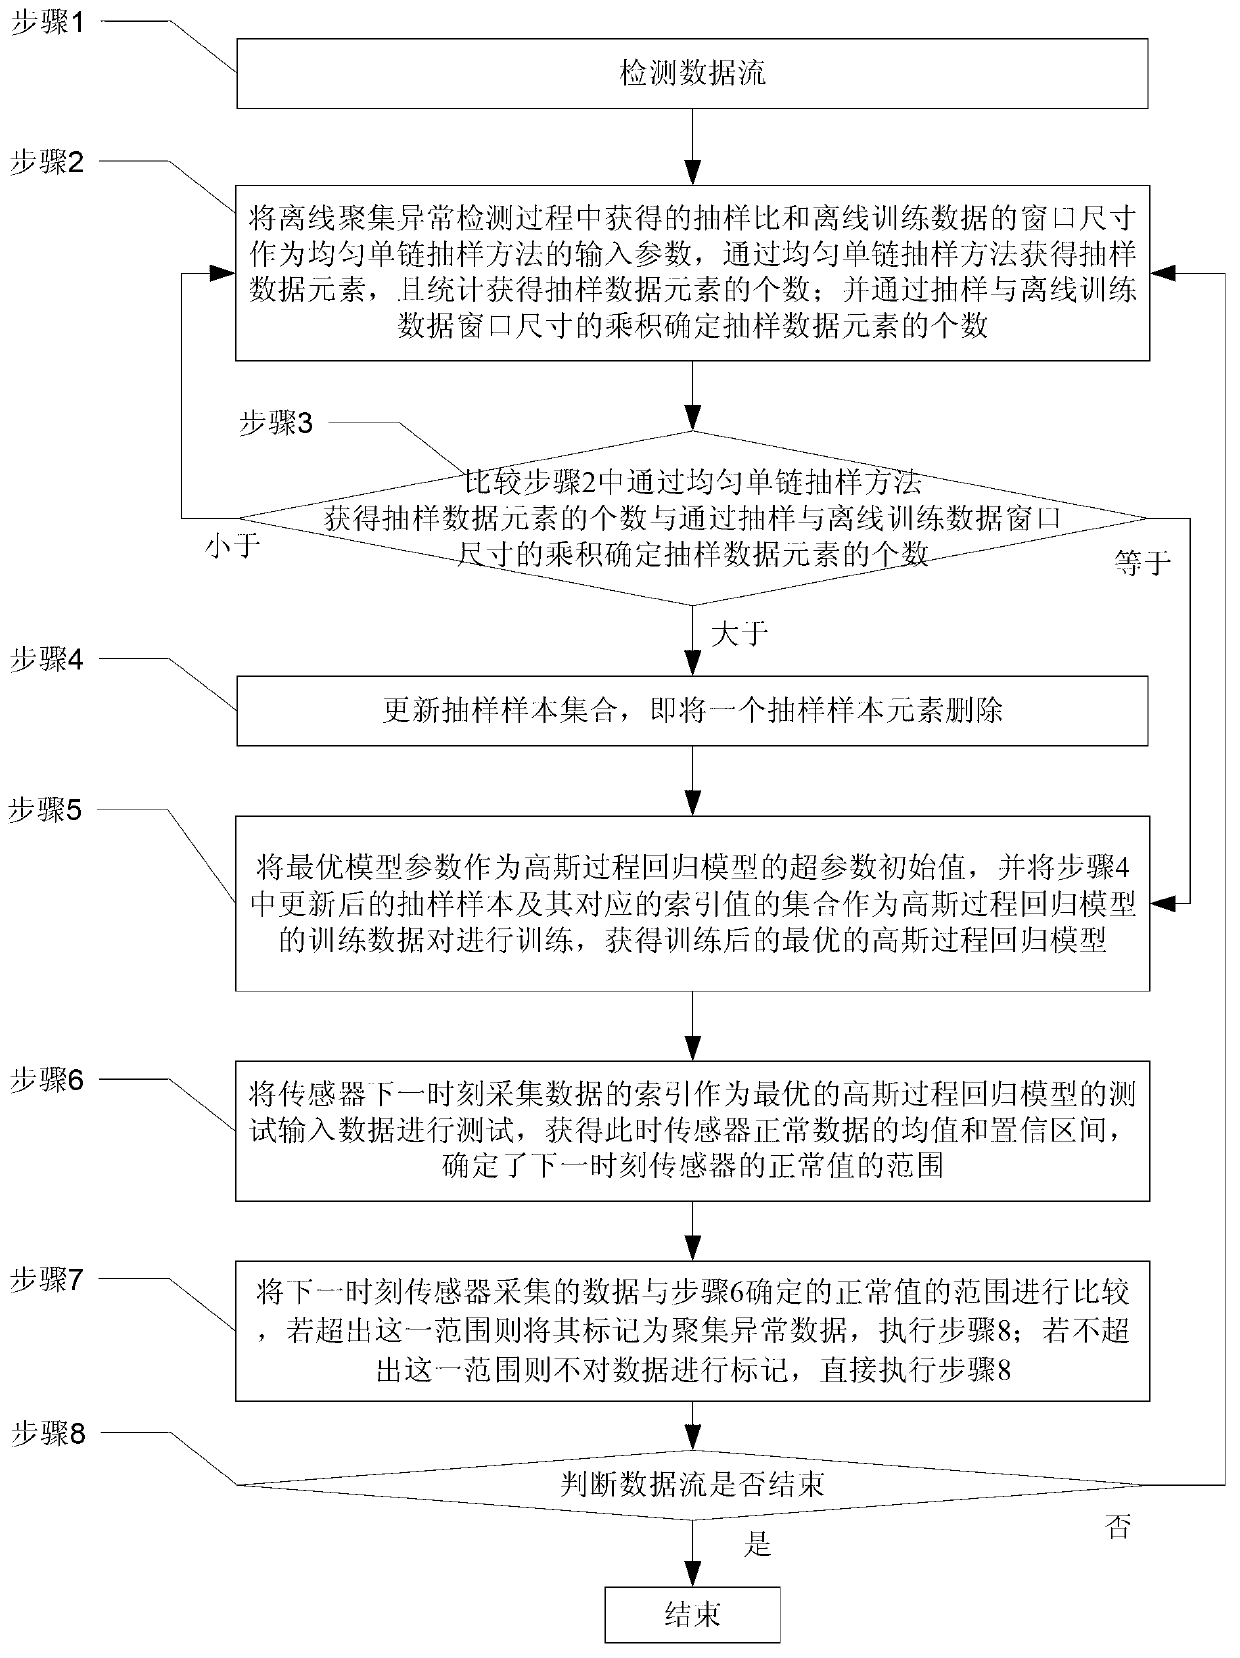
[0058] Specific implementation mode 1. Combination Figure 1 to Figure 3 This embodiment is specifically described. The sensor single data flow-oriented aggregation anomaly detection method described in this embodiment includes the following steps:
[0059] Step A. Offline aggregation anomaly detection:
[0060] Step 1. Determine the type of the mean function and covariance function of the Gaussian process regression model through the offline training data collected by the sensor for the data stream to be detected, and set the window size of the offline training data, and perform step 2;
[0061] Step 2. Set the sampling ratio of the uniform single-chain sampling method, and perform step 3;
[0062] Step 3. Use the window size of the offline training data in step 1 and the sampling ratio set in step 2 as the input parameters of the uniform single chain sampling method, and obtain the sampling of the data according to the offline data collected by the sensor in step 1 sample,...
specific Embodiment approach 2
[0162] Specific embodiment two, combine Figure 4 Describe this embodiment in detail. The difference between this embodiment and the sensor single data stream-oriented aggregation anomaly detection method described in Embodiment 1 is that the training data set described in Step 4 is used as the Gaussian process regression model in Step 6. For the training data pair, the initial value of the parameter set in step 5 is used as the initial value of the hyperparameter of the Gaussian process regression model to train the Gaussian process regression model, and the normalized index value in the training data set is used as the post-training The specific process of obtaining the mean value and variance output data corresponding to the predicted input data is as follows:
[0163] Step a. Obtain the training data of the Gaussian process regression model according to the set sampling ratio, including sampling samples and their corresponding index values;
[0164] Step b, determining th...
specific Embodiment approach 3
[0167] Specific embodiment three, combine Figure 5 Describe this embodiment in detail. The difference between this embodiment and the sensor single data stream-oriented aggregation anomaly detection method described in the first embodiment is that the uniform single-chain sampling method includes the following steps:
[0168] Step e, start, receive data stream; execute step f;
[0169] Step f, judging whether the received data element is the first data element, if so, execute step g, if not, execute i;
[0170] Step g, store the data element as a sample element, and execute step h;
[0171] Step h, randomly select an index value in the next small window, and execute step i;
[0172] Step i, judging whether the data element with the smallest index value among all the sampling sample elements obtained after being stored in step g is expired, if so, execute step j; if not, execute step k;
[0173] Step j, delete the data element with the smallest index among all the sampling ...
PUM
 Abstract
Description
Claims
Application Information
 - R&D
- Intellectual Property
- Life Sciences
- Materials
- Tech Scout
- Unparalleled Data Quality
- Higher Quality Content
- 60% Fewer Hallucinations
Browse by: Latest US Patents, China's latest patents, Technical Efficacy Thesaurus, Application Domain, Technology Topic, Popular Technical Reports.
© 2025 PatSnap. All rights reserved.Legal|Privacy policy|Modern Slavery Act Transparency Statement|Sitemap|About US| Contact US: help@patsnap.com


