Method for automatically surveying and mapping growth curve of microorganism in food
A growth curve and microbial technology, which is applied in the preparation of test samples, measuring devices, and measuring electrical variables, etc., can solve the problems of expensive reagents, dependence on imports, and restrictions on the research level of food-borne pathogenic bacteria. Effects of stability, improved accuracy, and enhanced signal-to-noise ratio
- Summary
- Abstract
- Description
- Claims
- Application Information
AI Technical Summary
Problems solved by technology
Method used
Image
Examples
Embodiment 1
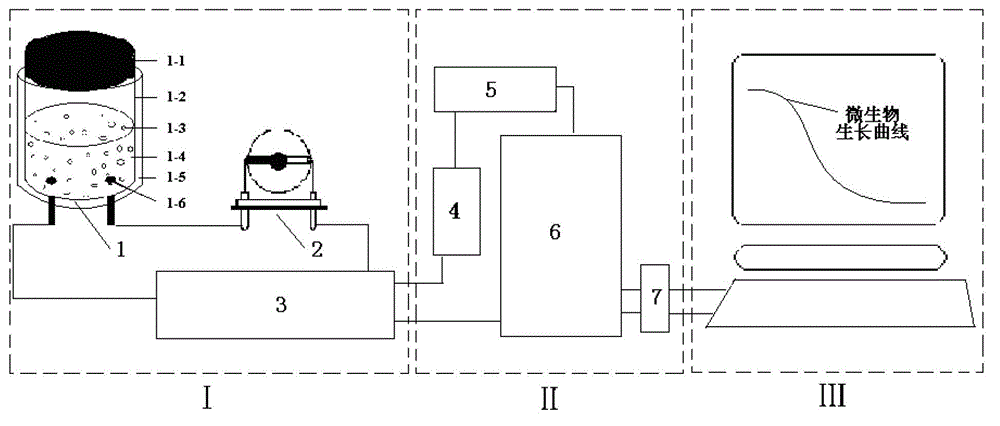
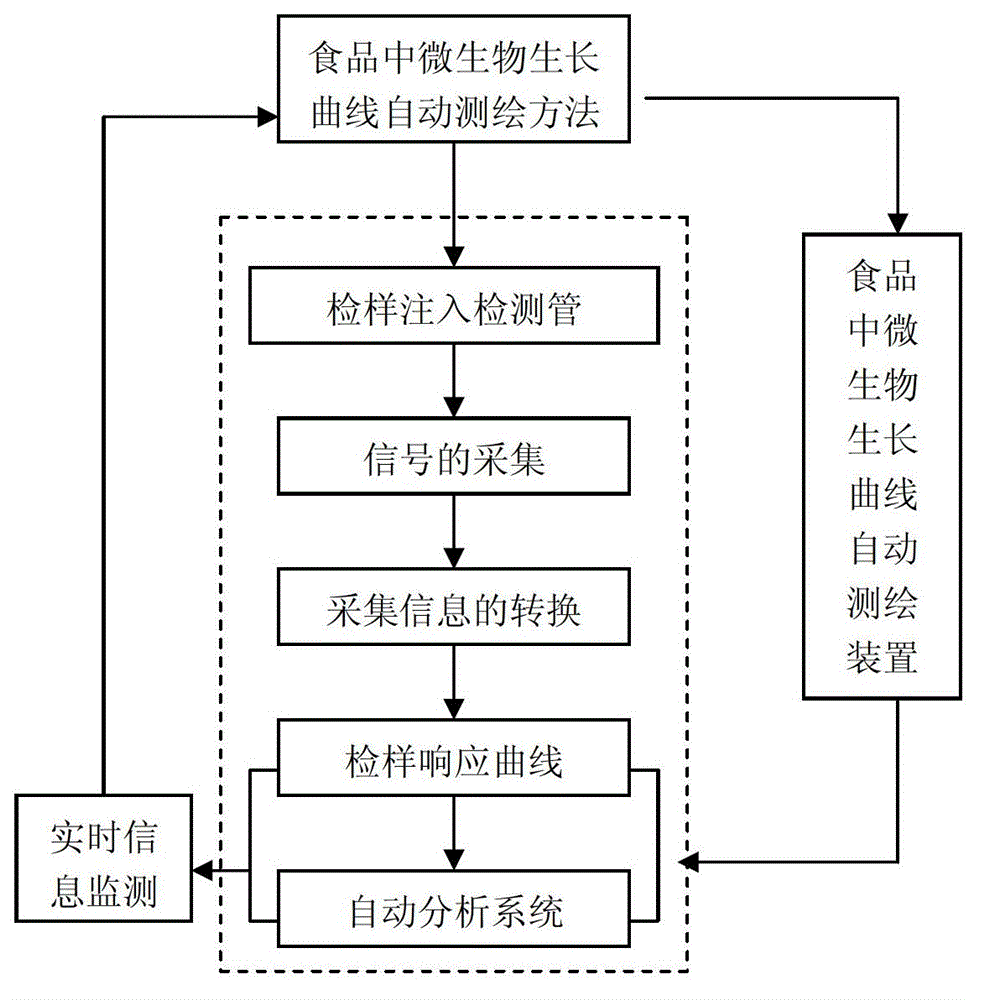
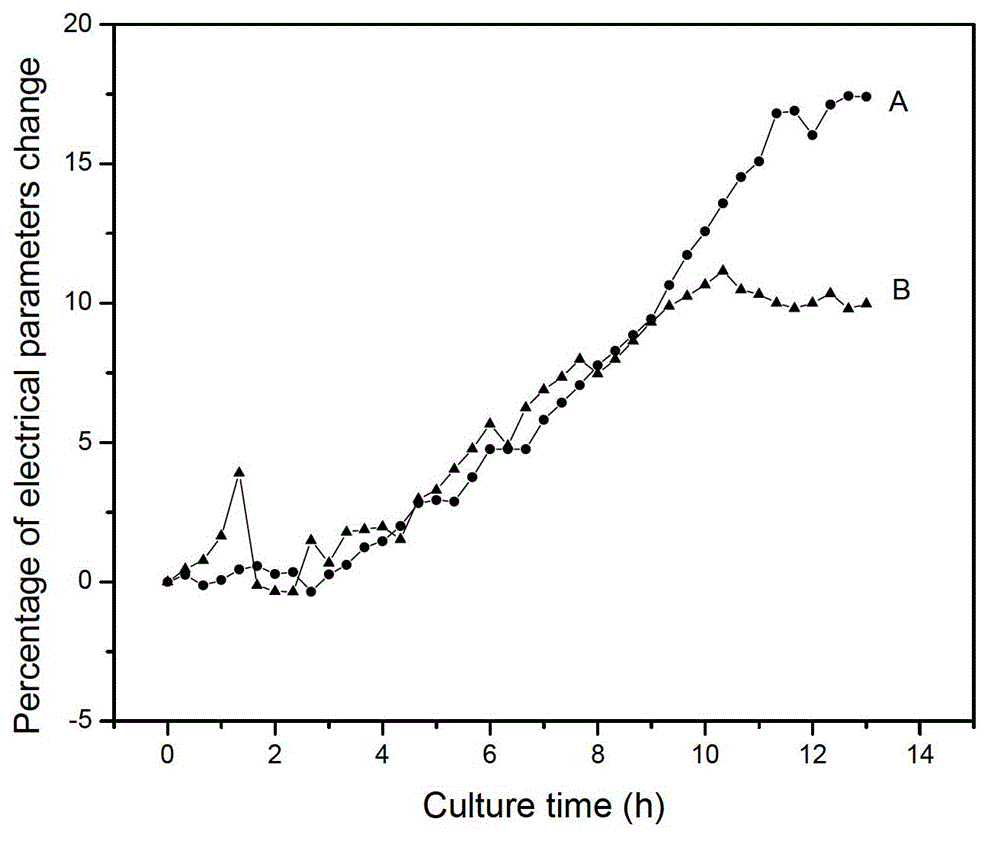
[0041] Using the automatic surveying and mapping device of microbial growth curve in food and such as figure 2 The method shown for 10 5 Growth process curve of E. coli in cfu / mL (see Figure 4 Curve A, Figure 4 Curve B is a blank reference) for real-time mapping and growth curves obtained by plate counting (see Figure 4 Curve C) for comparison. from Figure 4 It can be seen that in section ab, Escherichia coli is in the lagging phase, and does not divide immediately for a period of time, the number of Escherichia coli remains constant, or increases very little, and the properties of the medium do not change significantly, so the frequency shift does not change significantly; The bc stage is the exponential growth period of Escherichia coli. The physiological metabolism of Escherichia coli converts carbohydrates, lipids and proteins in the medium into electroactive substances, which significantly changes the properties of the medium. The piezoelectric bulk acoustic wave...
Embodiment 2
[0043] The typical growth curves of fresh milk samples with different initial concentrations of bacteria were measured by an automatic surveying device for microbial growth curves in food. The results are as follows: Figure 5 shown. It can be seen from the figure that the greater the initial concentration of bacteria, the smaller the MDT, and conversely, the smaller the initial concentration of bacteria, the greater the MDT. The initial concentration of bacteria is about 10-10 6 At cfu / mL, there is a linear relationship between the logarithm of the initial bacterial concentration and the MDT, and the specific relationship is as follows:
[0044] LgC=7.216-0.432MDT (4)
[0045] In the formula, C is the initial concentration of microorganisms in the fresh milk sample, MDT is the detection time of microorganisms, and its correlation coefficient is about 0.96, indicating that there is a linear relationship between MDT and the logarithm of the initial concentration of bacteria i...
Embodiment 3
[0047] The microbial growth curve in rice noodles was surveyed and mapped in real time by using the automatic surveying and mapping device for microbial growth curve in food, the results can be found in Image 6 , Curve A is the growth curve of rice noodles after 121°C and 10min treatment, curves B and C are the growth curves of rice noodles after 80°C and 2min treatment, and curves D, E and F are the growth curves of microorganisms in untreated rice noodles Growth curve. from Image 6 It can be seen that there is no obvious frequency shift change in curve A, and there is no microbial detection time. It can be inferred that after the rice noodles are treated at 121 ° C for 10 minutes, the microorganisms in it can be completely inhibited; Curves B and C do not show significant changes until about 10 hours later. The change of frequency shift shows that the growth of microorganisms in rice flour is inhibited after 2min treatment at 80°C, and most of the microorganisms are kille...
PUM
 Abstract
Description
Claims
Application Information
 - Generate Ideas
- Intellectual Property
- Life Sciences
- Materials
- Tech Scout
- Unparalleled Data Quality
- Higher Quality Content
- 60% Fewer Hallucinations
Browse by: Latest US Patents, China's latest patents, Technical Efficacy Thesaurus, Application Domain, Technology Topic, Popular Technical Reports.
© 2025 PatSnap. All rights reserved.Legal|Privacy policy|Modern Slavery Act Transparency Statement|Sitemap|About US| Contact US: help@patsnap.com


