
Method for oil and gas detection by utilizing seismic data instantaneous frequency attribute

An instantaneous frequency, oil and gas detection technology, applied in the field of seismic exploration data processing, can solve the problems of uncertainty in scale factor and frequency, insufficient time-frequency resolution, unable to fully indicate oil and gas, etc., to achieve strong time-frequency resolution, avoid high Frequency interference, less demanding effects

Active Publication Date: 2010-12-22
BC P INC CHINA NAT PETROLEUM CORP +1
View PDF4 Cites 16 Cited by
  • Summary
  • Abstract
  • Description
  • Claims
  • Application Information

AI Technical Summary

Problems solved by technology

Due to the strong absorption of earthquakes in the process of seismic wave propagation, the high-frequency energy is lost quickly. Under a certain signal-to-noise ratio, when the high-frequency noise interference is strong, the high-frequency absorption attenuation gradient is more likely to reflect the impact of noise. , cannot fully indicate oil and gas
[0005] At the same time, the absorption attenuation gradient calculation method based on the short-time Fourier transform has two serious shortcomings: (1) the time window of the short-time Fourier transform is fixed, and the time-frequency grid is equal in width, which cannot be changed with the frequency requirements. Not good for high and low frequency resolution
[0006] The wavelet transform in the actual data processing is discrete wavelet transform, the relationship between the scale factor and the frequency is uncertain, which will also cause the problem of insufficient time-frequency resolution

Method used


Image

  • Method for oil and gas detection by utilizing seismic data instantaneous frequency attribute
  • Method for oil and gas detection by utilizing seismic data instantaneous frequency attribute
  • Method for oil and gas detection by utilizing seismic data instantaneous frequency attribute

Examples


Embodiment Construction

[0030] The present invention uses the generalized S transform in the seismic exploration data to transform the seismic data into the time-frequency domain; combined with the difference in the instantaneous frequency of seismic wave absorption and attenuation, the time-frequency spectrum of the low-frequency band is fitted in the time-frequency domain to obtain a low The frequency band absorbs the attenuation gradient to better indicate oil and gas.

[0031] The present invention will be described in detail below in conjunction with the accompanying drawings.

[0032] The concrete realization steps of the present invention are as follows:

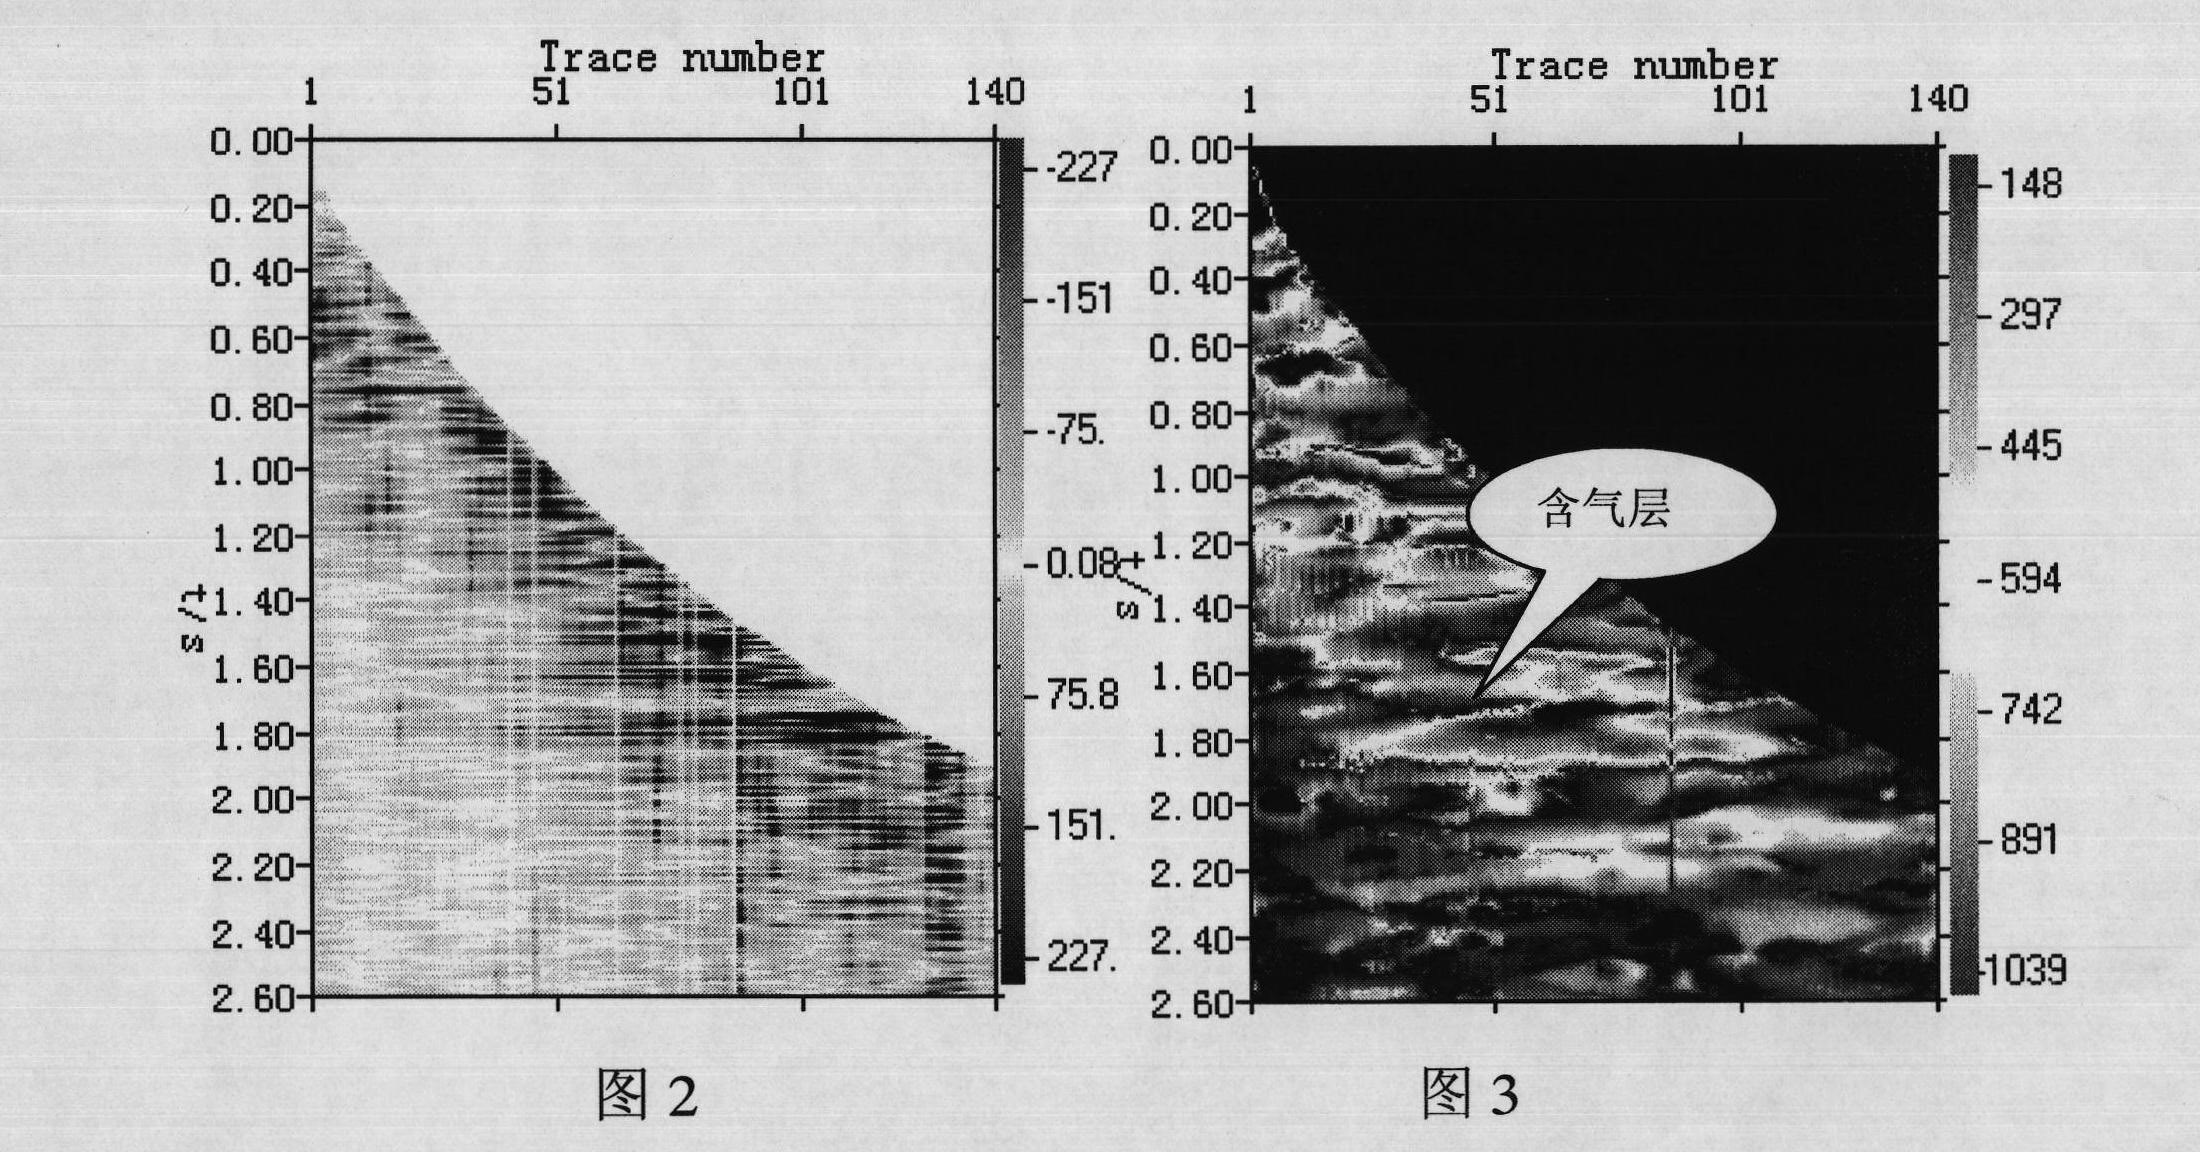
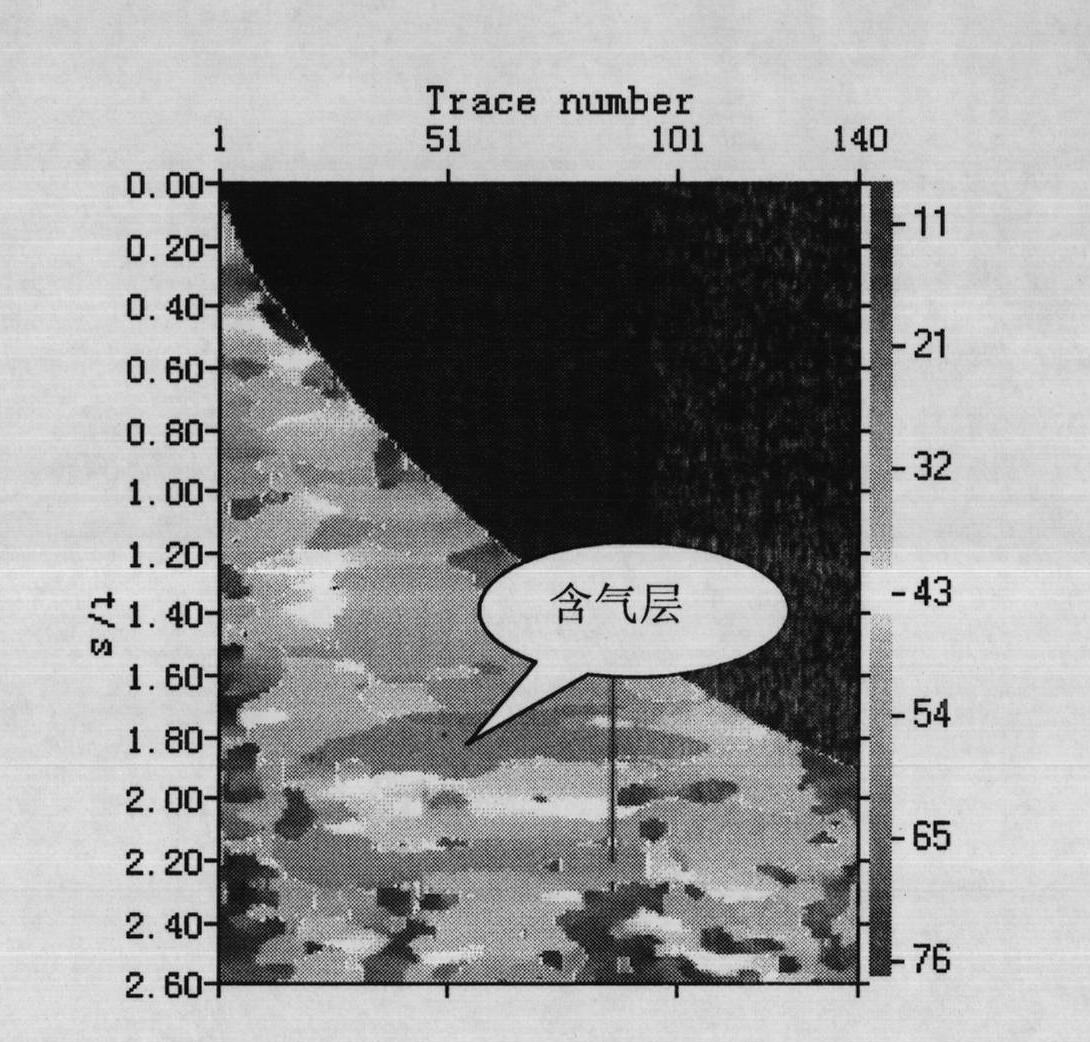
[0033] 1) Acquisition and recording of seismic raw data; figure 2 It is the up-going wave leveling profile after processing the VSP data of a certain well. According to drilling, the gas-bearing layer appears at 1.78-1.79S;

[0034] 2) Perform generalized S-transformation on the data in the frequency domain to obtain the time spectrum of ...


PUM


Abstract

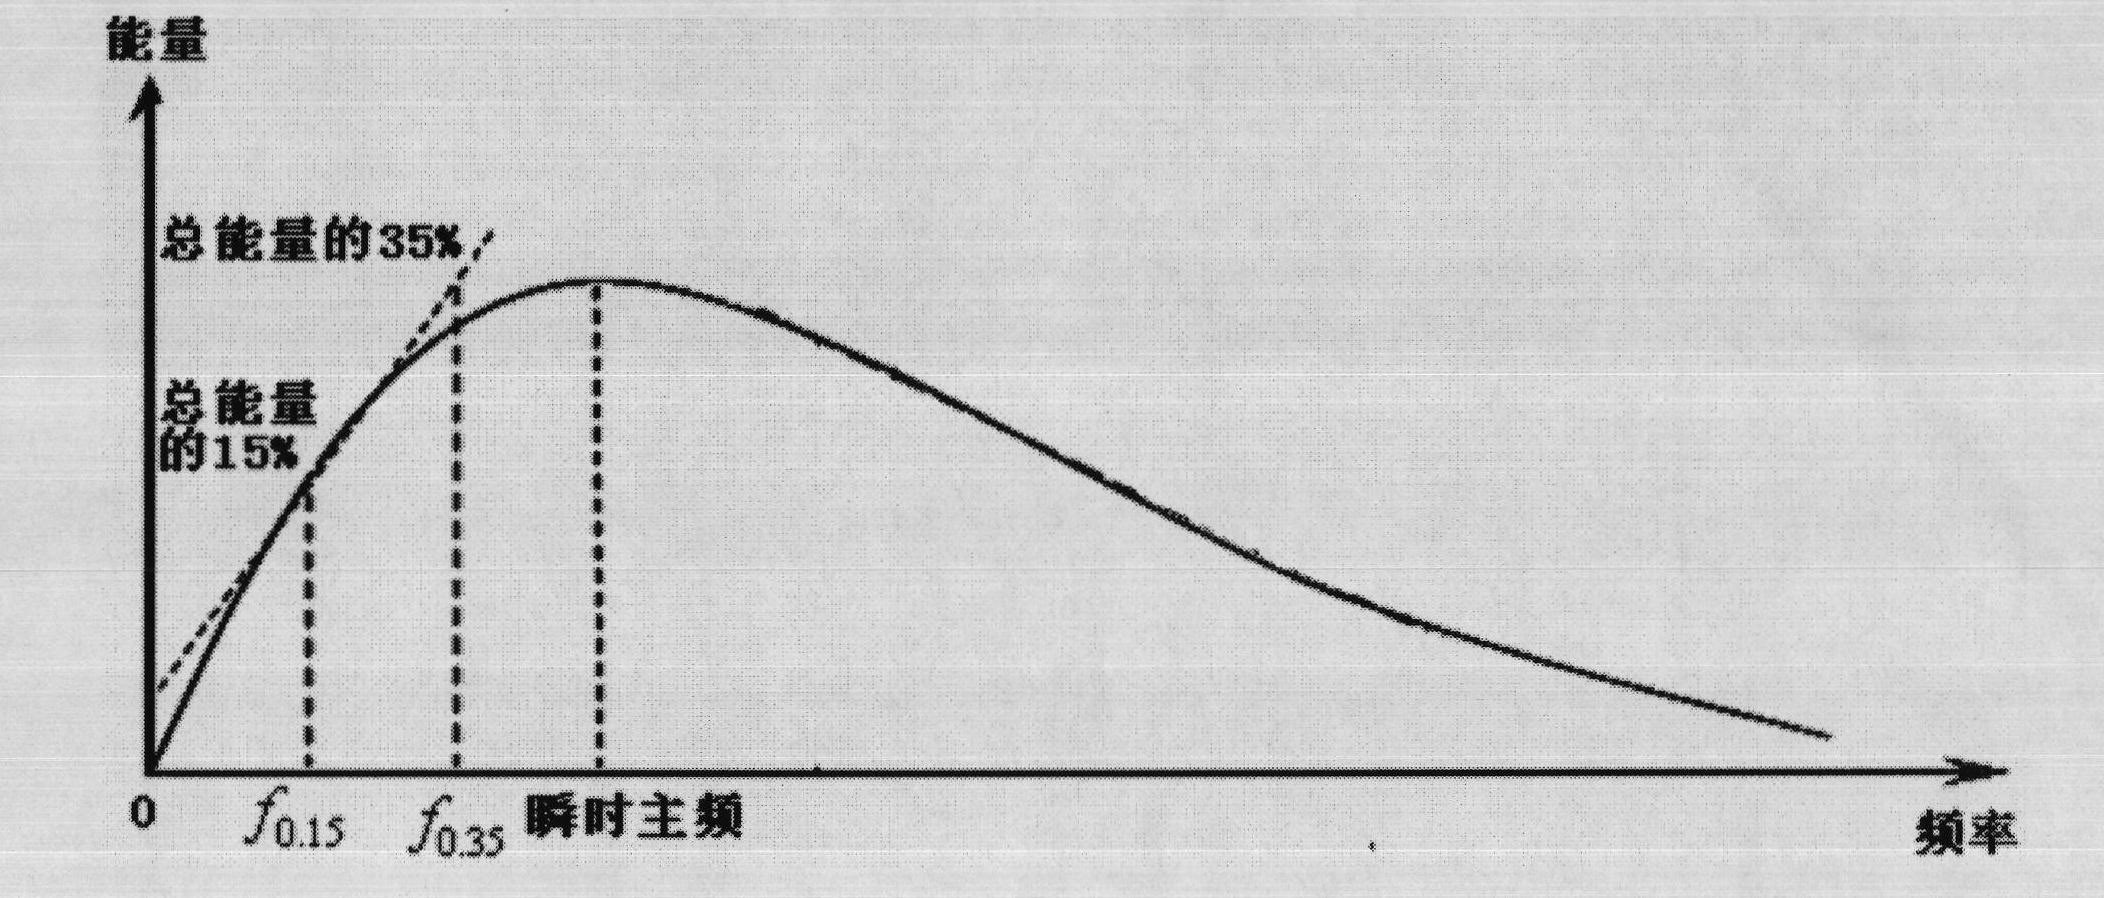
The invention aims to provide a method for oil and gas detection by utilizing seismic data instantaneous frequency attribute, which comprises the following steps of: acquiring and recording seismic initial data; carrying out generalized S transformation on the data in a frequency domain to obtain the time-frequency spectrum of each sampling point thereof, and determining the frequencies respectively corresponding to 15 percent and 35 percent of the total energy in the time-frequency spectrum as the initial frequency and the final frequency for computing low-frequency-band absorption attenuation gradient; after taking a natural logarithm from the time-frequency spectrum p (Tk, f) between the initial frequency and the final frequency and fitting by utilizing a least square method to obtain the low-frequency-band absorption attenuation gradient of the sampling point; and corresponding a position with strong low-frequency-band absorption attenuation gradient to a favorable oil and gas contained area, and determining an oil and gas detection result. The invention has lower requirements for signal-to-noise ratio, strong time-frequency resolution capability, simple algorithm and high computational efficiency.

Description

technical field [0001] The invention relates to seismic exploration data processing technology, which is a method for oil and gas detection by using the instantaneous frequency attribute of seismic data. Background technique [0002] In the interior and lower part of oil-gas-bearing layers, the energy of seismic waves will undergo obvious high-frequency attenuation, and it becomes possible to use seismic energy attenuation to predict oil and gas. [0003] Attenuation is the loss of the total energy of the seismic wave in the propagation of the underground medium, and it is an intrinsic property of the medium. There are two factors that cause seismic wave attenuation: internal and external factors: the internal factor that causes seismic wave attenuation is the energy loss between solids and solids, solids and liquids, and liquids and liquids in the medium; external factors mainly come from large-scale inhomogeneities Scattering by the medium. [0004] The current calculati...

Claims


Application Information

Patent Timeline
IPC IPC(8): G01V1/28
Inventor 张固澜李彦鹏彭继新容娇君张彦斌
Owner BC P INC CHINA NAT PETROLEUM CORP
Learn More