
Method and apparatus for displaying tabular data

A tabular data and data technology, applied in the field of data processing, can solve problems such as cumbersome process, non-open source code, low efficiency, etc., and achieve the effect of reducing scanning time and improving production efficiency

Active Publication Date: 2010-01-06
TENCENT TECH (BEIJING) CO LTD
View PDF0 Cites 14 Cited by
  • Summary
  • Abstract
  • Description
  • Claims
  • Application Information

AI Technical Summary

Problems solved by technology

[0087] The traditional method of designing templates can only be adapted to a single scenario. When the application scenario or data format needs to be changed, it is necessary to manually readjust the template and manually check and test to confirm whether there are errors. This process is cumbersome, inefficient, and inflexible. However, the method of using the Microsoft .Net development kit sometimes splits the data into multiple tables for display, which cannot achieve the purpose of displaying the data in the same table, and this method is not open source and can only be used for .Net environment, not easy to learn and transplant

Method used


Image

  • Method and apparatus for displaying tabular data
  • Method and apparatus for displaying tabular data
  • Method and apparatus for displaying tabular data

Examples


Embodiment Construction

[0103] In the technical solution provided by the present invention, its core idea is to automatically combine appropriate table headers through intelligent analysis, adjust nested and complex data rows into simple and flat data rows, and output and display; in addition, files can also be configured to automatically Automatically apply display styles for specific keywords or specific levels.

[0104] The technical solutions of the present invention will be clearly and completely described below in conjunction with the accompanying drawings in the present invention. Obviously, the described embodiments are some of the embodiments of the present invention, but not all of them. Based on the embodiments of the present invention, all other embodiments obtained by persons of ordinary skill in the art without making creative efforts belong to the protection scope of the present invention.

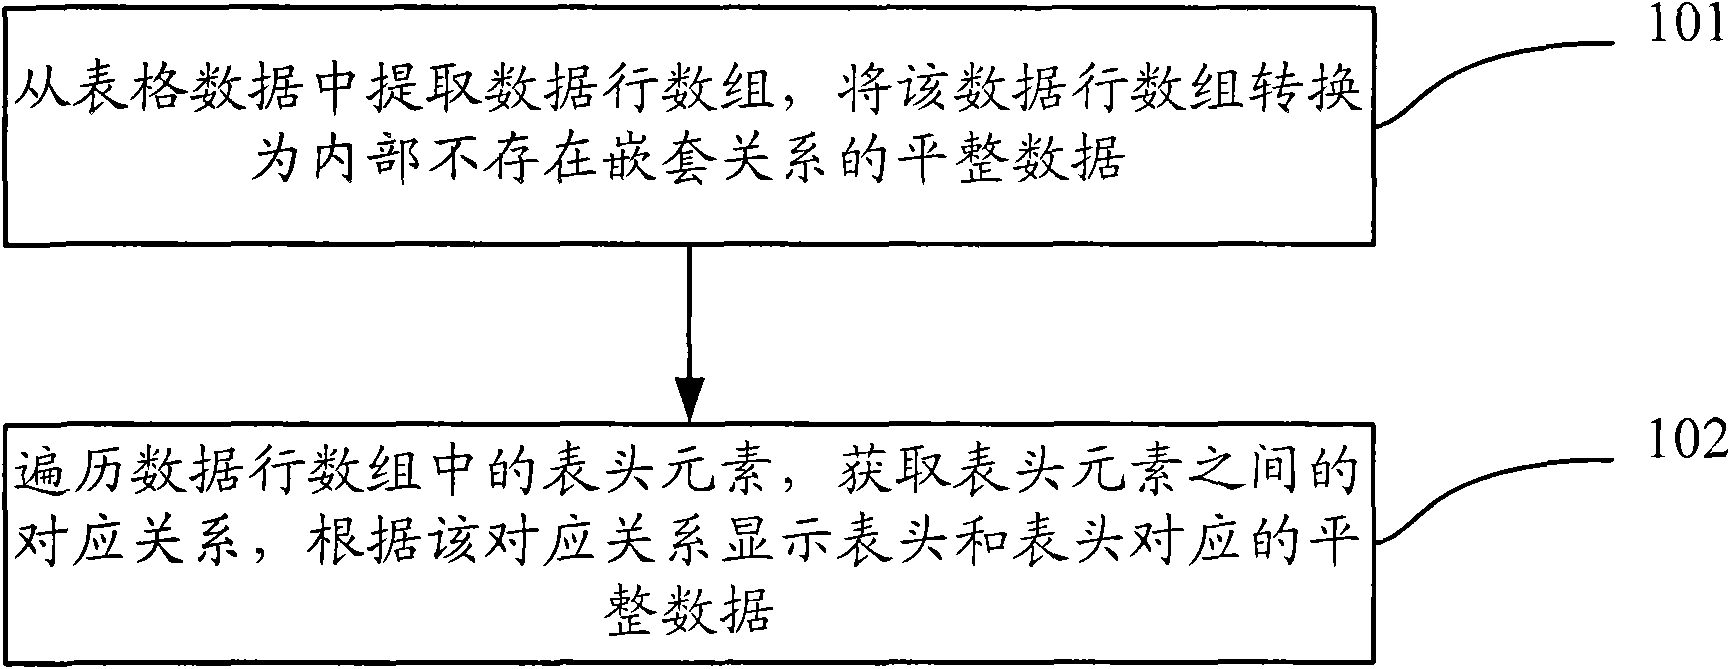
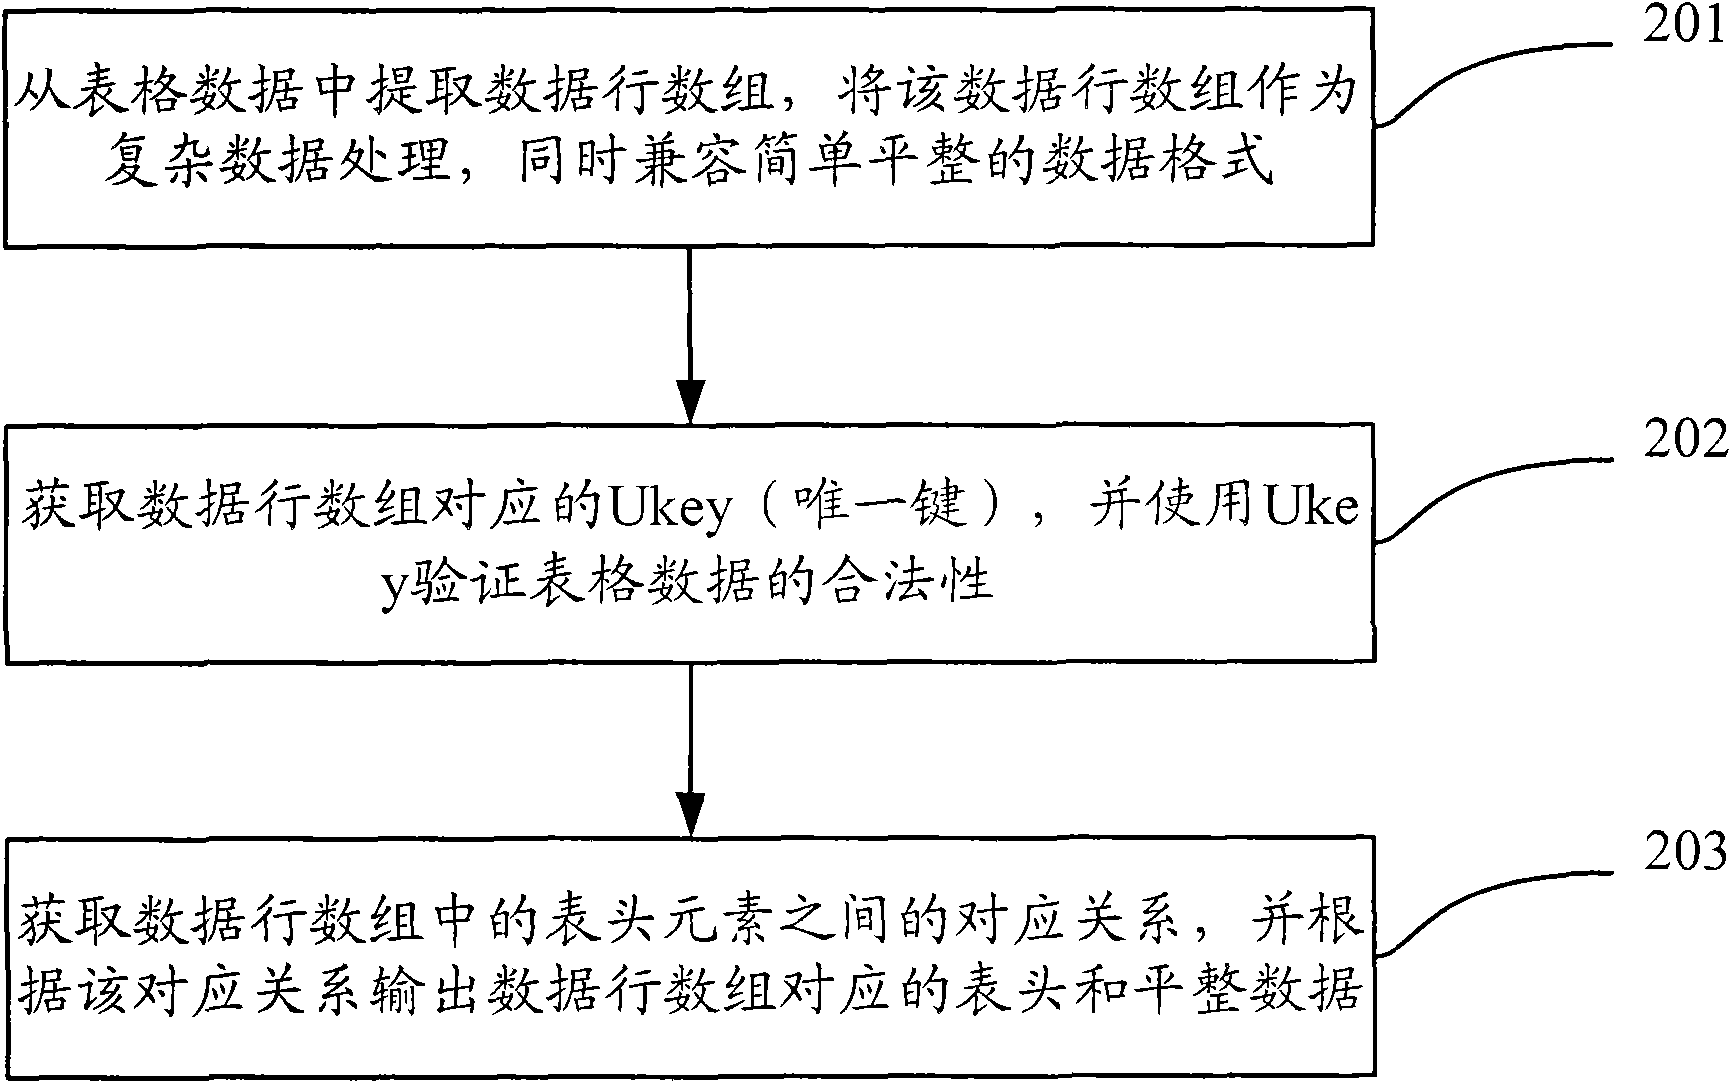
[0105] Such as figure 1 As shown, it is a flow chart of a method for displaying tabular data i...


PUM


Abstract

The invention discloses a method for displaying tabular data, comprising the following steps: extracting data line array from tubular data, and converting the data line array into leveling data without nesting relationship inside; traversing header elements in the data line array to obtain the relationship between the header elements; and displaying the header and leveling data corresponding to the header according to the relationship, wherein the header is formed by the header elements. In the invention, a header structure is generated adaptively, the complexity level relationship of the data is clearly displayed in the header and the data portion is displayed smoothly, thereby greatly improving the production efficiency. The invention also discloses an apparatus applying the method.

Description

technical field [0001] The invention relates to the technical field of data processing, in particular to a method and device for displaying tabular data. Background technique [0002] With the development of information technology, tabular data processing technology is widely used in industries such as planning, finance and statistics. Using tabular data processing technology, a large amount of data can be output in tabular form, which greatly facilitates the display and processing of data. [0003] Tabular data can be divided into simple table data and complex table data. The structure of simple table data is flat, and there is no nesting relationship of data sets in data rows. For example: [0004] Table( [0005] Array(Number1=>1, Number2=>2, Number3=>3, Number4=>4, Number5=>5, Number6=>6), [0006] Array(Number1=>1, Number2=>2, Number3=>3, Number4=>4, Number5=>5, Number6=>6) [0007] ) [0008] As shown in Table 1, it is the disp...

Claims


Application Information

Patent Timeline
Patent Type & Authority Applications(China)
IPC IPC(8): G06F17/30
Inventor 段云
Owner TENCENT TECH (BEIJING) CO LTD
Learn More