
Method for evaluating renal function

a renal function and renal function technology, applied in image data processing, analogue and hybrid computing, image data processing details, etc., can solve the problems of inability to evaluate renal function, inability to use inulin constant infusion in patients with severely reduced renal function, and inability to numerically integrate auc. to achieve the effect of convenient us

Active Publication Date: 2014-05-27
WESOLOWSKI CARL A
View PDF3 Cites 0 Cited by
  • Summary
  • Abstract
  • Description
  • Claims
  • Application Information

AI Technical Summary

Benefits of technology

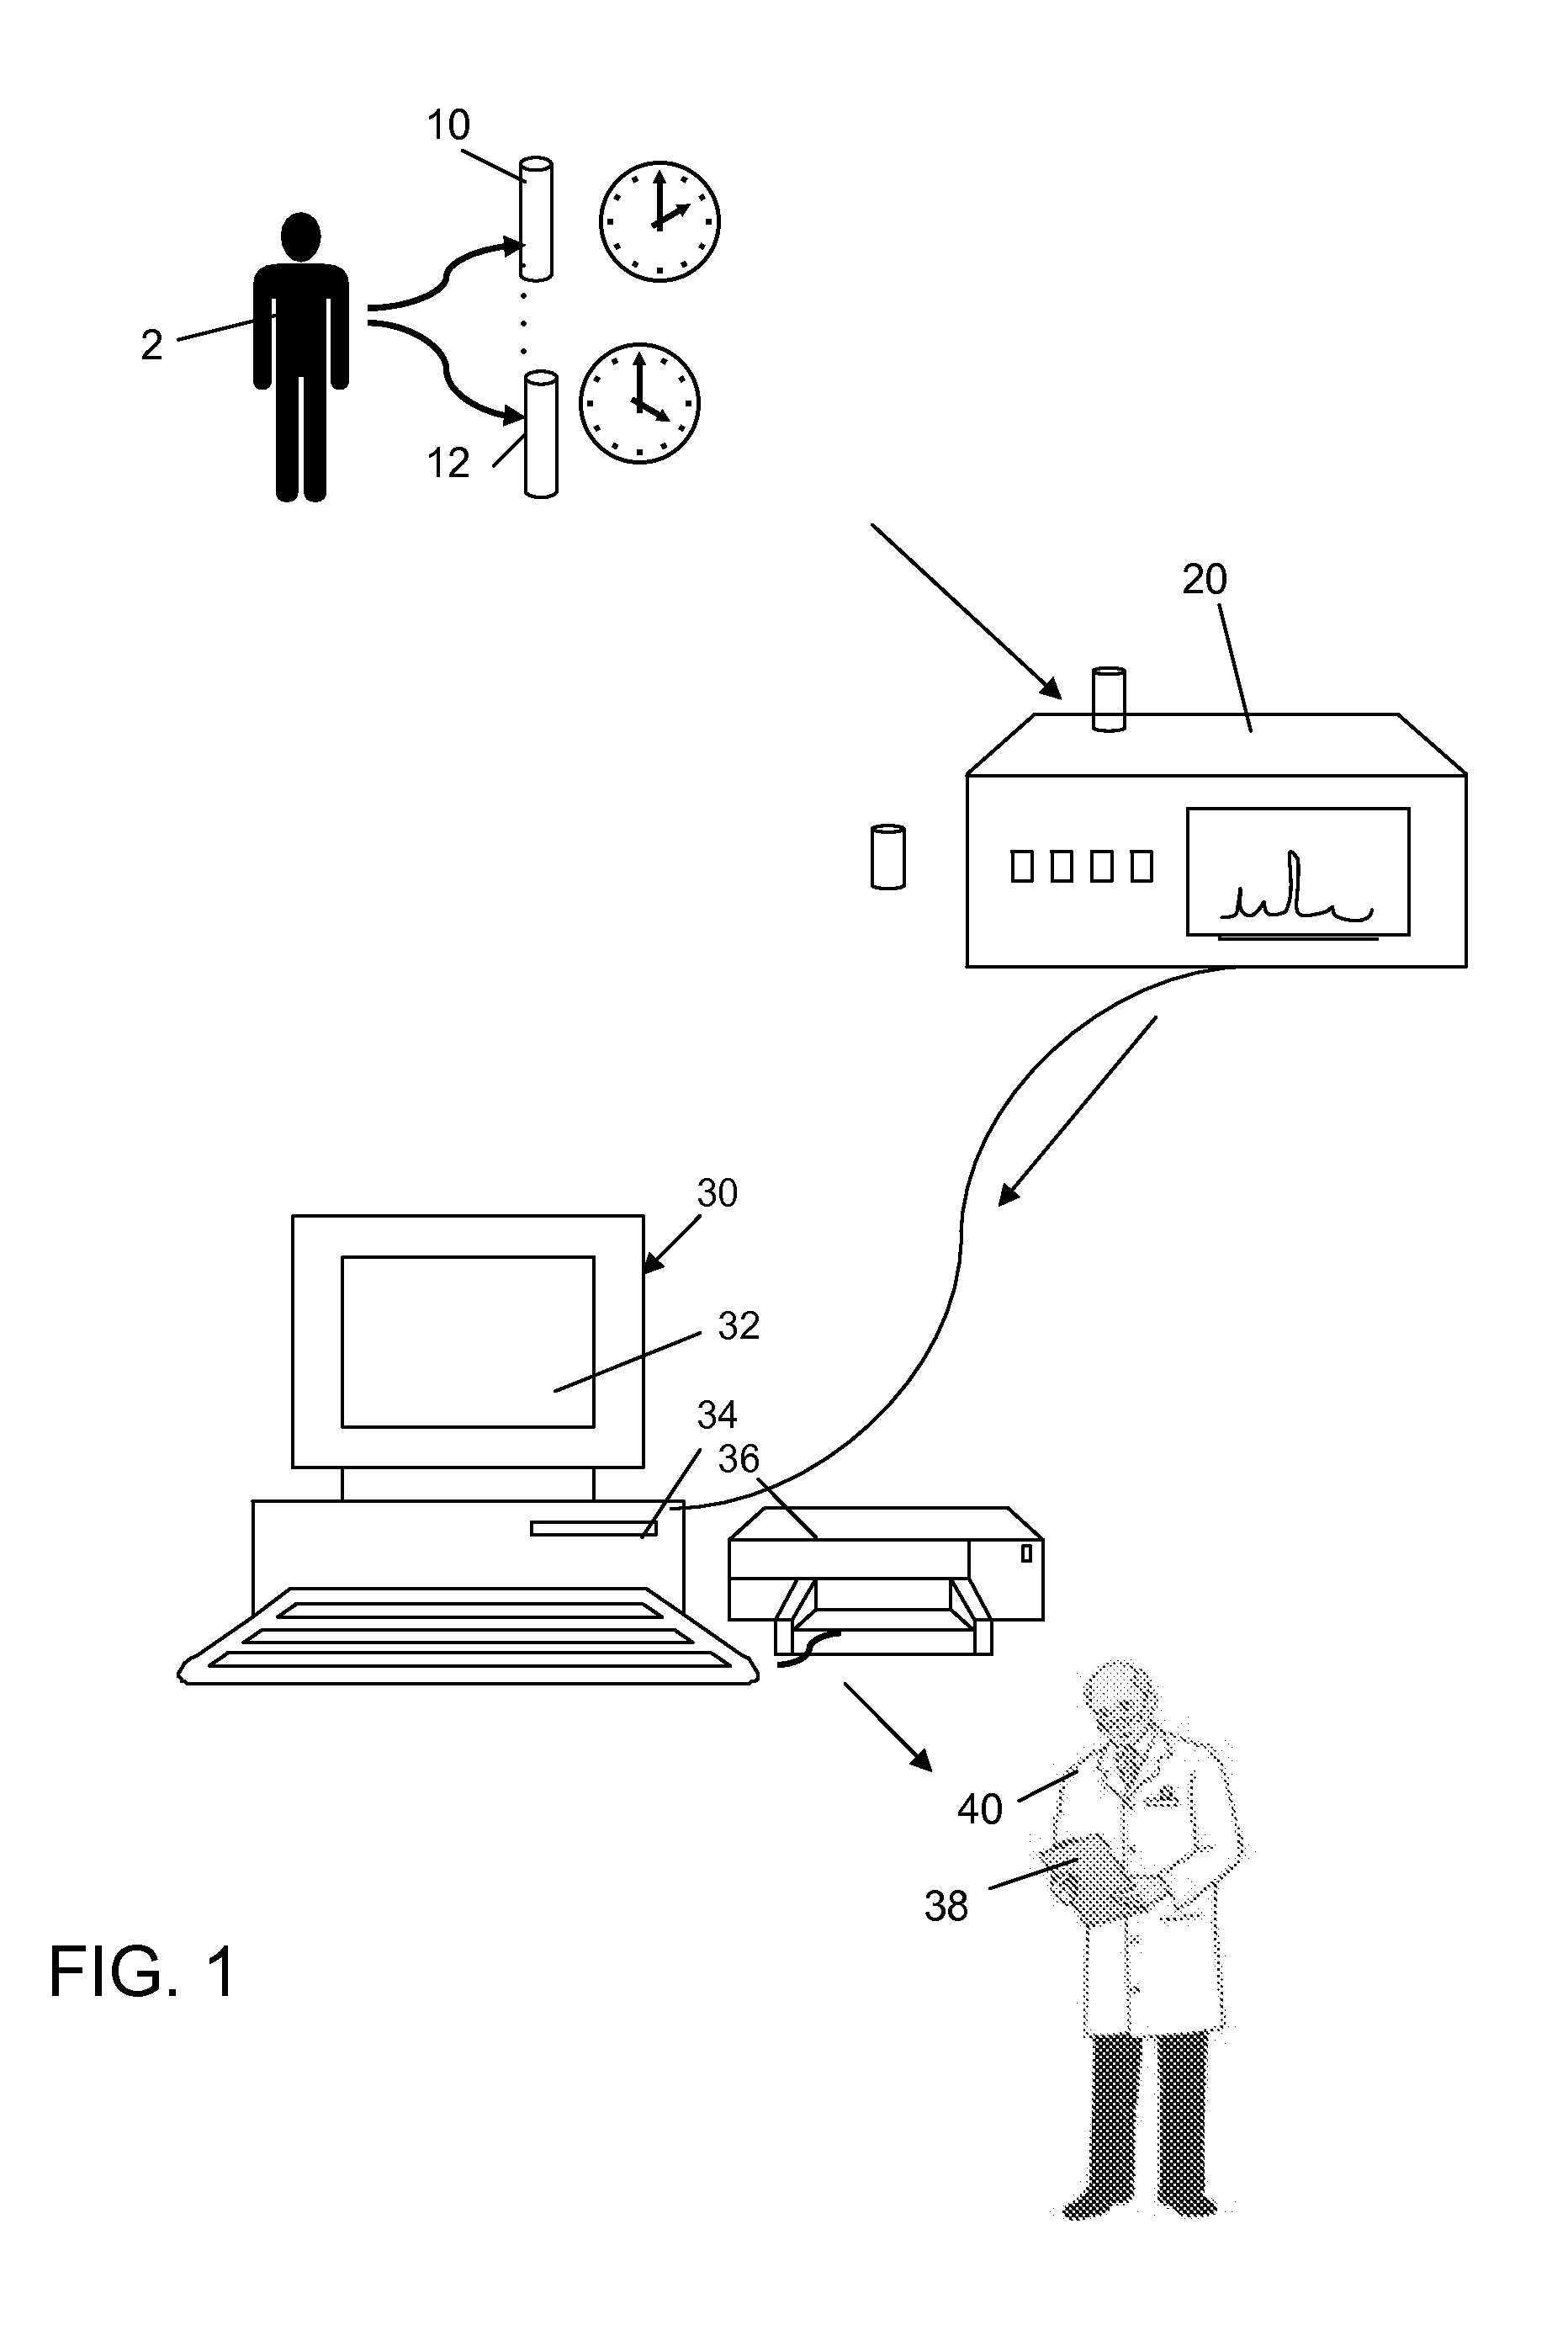
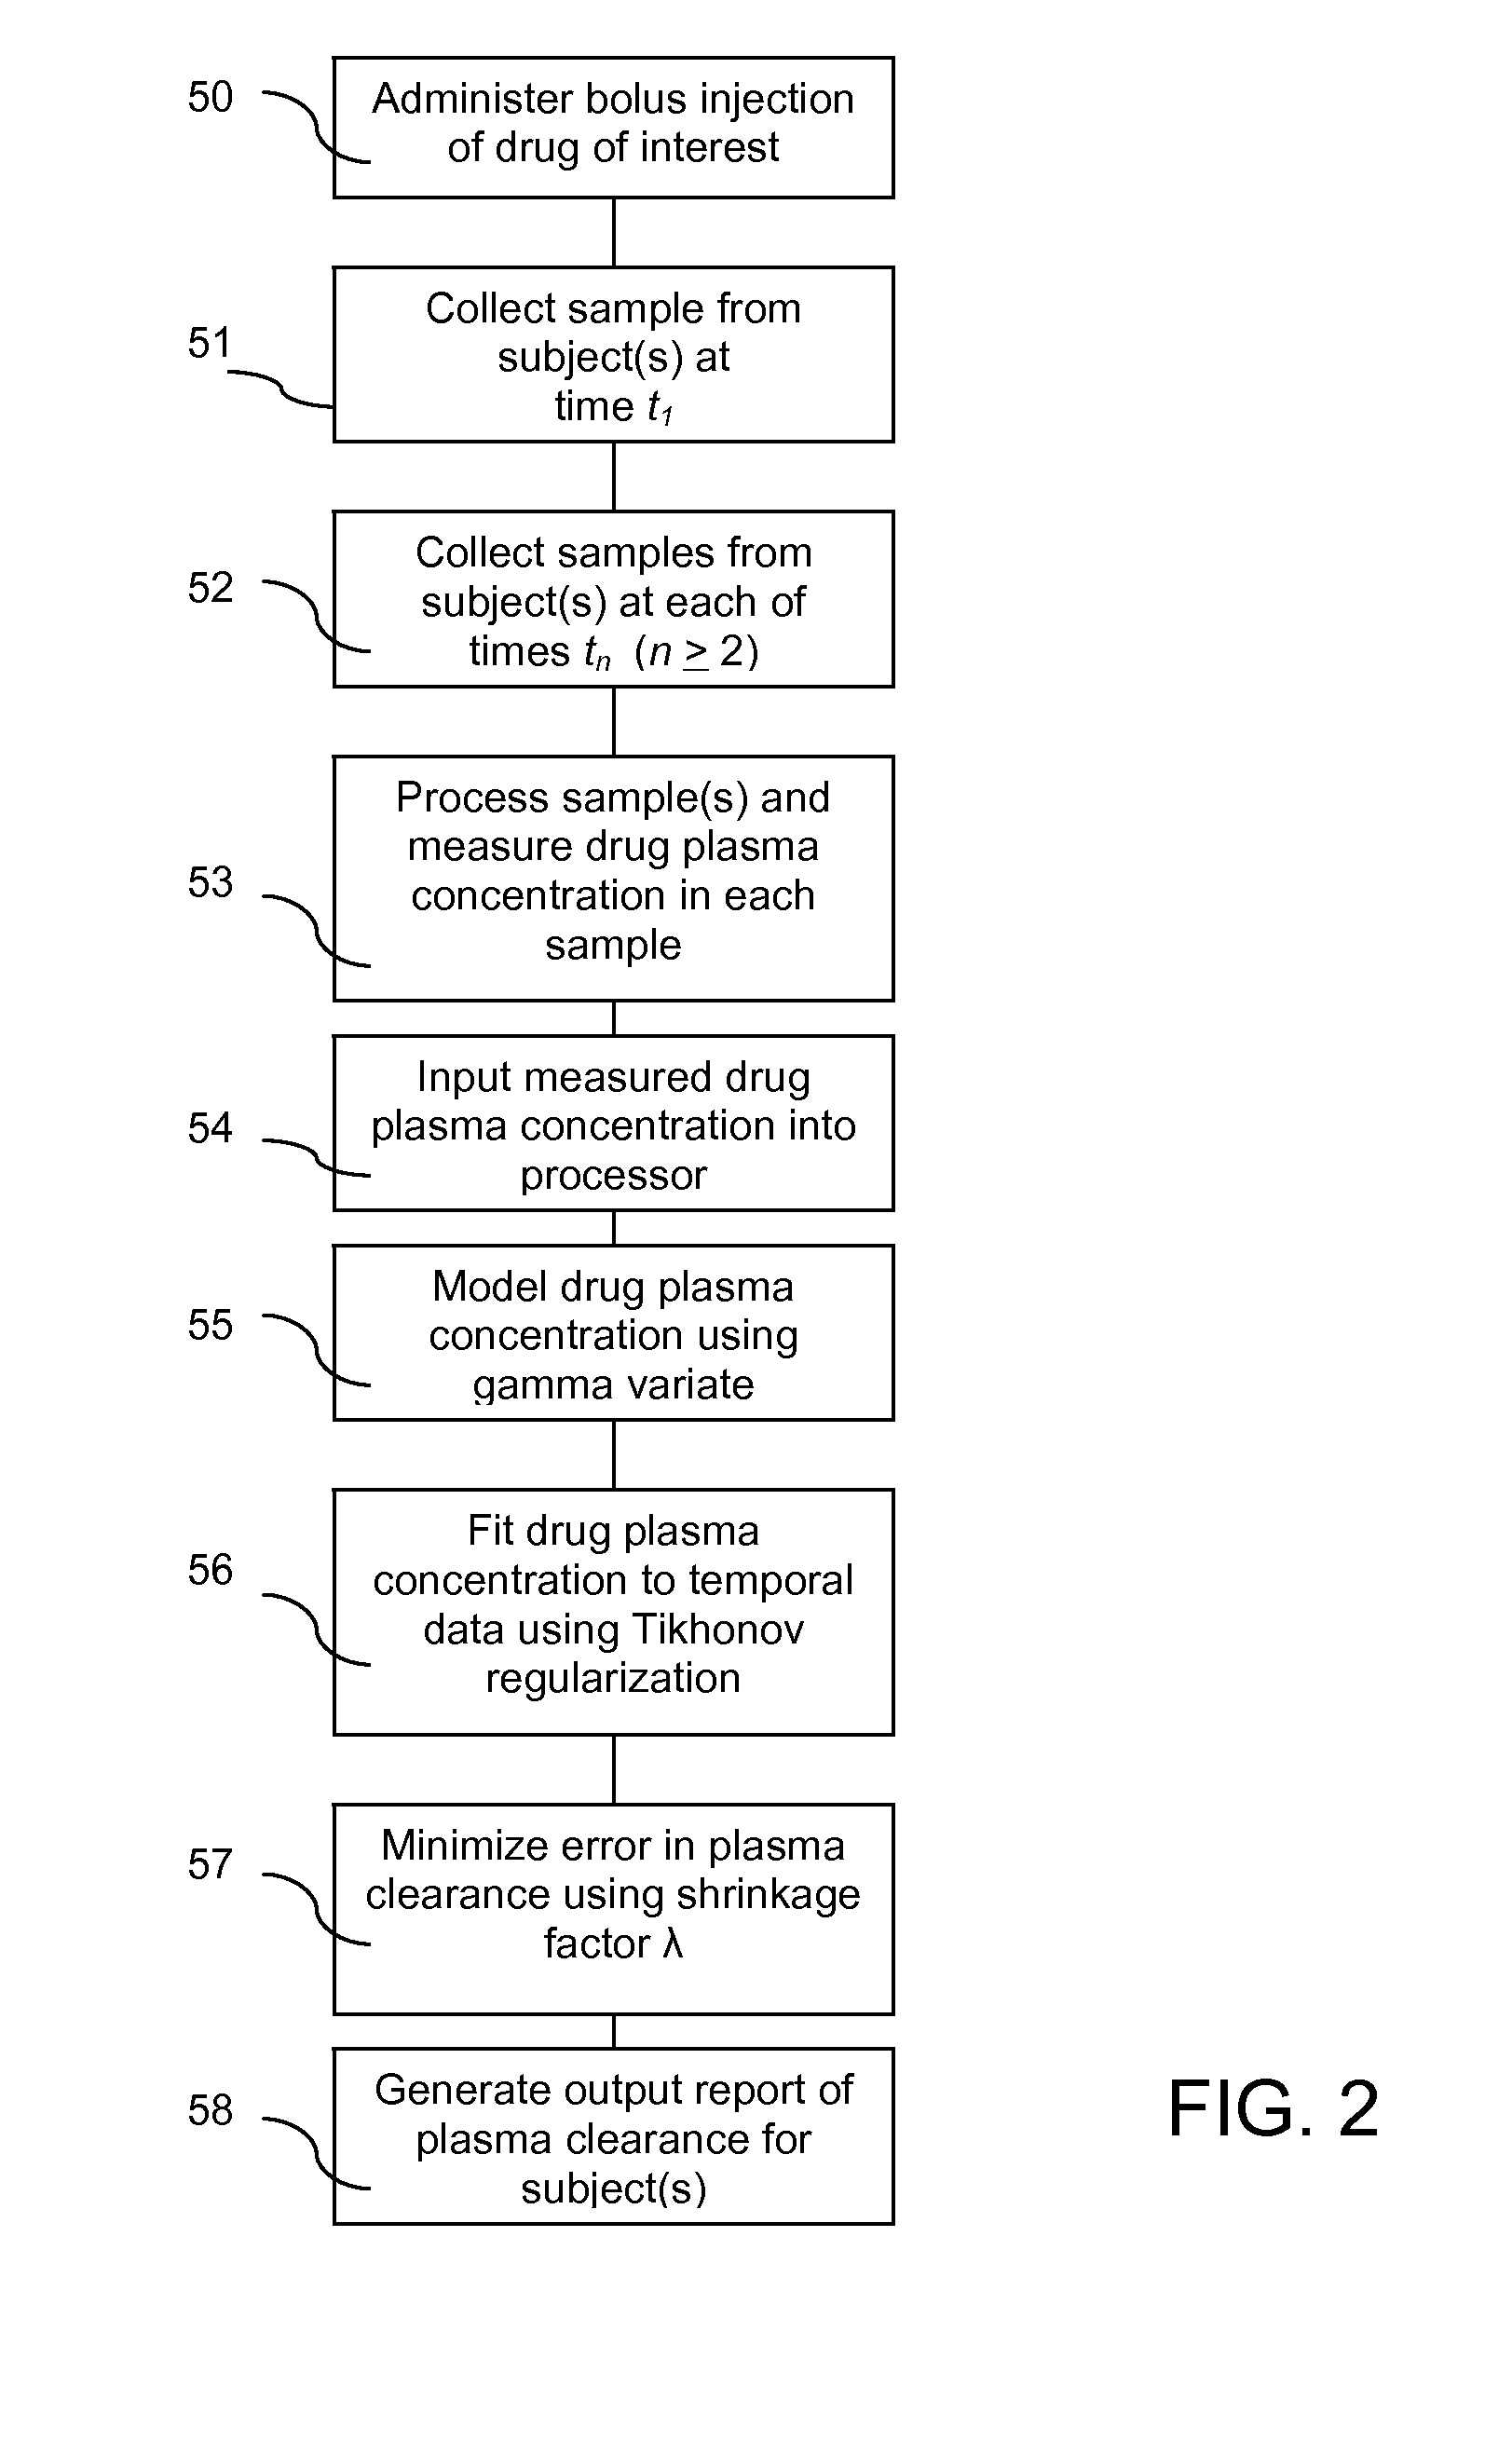
[0012]According to the present invention, drug plasma concentration is measured in three or more, preferably four or more, blood samples taken over a period of time following bolus injection. The measured values are input into a computer processor programmed to execute a computer program comprising an algorithm that uses (a) the gamma variate (GV) function to model drug plasma concentration (the current trend is to use SET models) in the first place; (b) uses Tikhonov regularization to perform the fit; and (c) selects the regularization constant, λ (also commonly called the “shrinkage” factor), so that the error in the plasma clearance, CL, is minimized, producing one or more output values corresponding to renal function, including calculated (estimated) plasma clearance and error terms.
[0015]The Tk-GV algorithm is robust in that it readily converges to a global minimum. The inventive method is easier to use than the constant infusion, 24 hour AUC with mono-exponential extrapolation and the E2 SET models. The results for CL are precise (2.7 to 3.7 ml / min SD), and agree with published corrections of CL from constant infusion of inulin and 51Cr-EDTA (ethylenediamine tetra-acetic acid), to within insignificant, 1 ml / min-1.73 m2 or 0.6% errors, respectively. Thus, the Tk-GV model results reflect accurate renal function estimates without the need for correction factors, constant infusion, or increasing the time of data collection from 4 to 24 hours. Tk-GV provides CL and volume of distribution (V) information from as few as four samples over four hours, even when renal function is extremely low.

Problems solved by technology

However, inulin constant infusion may not be useful in patients with severely reduced renal function.
Unfortunately, the repeated sampling over extended periods of time makes the numerical integration of AUC impractical, particularly in a clinical setting, and even 24 hour collections may not be long enough to evaluate renal failure
If a drug is “completely” reabsorbed after filtration and no active secretion takes place, the renal clearance will be limited to the amount of drug that leaves the kidney as the urine flows into the bladder.
Because of these additional mechanisms, glomerular filtration rate alone using one of the gold standards may not always accurately model CL for some drugs or metabolites.
The use of higher-order SET models leads to a host of problems.
This is because when En≧2 SET models are used to model the concentration data they are often not robust enough to converge to statistically acceptable fits.
Another problem is accuracy—it is well known that E1 and E2 SET models typically overestimate renal clearance.
SET models fail to adequately fit the temporal dependence of marker concentration for radiochelated DTPA.
In addition, SET models do not extrapolate properly, and they have small values for the areas under the temporal concentration curve (AUC), which is inappropriate for non-metabolized substances in the case of low (AUC large) to no renal function (AUC→∞).
However, this observation also suggests that mono-exponential extrapolation consistently underestimates the extrapolated concentration.
Another drawback of this method is the relatively long time period over which samples must be collected, causing the AUC method to border on the impractical.
However, direct fitting of a gamma variate function to the temporal concentration data is often ill-conditioned for CL, independent of which samples times are chosen for fitting.

Method used


Image

  • Method for evaluating renal function
  • Method for evaluating renal function
  • Method for evaluating renal function

Examples


example 1

Characterization of Parameters from Tk-GV Fits

[0055]Tk fit parameter calculations include tolerances as part of the Tk regression process. However, since Tk-GV attempts to minimize sCL / CL, i.e., a tolerance, it is prudent to crosscheck the intrinsic Tk-GV tolerance results. Note that bootstrap regression, which randomizes residuals in time, is not compatible with time-based adaptive fitting. Instead, the Tk-GV parameter tolerances were crosschecked with LOO (Leave One Out, jackknife) analysis of variance for CL and V (373 trials total or 8 trails for each of 41, 8-sample patients and 9 trials for each of 5, 9-sample patients). The resulting jackknife variances are corrected for leaving data out under highly correlated resampling conditions. It is also possible to use L2O (leave two out), L3O (leave three out), and so forth. In general, leaving d items out (LdO) produces a dth variance estimator. To calculate the standard deviation (SD) of a parameter of interest, one merely needs to...

example 2

Effects of Sample-Subset Selection on Tk-GV Model Parameters

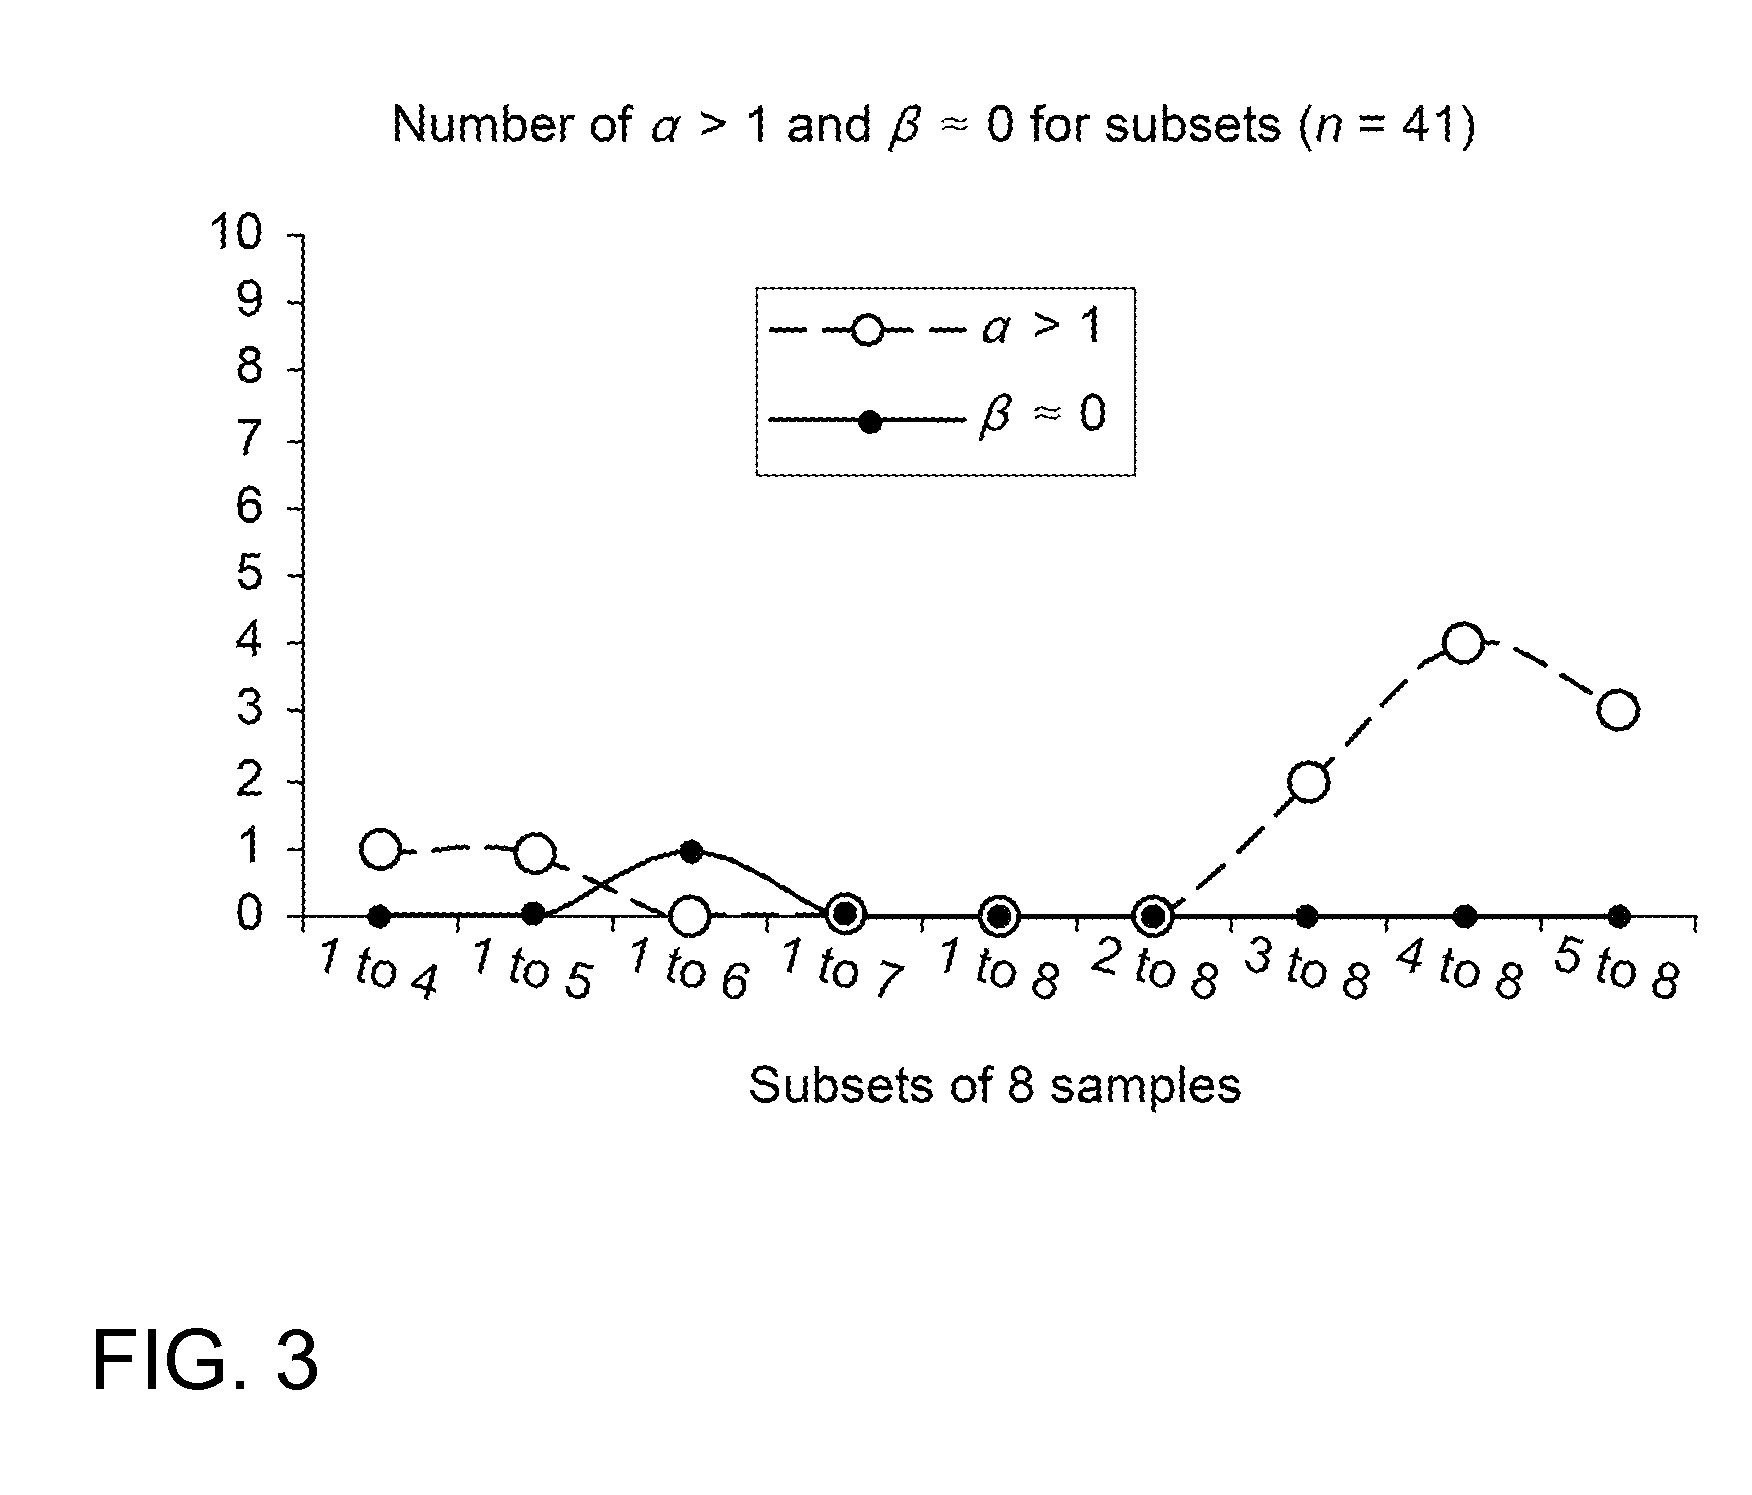
[0063]In this example, the Tk-GV models are fit to subsets of each patient's data. There are many ways to select subsets of samples for studies containing 8 or 9 samples. Restricting the sample subsets of the 8-sample dataset that have temporally consecutive samples that drop as many as 4 early or late samples has an advantage. While this selection is not exhaustive, it allows for plotting of the effect of the widest available spread of mean sample times on the values of the fit parameters α and β. These parameters, α and β are the only independent parameters, as per Equation 6, of the Tk-GV model. The behavior of this model with respect to the extremes of mean sample times can be plotted as the frequency of out of bounds values of α and β for increasing mean sample time. The obvious targets for analysis are the desired measures for performing the testing: CL and V. But, also of interest is the number of cases for which Tk-...

example 3

Characterization of Tk-GV Residuals

[0070]The test performed in this example considers the structure or temporal trend of the residuals (the differences between the data and the Tk-GV fits) for various Tk smoothings, λ, and renal rate constants, β. In general, one would only expect the mean residuals from ordinary least squares (OLS) regression to be zero for a perfect match between a model and the data. However, to find a more precise estimate of CL, Tk-GV fitting introduces bias to the otherwise unbiased OLS solution. In other words, for the Tk-GV method, biased residuals from fitting early times are desired given that the terminal GV behaviour sought is inappropriate to earlier times. Thus, inspection of these residuals is revealing, and the residuals are examined in some detail in this example.

[0071]Results: FIG. 4 shows the mean residuals from Tk-GV regressions of the 41 eight sample cases. These residuals are plotted for LOO fits in 8 equal octiles of increasing shrinkage value...


PUM

PropertyMeasurementUnit
timeaaaaaaaaaa
concentrationaaaaaaaaaa
plasma clearanceaaaaaaaaaa

Abstract

Plasma concentration of a compound of interest is measured in two or ideally 4 or more blood samples taken from a patient over a period of time following bolus injection. The measured values are input into a computer processor programmed to execute a computer program comprising an algorithm that uses the gamma variate (GV) function to model drug plasma concentration, then uses Tikhonov regularization to perform the fit, selecting a regularization constant so that the relative error in the plasma clearance is minimized. One or more output values representative of renal function are generated.

Description

FIELD OF THE INVENTION[0001]The present invention relates to a method for measuring the rate of renal elimination of drugs or other compounds from the blood.BACKGROUND OF THE INVENTION[0002]Renal elimination is the single most important route of elimination of many metabolites and drugs in the body. For patients with decreased renal function, doses need to be decreased to avoid exposure to excessive drug concentrations that may cause toxicity. Renal plasma clearance (CL) measurements are indicated for evaluating renal function, controlling dosing and avoiding toxicity, and for transplant donor and recipient evaluation, amongst other indications.[0003]There are several mechanisms of renal elimination, the first being glomerular filtration. This is a passive mechanism of elimination, whereby ionic substances are renally filtered and excreted. A gold standard test for measuring glomerular filtration rate or plasma clearance is the inulin constant infusion assay. This test, and other co...

Claims


Application Information

Patent Timeline
Patent Type & Authority Patents(United States)
IPC IPC(8): G06T1/00G06G7/48G01N1/00
CPCG01N33/5088G01N1/00G06T1/00
Inventor WESOLOWSKI, CARL A.BABYN, PAULPUETTER, RICHARD
Owner WESOLOWSKI CARL A
Learn More