Rapid method of pattern recognition, machine learning, and automated genotype classification through correlation analysis of dynamic signals
a dynamic signal and correlation analysis technology, applied in the field of nucleic acid analysis and the identification of genotypes, can solve the problem that the level of temperature resolution is difficult to achieve in visual inspection, and achieve the effect of minimizing the separation between dynamic profiles and maximizing separation
- Summary
- Abstract
- Description
- Claims
- Application Information
AI Technical Summary
Benefits of technology
Problems solved by technology
Method used
Image
Examples
example 1
[0172]Generation of Training Sets for Warfarin VKORC1 Polymorphism
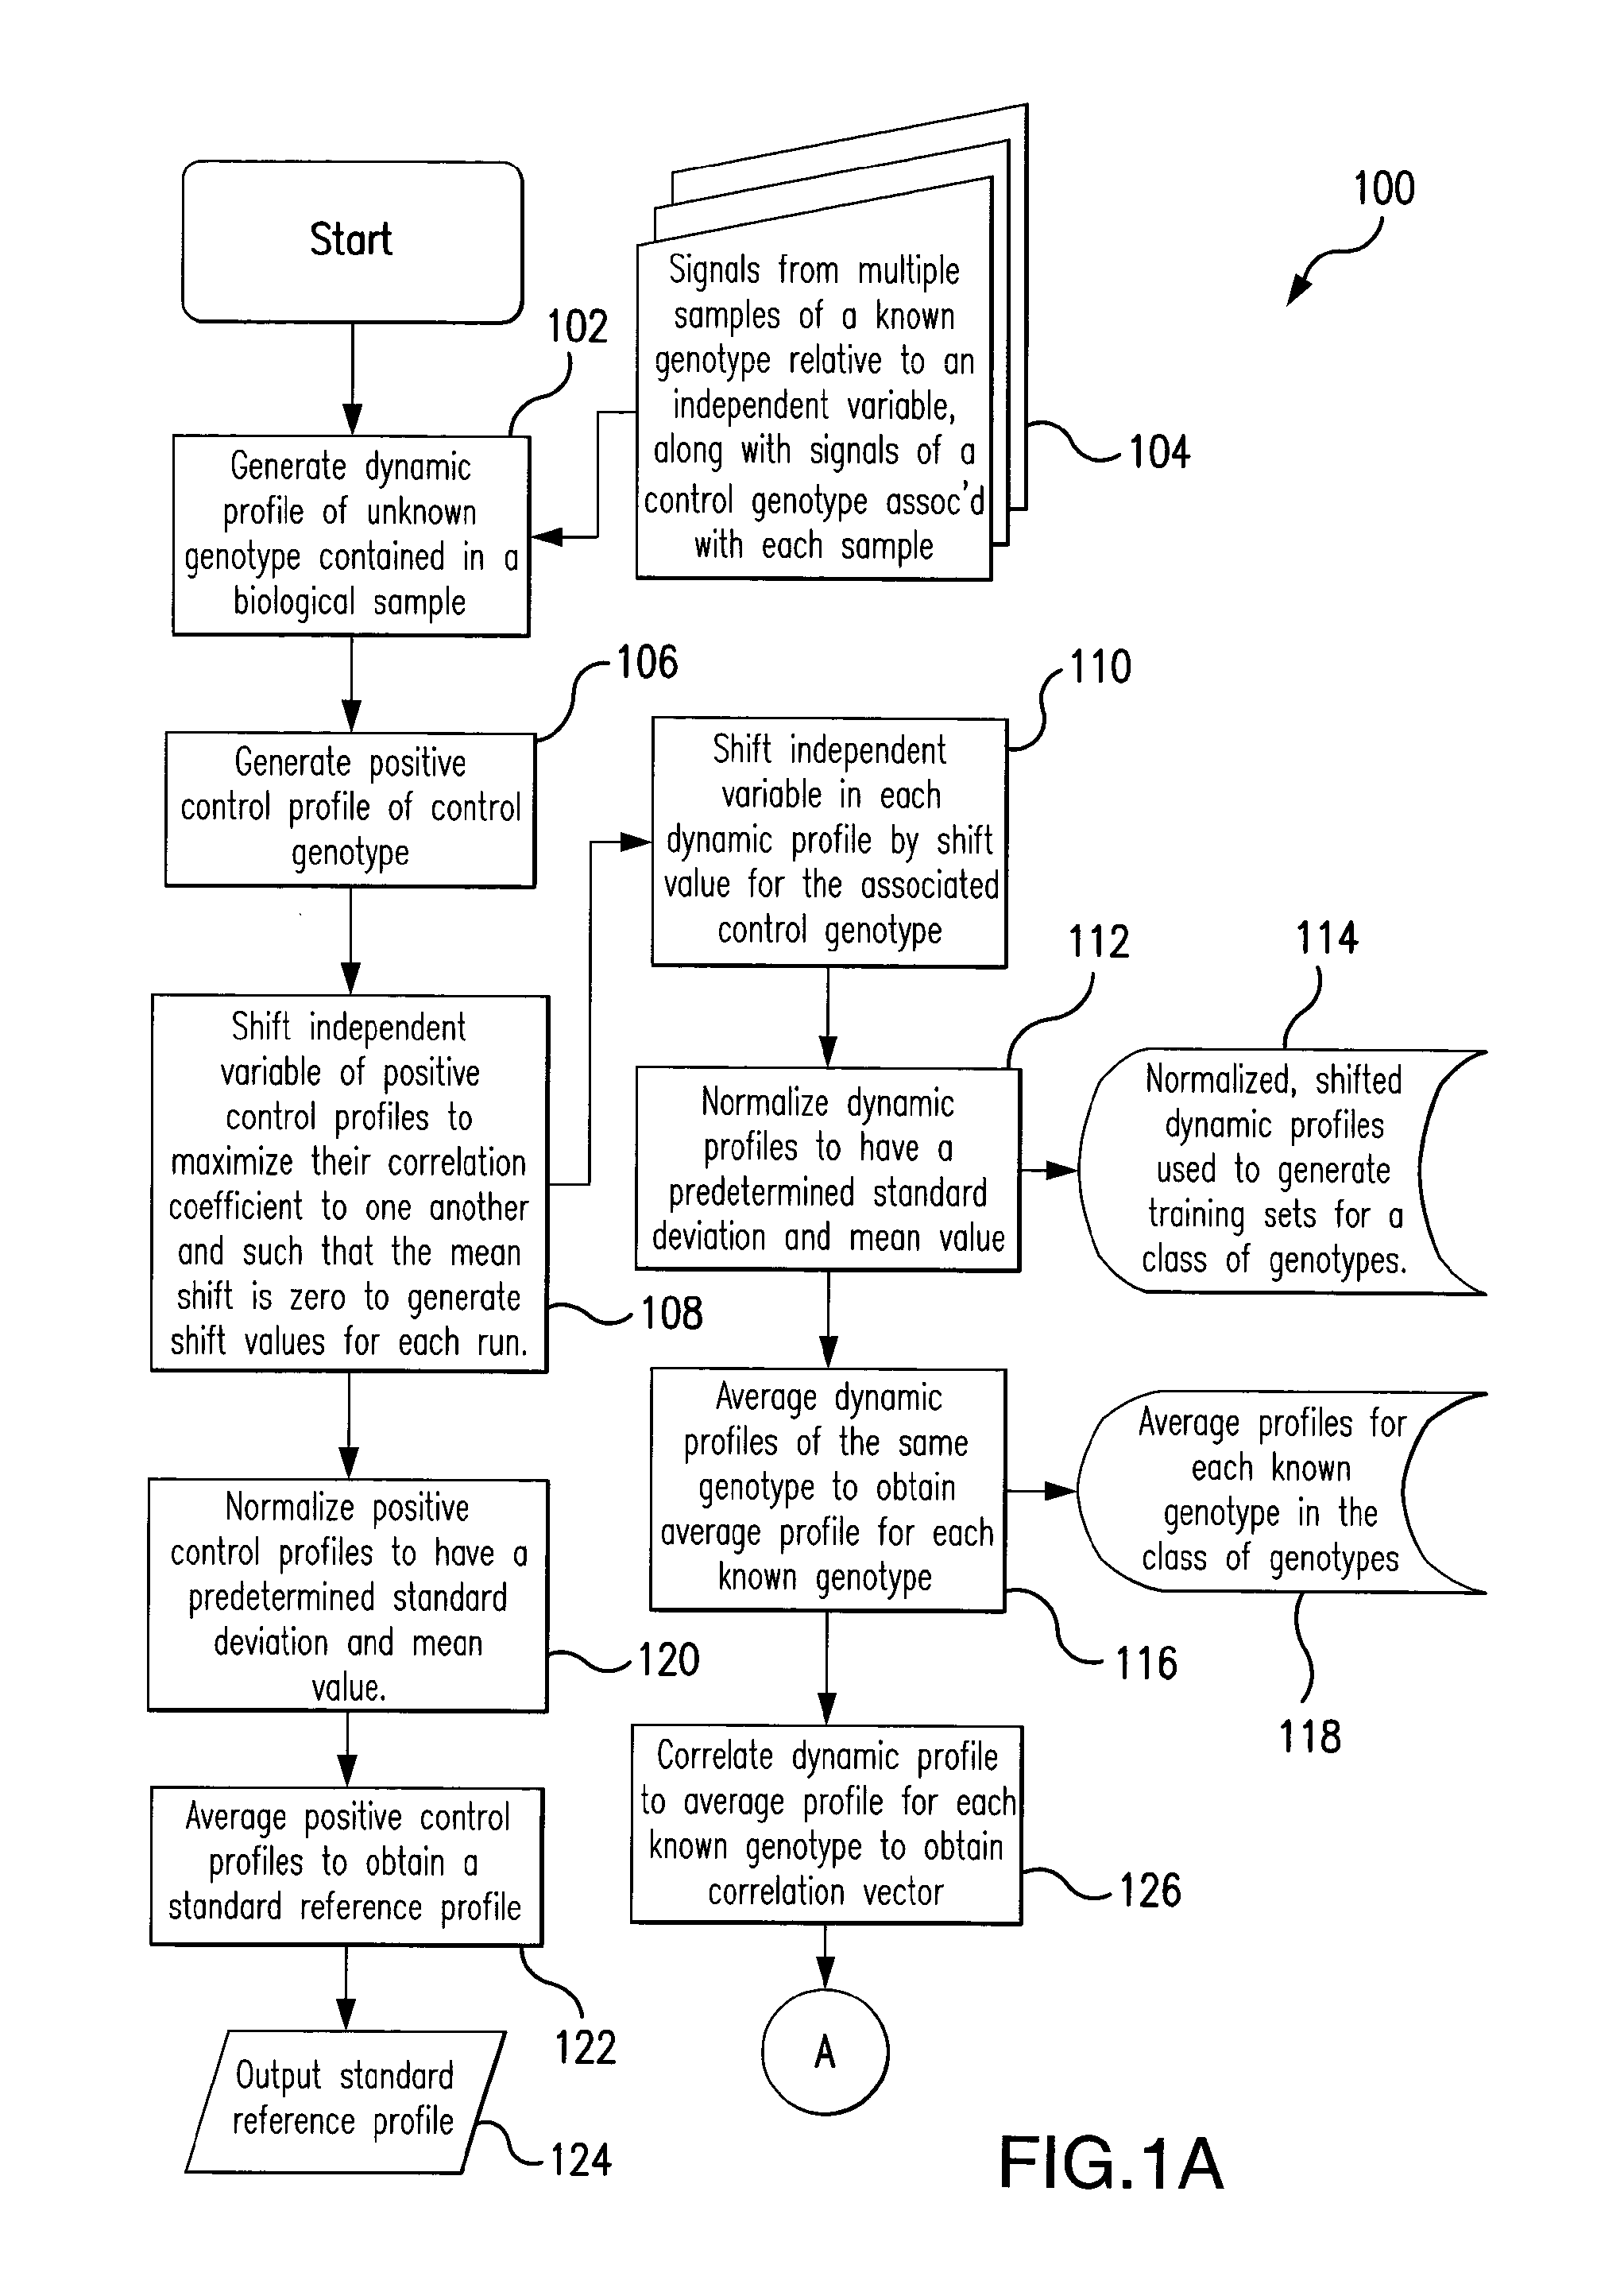
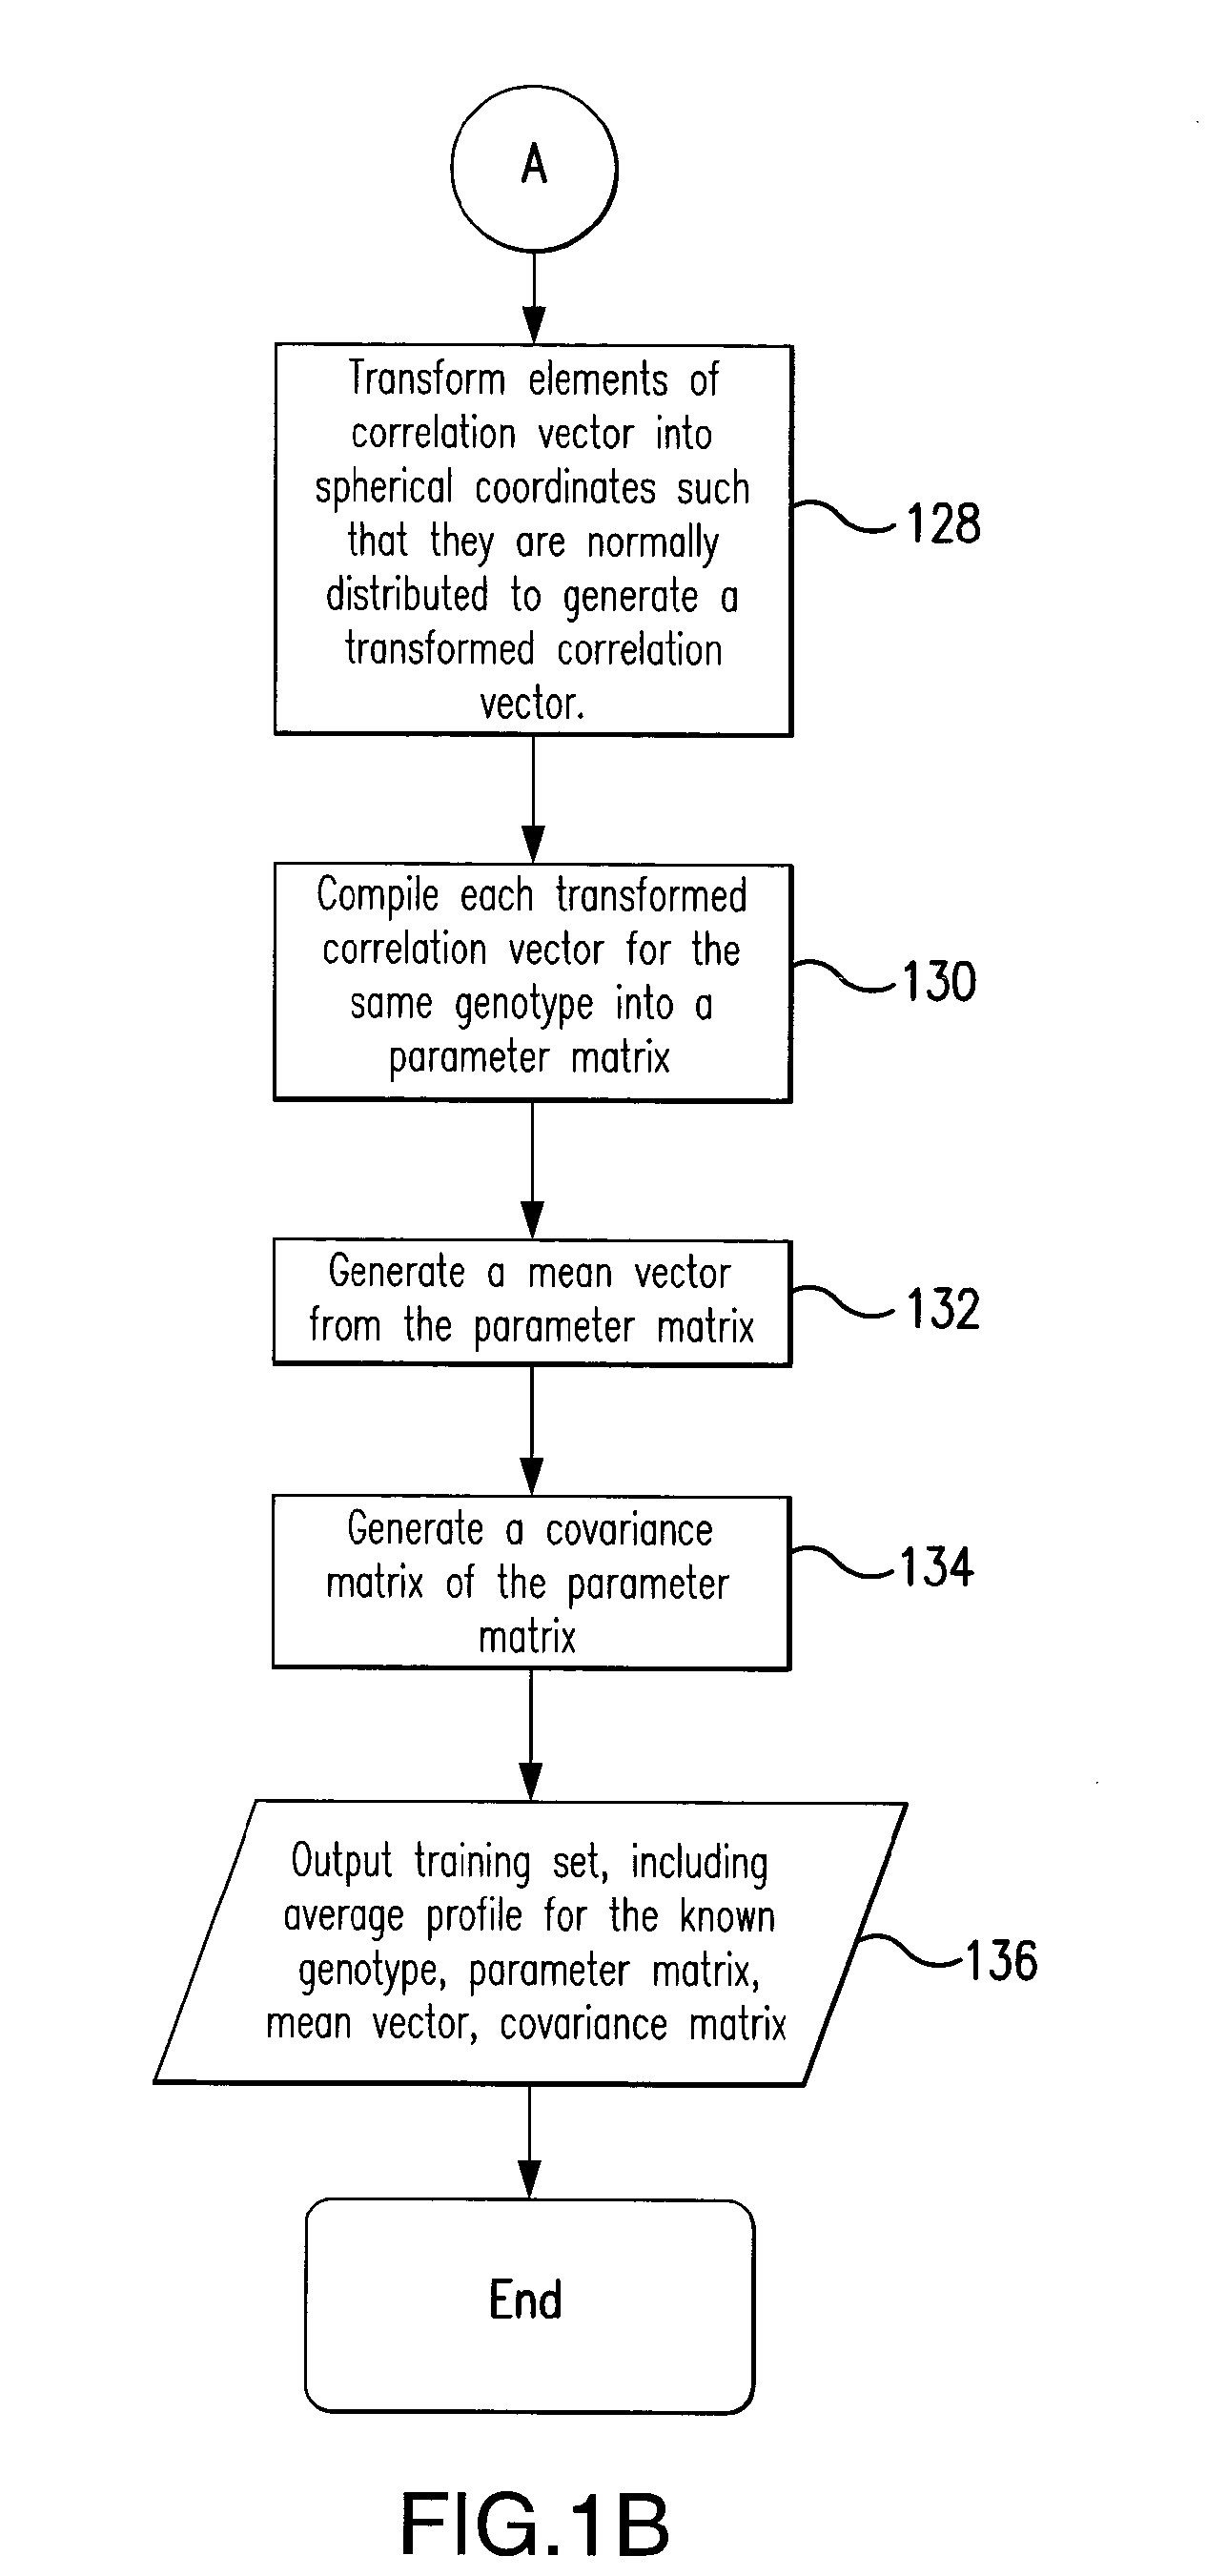
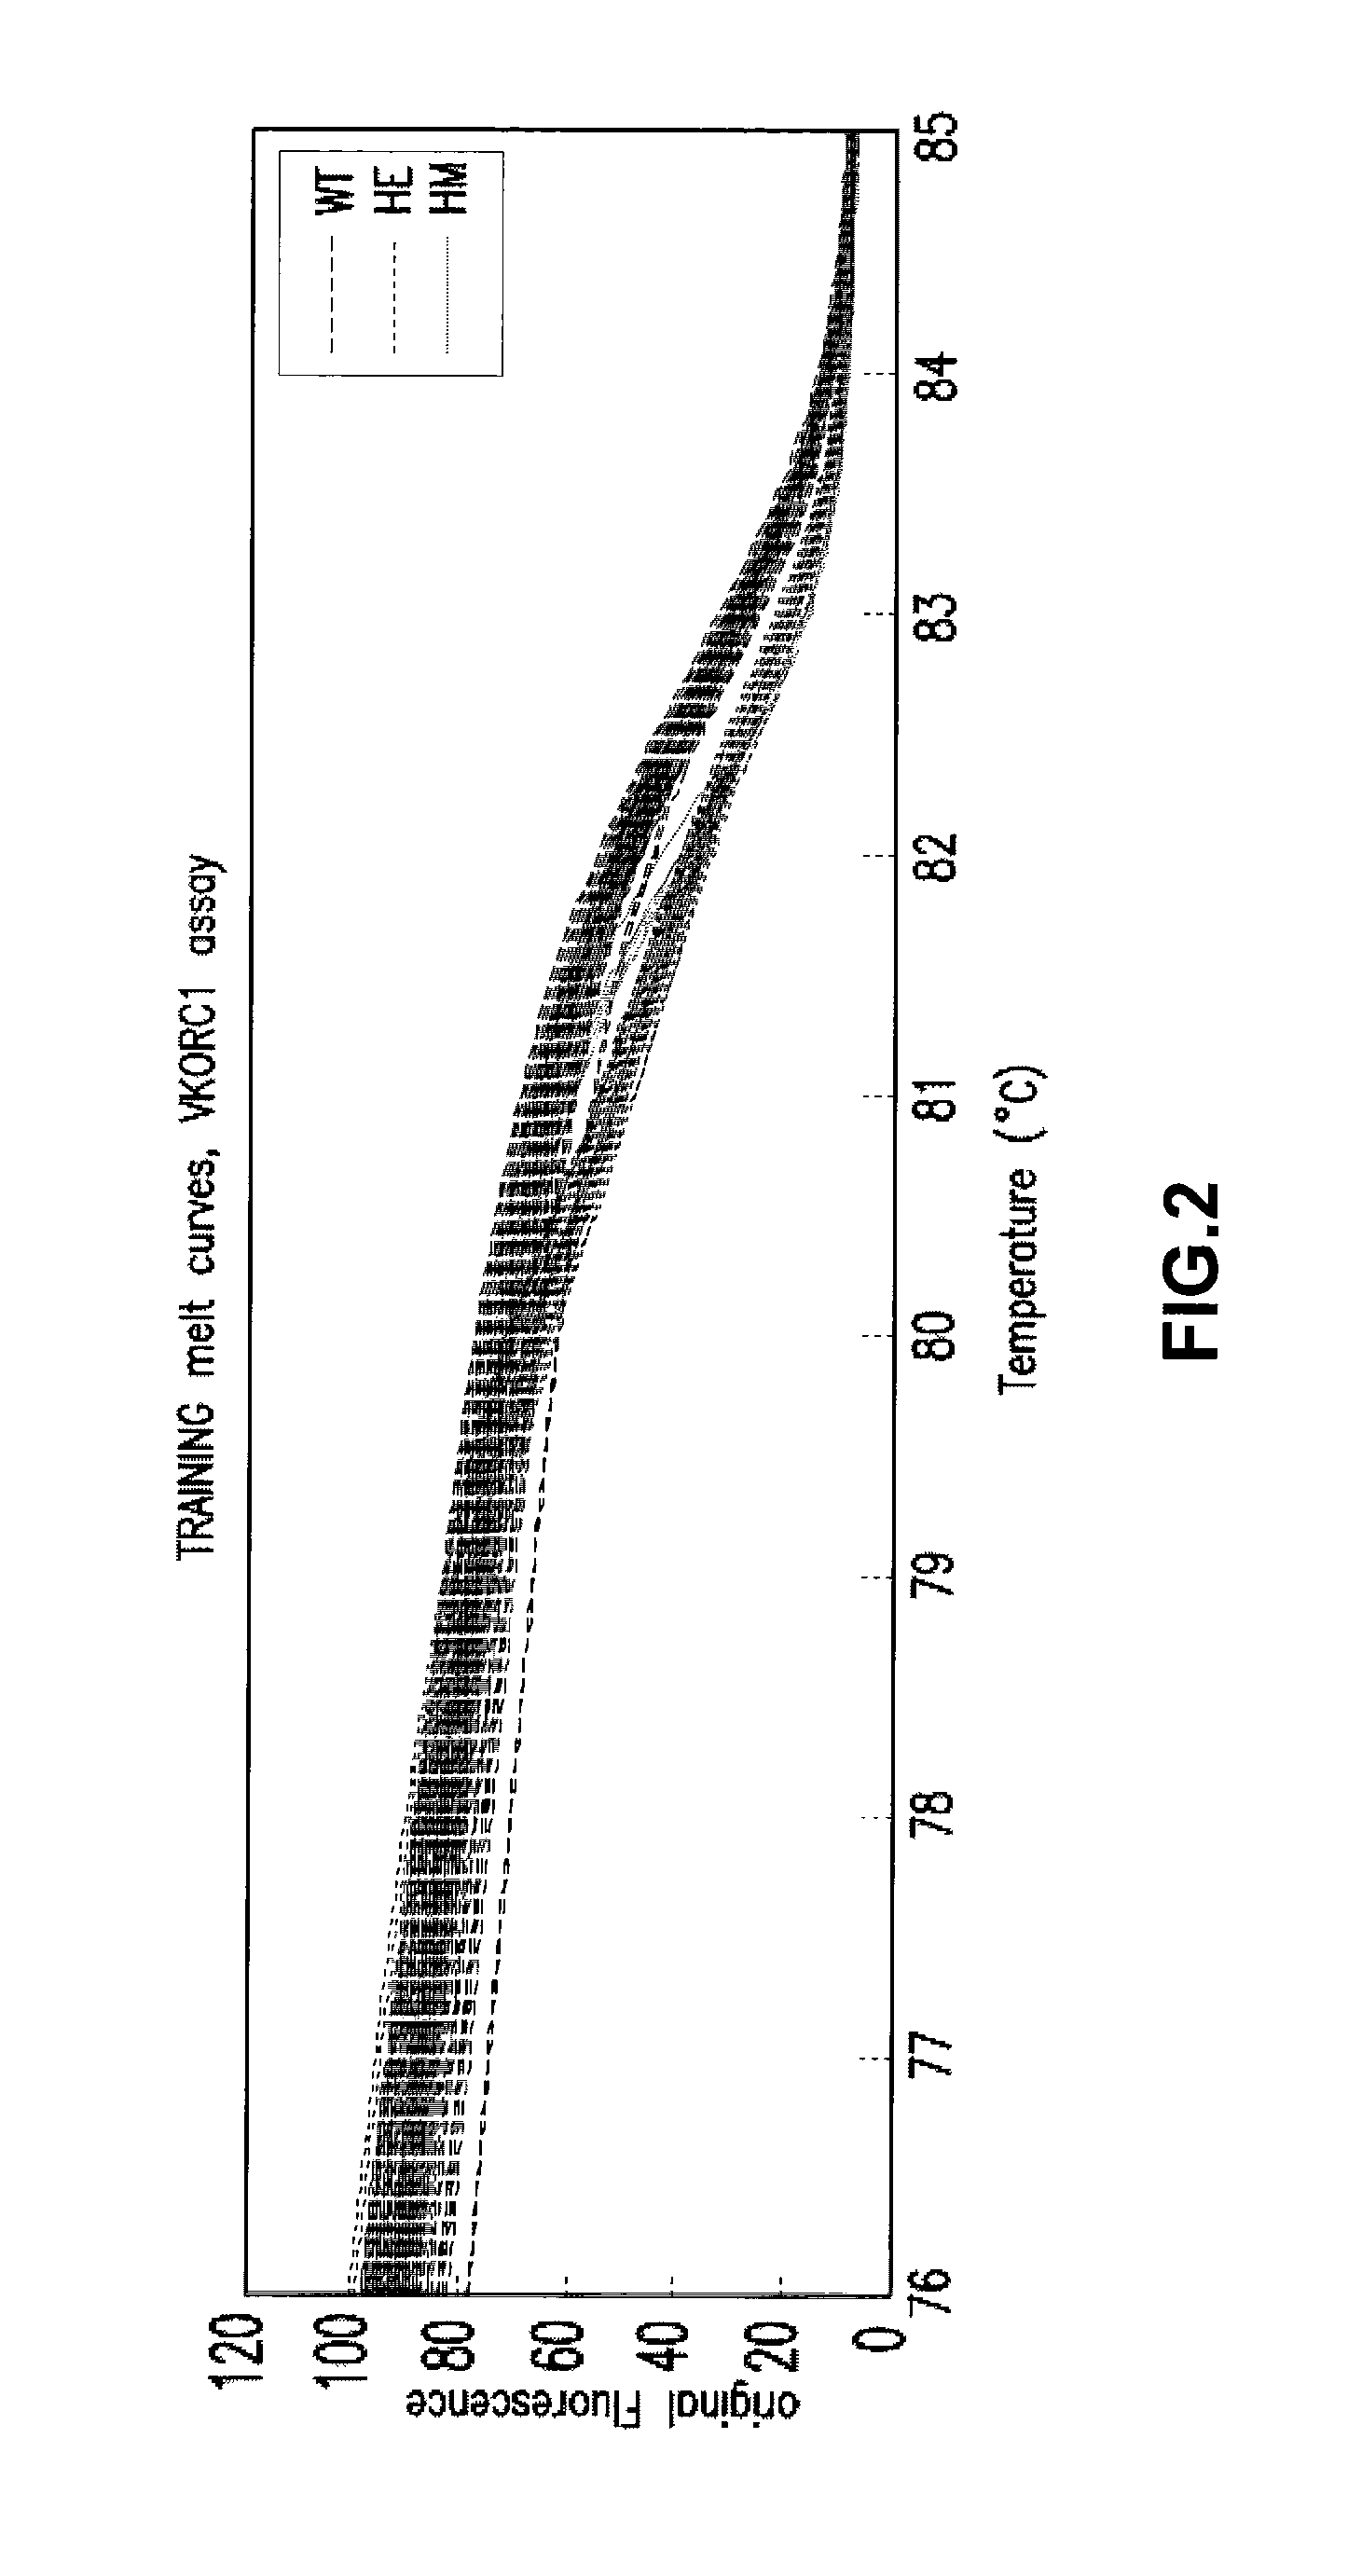
[0173]Several thermal melt curves which include measurements of fluorescence at equally spaced temperature intervals for each of the Warfarin VKORC1 polymorphism genotypes were obtained by high resolution thermal melting from 50 to 95° C. at 0.5° C. per second using LC Green fluorescent dye following a 40 PCR cycle run on the Roche LC280 light cycler. These curves are shown in FIG. 2. −dF / dT was calculated for each of the generated curves by applying a Savitsky-Golay derivative filter, resulting in the curves shown in FIG. 3. A positive control thermal melt curve was obtained through high-resolution thermal melt analysis of a known sample containing the wild-type genotype of the Warfarin VKORC1 polymorphism, along with each thermal melt curve of each of the Warfarin VKORC1 polymorphism genotypes. Measurements of fluorescence for the positive control were averaged over several runs in order to generate a reference stan...
example 2
[0190]Generation of Training Sets for Coagulation Factor MTHFR677 Polymorphism.
[0191]Several thermal melt curves which include measurements of fluorescence at equally spaced temperature intervals for each of the Coagulation Factor MTHFR677 polymorphism genotypes were obtained by high resolution thermal melting from 50 to 95° C. at 0.5° C. per second using LC Green fluorescent dye following a 40 PCR cycle run on the Roche LC480 light cycler. These curves are shown in FIG. 19. −dF / dT was calculated for each of the generated curves by applying a Savitsky-Golay Filter resulting in the curves shown in FIG. 20. The curves are temperature shifted and normalized in the same manner as was done for the thermal melt curves for the Warfarin VKORC1 polymorphism; these shifted and normalized curves are shown in FIG. 21. The Coagulation Factor MTHFR677 polymorphism has three possible genotypes: wild-type (WT), heterozygote (HE), and homozygous (HM). Average thermal melt curves for these genotypes ...
PUM
| Property | Measurement | Unit |
|---|---|---|
| Tm | aaaaa | aaaaa |
| time | aaaaa | aaaaa |
| time | aaaaa | aaaaa |
Abstract
Description
Claims
Application Information
 - R&D
- Intellectual Property
- Life Sciences
- Materials
- Tech Scout
- Unparalleled Data Quality
- Higher Quality Content
- 60% Fewer Hallucinations
Browse by: Latest US Patents, China's latest patents, Technical Efficacy Thesaurus, Application Domain, Technology Topic, Popular Technical Reports.
© 2025 PatSnap. All rights reserved.Legal|Privacy policy|Modern Slavery Act Transparency Statement|Sitemap|About US| Contact US: help@patsnap.com


