
Network performance monitor

a network performance monitor and monitor technology, applied in the field of mission critical data delivery on shared networks, can solve the problems of inability to improve the 25 minutes per day of dropout, and inability to use the spread spectrum system that uses this band. to achieve the effect of maintaining the security and privacy of the network

Inactive Publication Date: 2012-06-05
WELCH ALLYN INC
View PDF14 Cites 83 Cited by
  • Summary
  • Abstract
  • Description
  • Claims
  • Application Information

AI Technical Summary

Problems solved by technology

The initial digital systems stumbled as they exhibited 75 minutes per day of lost data.
This allocation precludes a television station using the dedicated band, but does not result in any improvement over the 25 minutes / day of dropout
As a result, spread spectrum systems that use this band render useless nearby second generation systems also in this band.
While this expensive “upgrade” removes the worry of an in-band HDTV station, it does nothing to improve the 25 minutes per day of dropout.
At that time, the promise was unrealized because standards and protocols for security and quality of service had not yet been developed.
This results in a bandwidth only limited by the size of the hospital and the speed of the information technology backbone.
Note that 802.11g can be used without much issue at the unit or department level, but with only three non-overlapping channels, it is not well suited for enterprise installations because of the difficulty in laying out a network without neighboring APs sharing, and therefore interfering on the same channel.
If one attempts to have redundant coverage, where multiple APs provide RF coverage of the same area, then 802.11b / g is not suitable.
Without this, patients are at increased risk for not being continuously monitored, and clinician's frustration with not being able to use the wireless services for their clinical needs will continue to increase.
Hospitals are a challenging radio frequency (RF) environment with shielded rooms, significant amounts of RF-reflective metal (food carts that interrupted conventional telemetry), and a high availability requirement for all applications.
Because of this, a routine wireless installation to simply provide RF coverage appropriate for an office environment is not acceptable.
While some people view any and all wireless LAN installations identically, it is not reasonable to ascribe this philosophy to a network that supports life critical applications.
A network that simply provides RF coverage most of the time in most areas of the hospital is not acceptable.
There are some proprietary solutions that exist, but these unfortunately represent a short term solution as the telecommunication industry continues to follow a strong trend to alight with standards-based solutions, e.g., 802.11e for Quality of Service.
While many wireless VoIP manufacturers have been using proprietary Quality of Service, schemes such as always setting the backoff interval to zero, these solutions do not coexist well with non-VoIP data.
Further, as hospitals add additional shared applications on the infrastructure, there is no automatic method for IT managers to determine that the Quality of Service level is sufficient for a given application, That is, they can see that the latency on a given node is a certain value, but must manually determine if the applications running on that node support operation with that latency value.
With shared 802.11 networks that support the enterprise, these solutions are no longer viable as the hospital information technology departments understandably want to control their own network and are not disposed to giving outside access to these networks.
Both network security and Health Insurance Portability and Accountability Act (HIPAA) compliance are issues.
There exist many network tools such as HP Open View, Aruba MMS, CiscoWorks LAN Management Solution for analyzing and diagnosing issues with the IT backbone; however, these are typically not available to the medical device manufacturer nor the clinicians whose patients' safety is at risk.
Also, for smaller hospitals, these solutions are cost prohibitive.

Method used


Image

  • Network performance monitor
  • Network performance monitor
  • Network performance monitor

Examples


Embodiment Construction

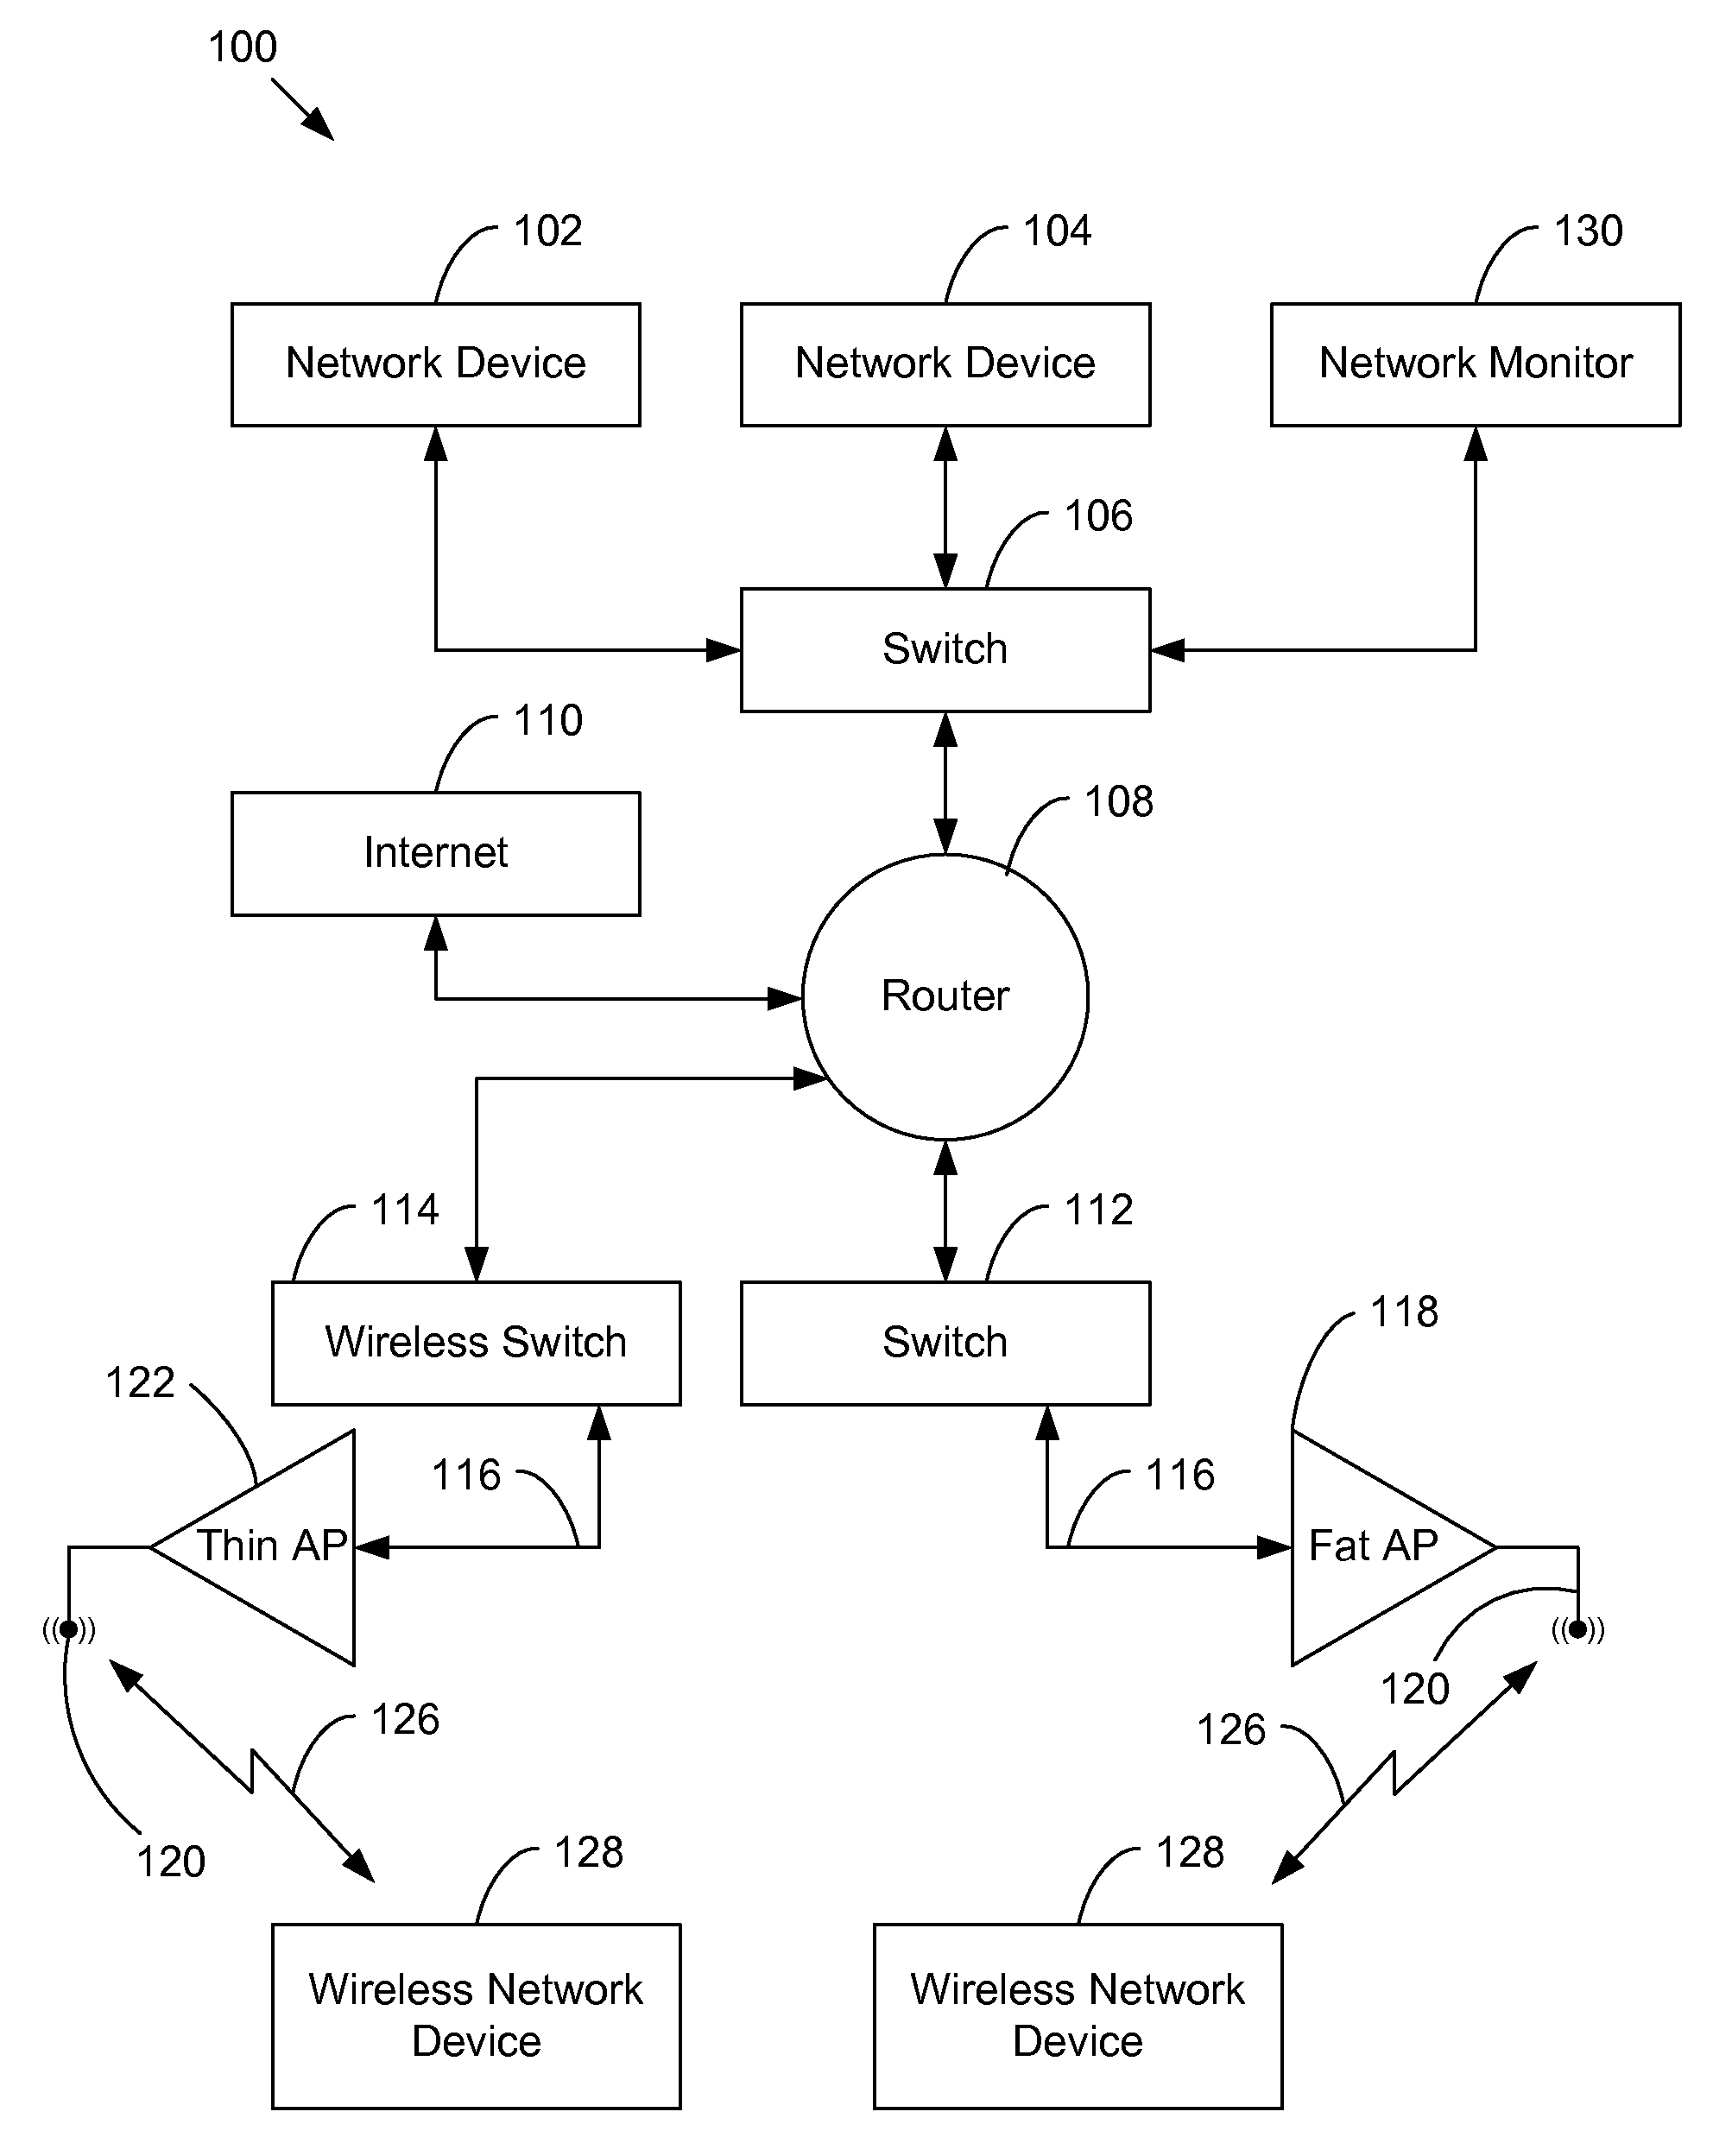
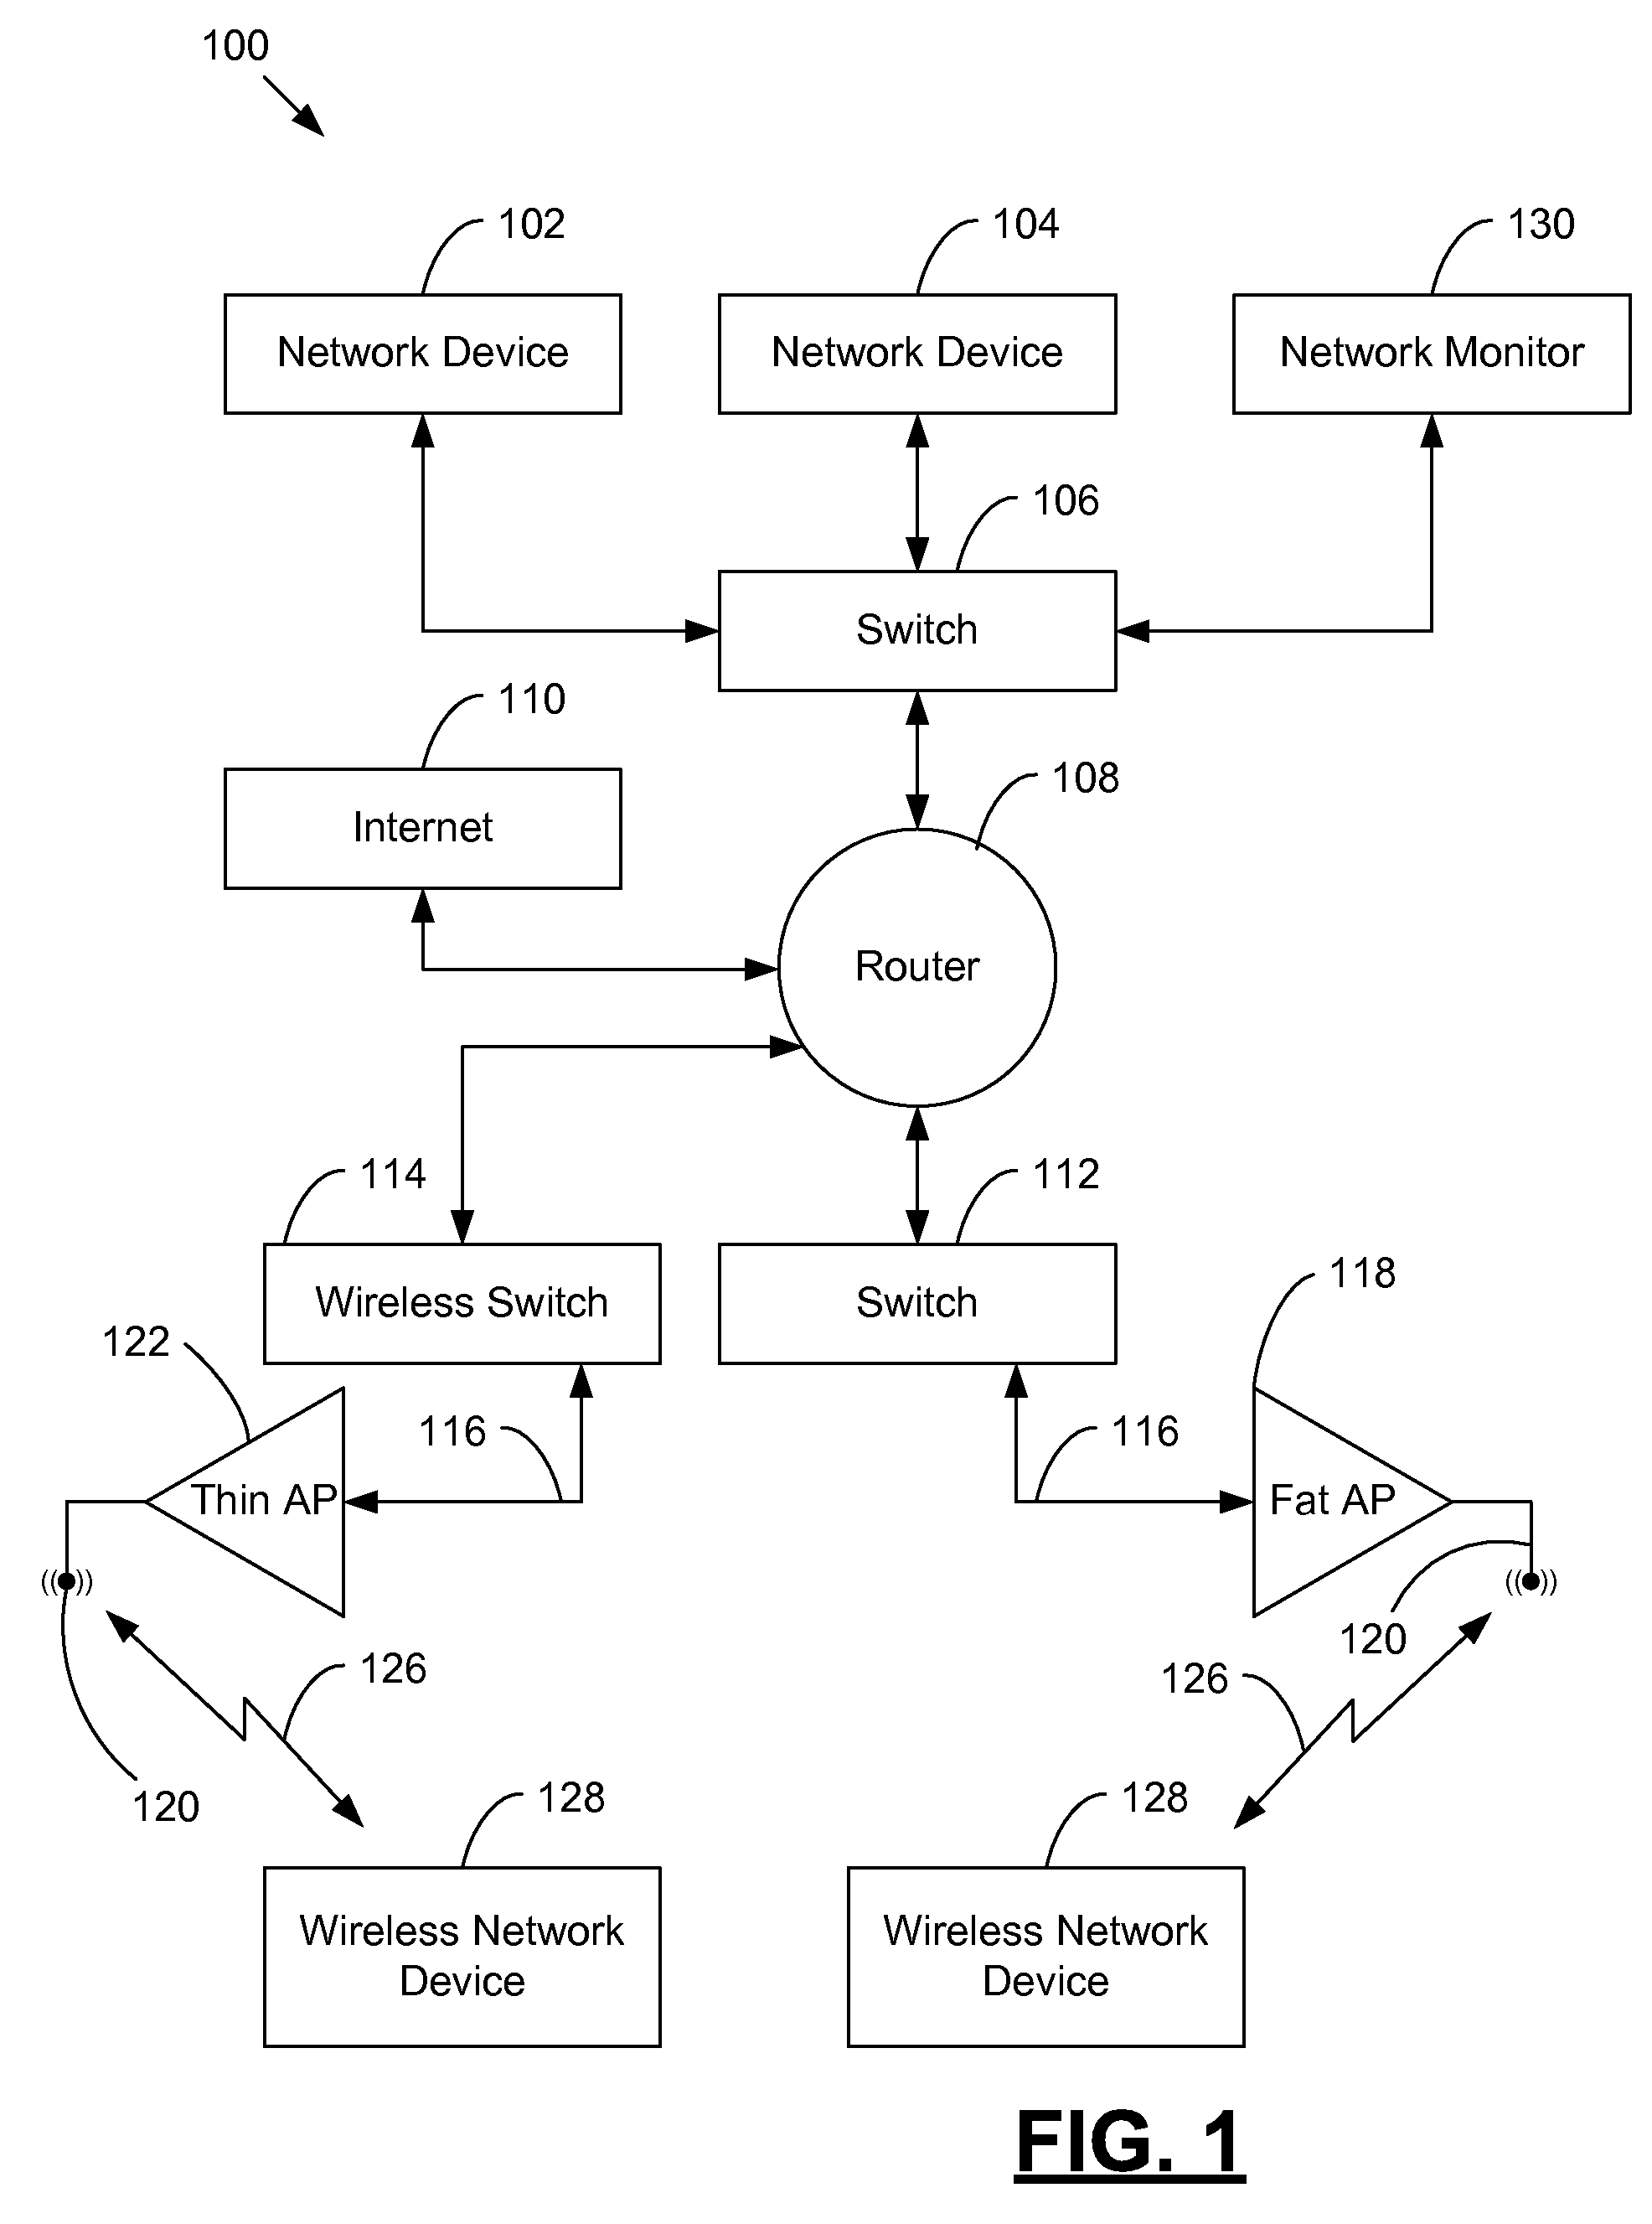
[0029]FIG. 1 shows a sample 802.3 and 802.11 network 100 wherein both a thin Access Point architecture and a Fat Access Point architecture are used. Network 100 includes a first network device 102, a second network device 104, and network monitor 130, which are each connected to one another by switch 106. Network monitor 130 may, for example, be installed on a server. Switch 106 is connected to router 108 which is connected to internet 110. Second switch 112 provides a 802.3 network connection 116 for one or more Fat Access Points 118, each with at least one antenna 120. The wireless switch 114 controls one or more Thin Access Points 122 over a network connection 116, each such Access Point having at least one antenna 120. Both Fat Access Points 118 and thin Access Point 122 can make a wireless network connection 126 to wireless network device 128. With a Fat Access Point architecture, (such as a Cisco AP 1240), all the intelligence for 802.11 communication including encryption, aut...


PUM


Abstract

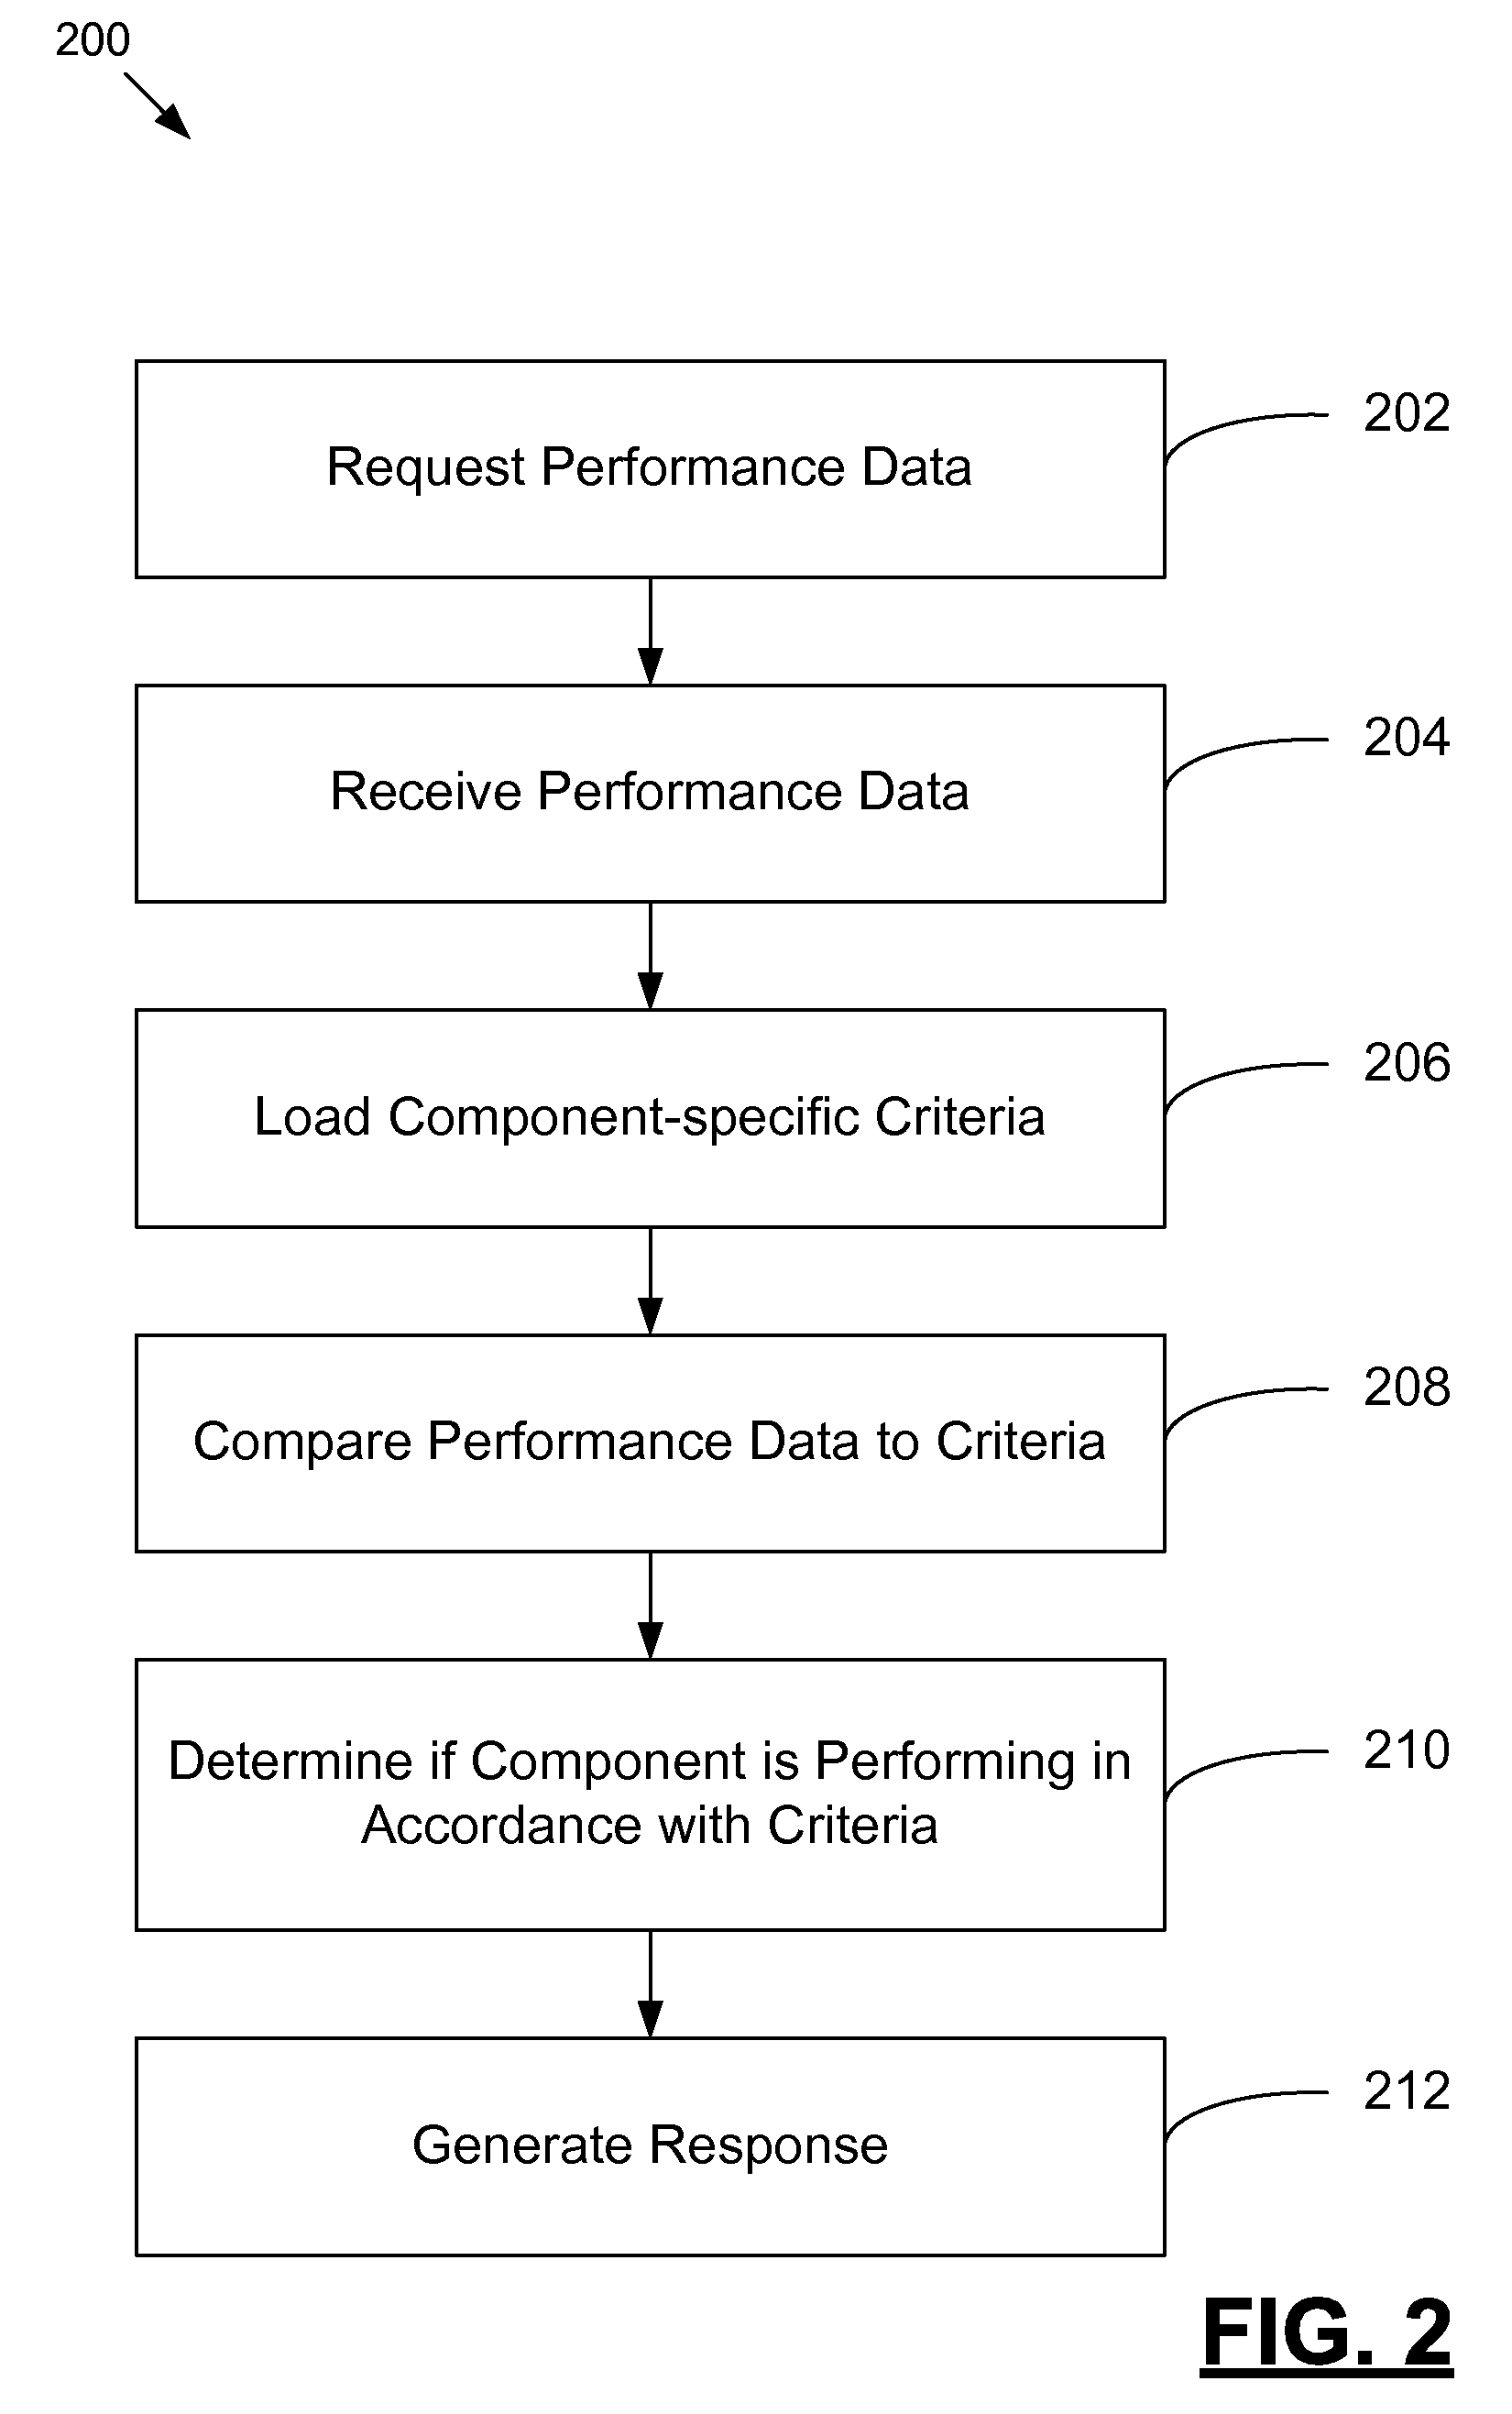
Disclosed in this specification is a method for monitoring a network, such as the central monitoring station of a medical facility. Performance data from each of the network components of interest is monitored for compliance with certain component-specific criteria. Responses are generated if the performance data satisfies, or fails to satisfy, such criteria.

Description

FIELD OF THE INVENTION[0001]This invention relates generally to mission critical data delivery on shared networks, and more particularly, to life-critical delivery of patient information to a central monitor and to clinicians across 802.3 Local Area Networks (LANs) and 802.11 Wireless LANs.BACKGROUND OF THE INVENTION[0002]Vintage analog medical telemetry from the 1970s exhibited a typical maximum data loss of 50 minutes per day—an enormous improvement over no patient monitoring. The initial digital systems stumbled as they exhibited 75 minutes per day of lost data. Over time improvements were made, but second generation Ultra High Frequency (UHF) telemetry, including most systems running in the Wireless Medical Telemetry Service (WMTS) still exhibited 25 minutes of dropout per day.[0003]The medical world received a wakeup call when a High Definition Television (HDTV) station test near the Baylor Hospital impacted patient telemetry. If a digital television station transmits in the sa...

Claims


Application Information

Patent Timeline
Patent Type & Authority Patents(United States)
IPC IPC(8): G06Q10/00G06Q50/00H04Q11/00H04B17/40G16H40/63
CPCG06Q50/22H04L41/0681H04L41/069H04L43/0852H04L43/0829H04L41/0213H04W24/00H04W48/16G16H40/63
Inventor PETERSEN, ERIC G.BAKER, STEVEN D.MARCACCINI, STEVEN J.HERITAGE, MARK A.
Owner WELCH ALLYN INC
Learn More