
Methods for driving electrophoretic displays

a technology of electrophoretic displays and electrophoretic media, applied in the direction of optics, static indicating devices, instruments, etc., can solve the problems of gas-based electrophoretic media being susceptible to the same types of problems, preventing their widespread use, and reducing the service life of these displays, so as to reduce the dc imbalance of a transition, and reduce the dc imbalan

Active Publication Date: 2012-05-08
E INK CORPORATION
View PDF310 Cites 267 Cited by
  • Summary
  • Abstract
  • Description
  • Claims
  • Application Information

AI Technical Summary

Benefits of technology

This approach enhances image stability, dynamic range, and contrast ratio while reducing the total time required for transitions, leading to improved long-term image quality and extended display lifespan.

Problems solved by technology

Nevertheless, problems with the long-term image quality of these displays have prevented their widespread usage.
For example, particles that make up electrophoretic displays tend to settle, resulting in inadequate service-life for these displays.
Such gas-based electrophoretic media appear to be susceptible to the same types of problems due to particle settling as liquid-based electrophoretic media, when the media are used in an orientation which permits such settling, for example in a sign where the medium is disposed in a vertical plane.
Indeed, particle settling appears to be a more serious problem in gas-based electrophoretic media than in liquid-based ones, since the lower viscosity of gaseous suspending fluids as compared with liquid ones allows more rapid settling of the electrophoretic particles.
A further complication in driving electrophoretic displays is the need for so-called “DC balance”.
It should be noted that simply increasing the length of a drive pulse does not always produce the most desirable extreme optical states.
Although electrophoretic displays are typically bistable, this bistability is not unlimited, and the optical state of an electrophoretic display gradually changes over time when the display is allowed to remain undriven.
However, for some electro-optic media, and in particular some encapsulated electro-optic media, the variation of optical state with impulse displays hysteresis; as the medium is driven further toward white, the optical change per unit of applied impulse decreases, but if the polarity of the applied voltage is abruptly reversed so that the display is driven in the opposed direction, the optical change per impulse unit abruptly increases.

Method used


Image

  • Methods for driving electrophoretic displays
  • Methods for driving electrophoretic displays
  • Methods for driving electrophoretic displays

Examples


example 1

White State Reflectivity and Dynamic Range

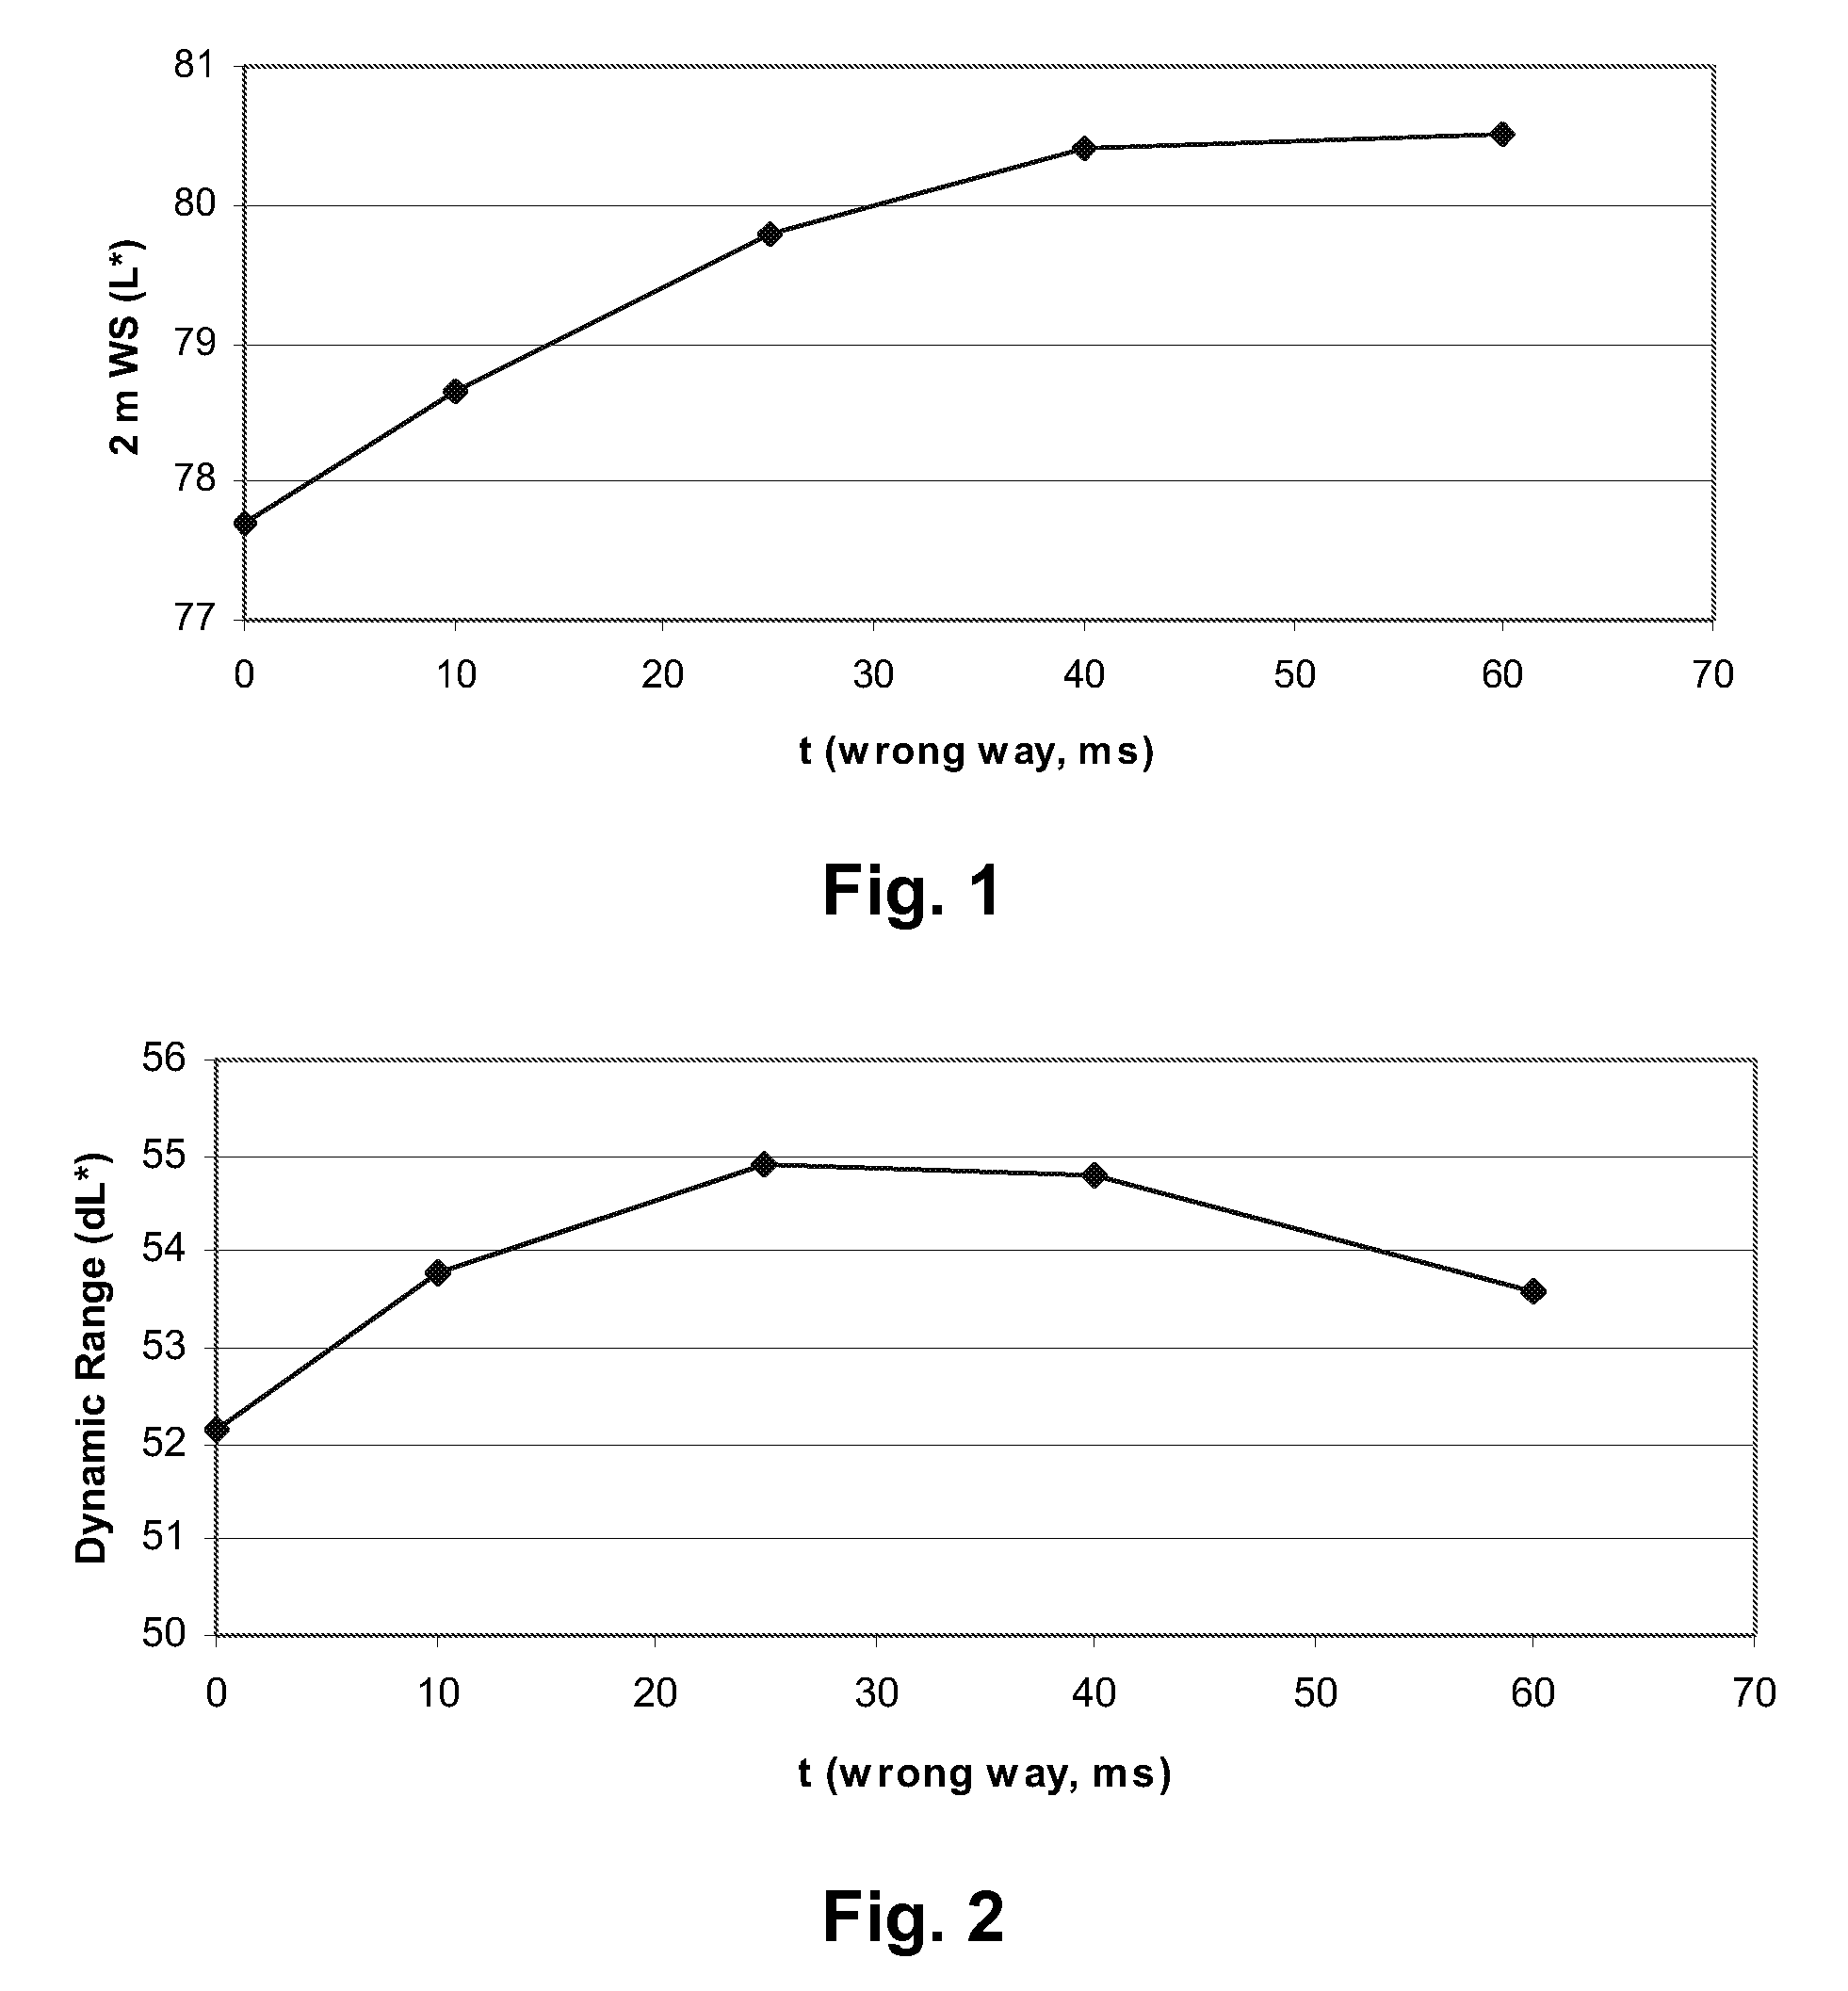
[0064]Experimental single-pixel electrophoretic displays having an encapsulated electrophoretic medium comprising polymer-coated titania and polymer-coated copper chromite were prepared substantially as described in Example 4 of the aforementioned U.S. Pat. No. 7,002,728, except that heptane was used as the fluid instead of Isopar E. These experimental displays were driven using drive schemes of the present invention with a voltage of 15 V and a total drive time of 250 milliseconds, the pre-pulse length varying from 0 to 60 milliseconds (the zero pre-pulse length of course provides a control example). Thus, the waveforms used varied from 15×(0 / 250) to 15×(60 / 190). In a first series of experiments, the displays were driven to their black and white states and the reflectivities of these states measured 2 minutes after the end of the waveform. FIG. 1 of the accompanying drawings shows the white state reflectivity (converted to L* units) as a fu...

example 2

Image Stability

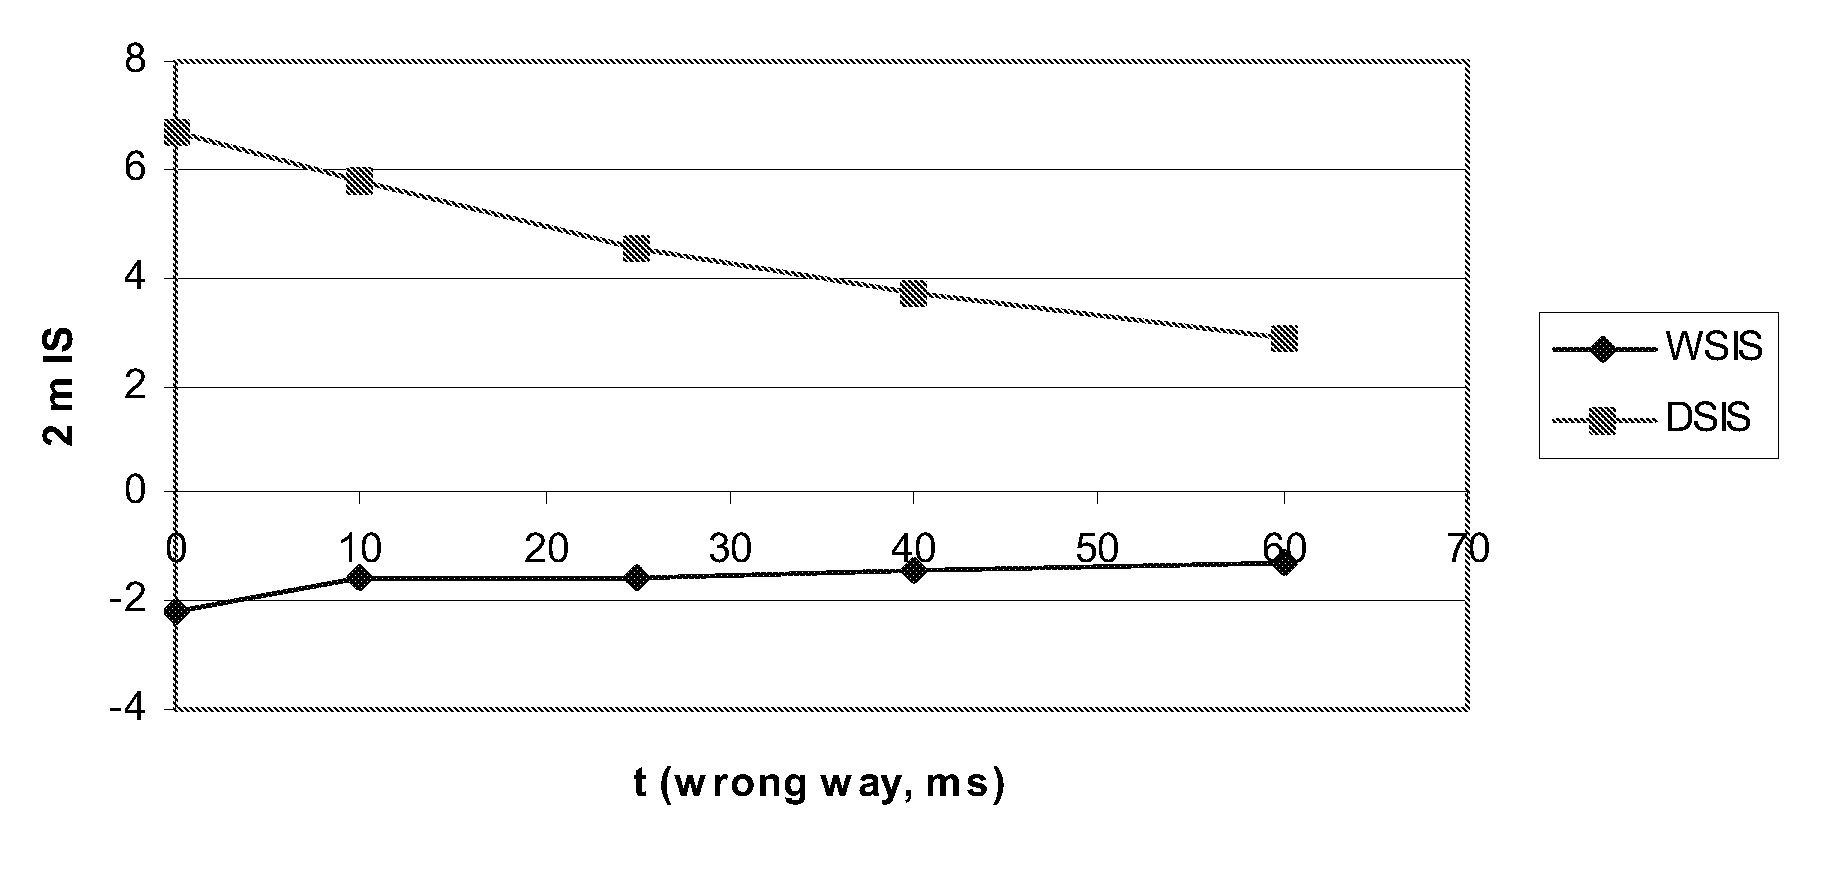
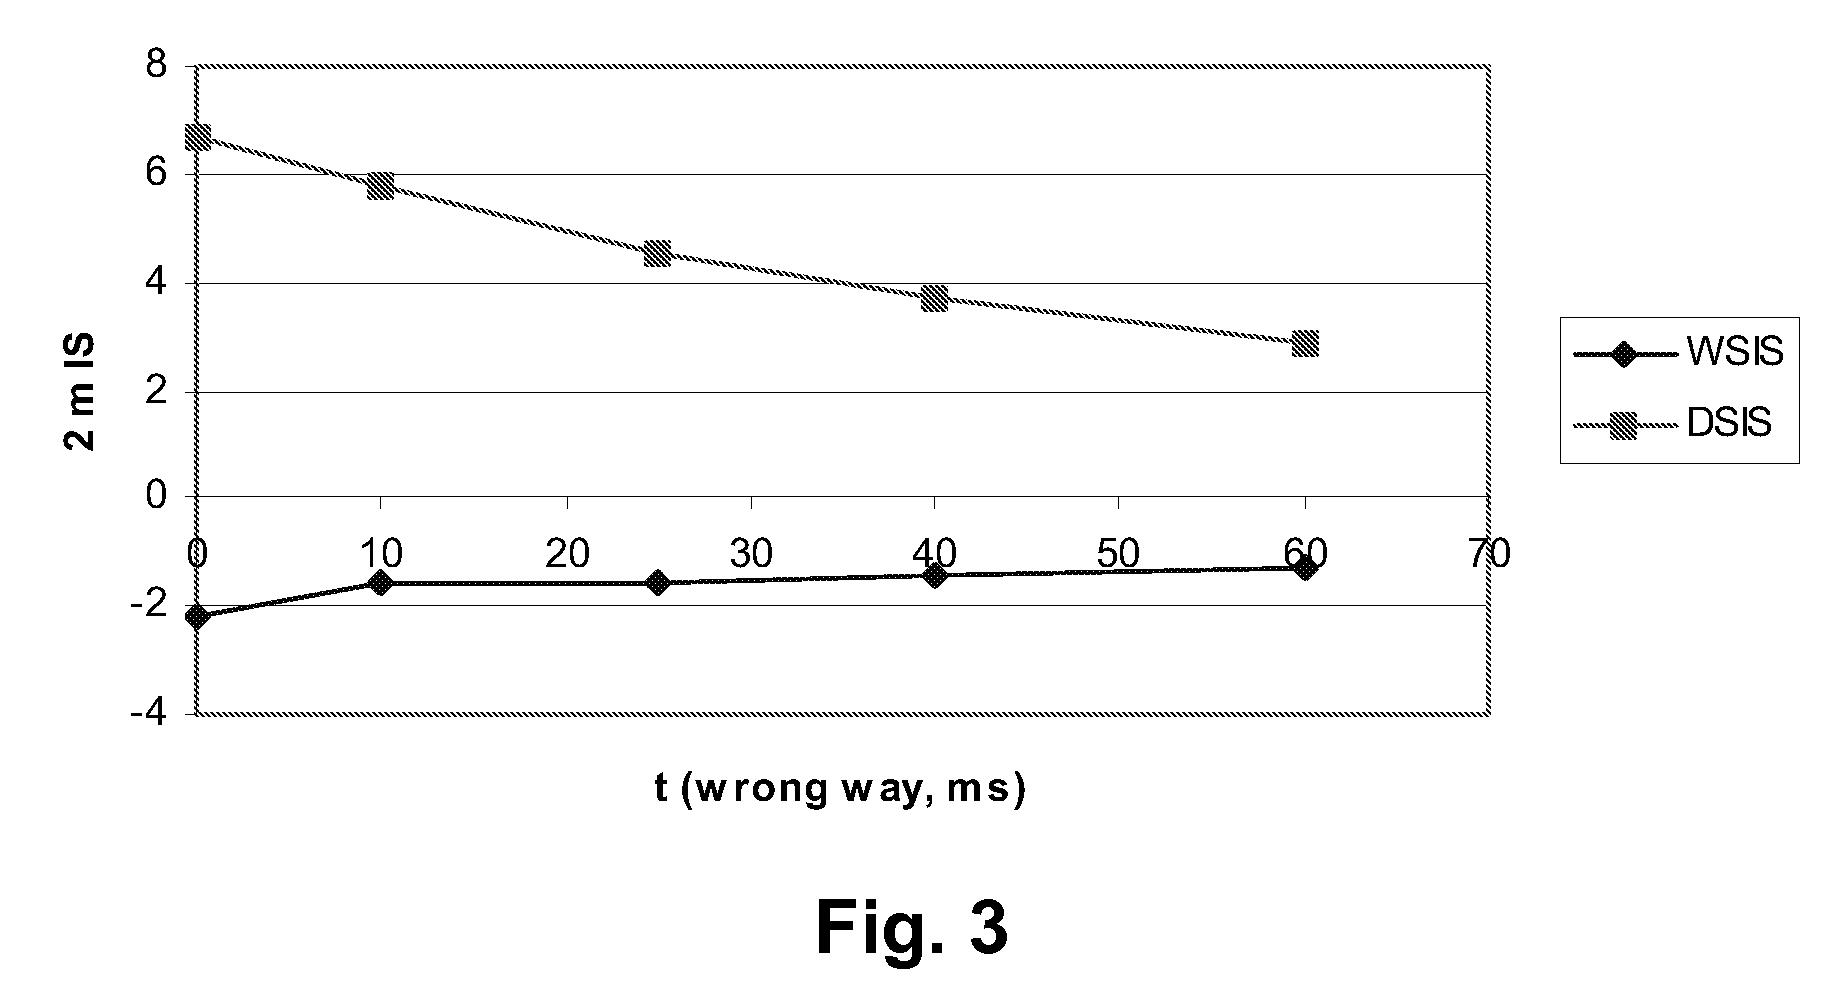
[0066]In a further series of experiments, the same displays as in Example 1 were tested for image stability using the same drive schemes as in Example 1 above. Experimentally, image stability is measured by driving the displays to their black or white state, measuring their reflectivity 3 seconds after the end of the waveform (this 3 second delay being used to avoid certain very short term effects which take place immediately after the end of the waveform) and again 2 minutes after the end of the waveform, the difference between the two readings, both expressed in units of L*, being the image stability. The image stability of the black and white states can of course differ, and the image stabilities of both states are plotted in FIG. 3 as a function of pre-pulse length.

[0067]From FIG. 3, it will be seen that increase in pre-pulse length caused a monotonic improvement (decrease) in the image stability values of both the black and white states with pre-pulse length with...

examples 3-9

Various Electrophoretic Media

[0068]To show that the advantageous results produced in Examples 1 and 2 above were not particular to the particular electrophoretic medium used, the experiments were repeated using differing electophoretic media. Examples 3 and 4 were essentially repetitions of the formulation used in Examples 1 and 2 above. Example 5 increased the concentration of the Solsperse 17K charge control by approximately 50 percent, while Example 6 was essentially similar to the composition used in Examples 1 and 2. Example 7 retained the original level of the Solsperse 17K but increased the level of polyisobutylene from 0.7 to 0.95 percent, while Example 8 used the increased concentrations of both Solsperse 17K and polyisobutylene. Example 9 was a composition using polymer-coated carbon black as the black pigment and was prepared substantially as described in Examples 27-29 of the aforementioned U.S. Pat. No. 6,822,782. A total driving time of 500 milliseconds was used in thi...


PUM


Abstract

A pixel of an electrophoretic display is driven from one extreme optical state to a second optical state different from the one extreme optical state by applying to the pixel a first drive pulse of one polarity; and thereafter applying to the pixel a second drive pulse of the opposite polarity, the second drive pulse being effective to drive the pixel to the second optical state.

Description

REFERENCE TO RELATED APPLICATIONS[0001]This application is a continuation-in-part of application Ser. No. 10 / 879,335, filed Jun. 29, 2004 (Publication No. 2005 / 0024353, now U.S. Pat. No. 7,528,822), which claims benefit of the following Provisional Applications: (a) Ser. No. 60 / 481,040, filed Jun. 30, 2003; (b) Ser. No. 60 / 481,053, filed Jul. 2, 2003; and (c) Ser. No. 60 / 481,405, filed Sept 22, 2003.[0002]This application also claims benefit of Provisional Application Ser. No.60 / 824,535, filed Sept. 5, 2006.[0003]This application is also related to a series of patents and applications assigned to E Ink Corporation, this series of patents and applications being directed to MEthods for Driving Electro-Optic Displays, and hereinafter collectively referred to as the “MEDEOD” applications. This series of patents and applications comprises:[0004](a) U.S. Pat. No. 6,504,524;[0005](b) U.S. Pat. No. 6,531,997;[0006](c) U.S. Pat. No. 7,012,600;[0007](d) application Ser. No. 11 / 160,455, filed ...

Claims


Application Information

Patent Timeline
Patent Type & Authority Patents(United States)
IPC IPC(8): G09G3/34
CPCG09G3/344G09G2310/06G09G2320/0204G09G2320/0238G09G2320/0252
Inventor WHITESIDES, THOMAS H.AU, JOANNA F.AMUNDSON, KARL R.ZEHNER, ROBERT W.KNAIAN, ARA N.ZION, BENJAMIN
Owner E INK CORPORATION
Learn More