
Cost analysis and reduction tool

a technology of cost analysis and tool, applied in the field of cost analysis and reduction tools, can solve the problems of more difficult implementation, coincidental declines in production or resource shortages, restructuring-based cost reduction strategies, etc., and achieve the effects of reducing customer service staffing costs, reducing supplier numbers, and increasing profitability

Active Publication Date: 2011-04-12
ACCENTURE GLOBAL SERVICES LTD
View PDF22 Cites 32 Cited by
  • Summary
  • Abstract
  • Description
  • Claims
  • Application Information

AI Technical Summary

Benefits of technology

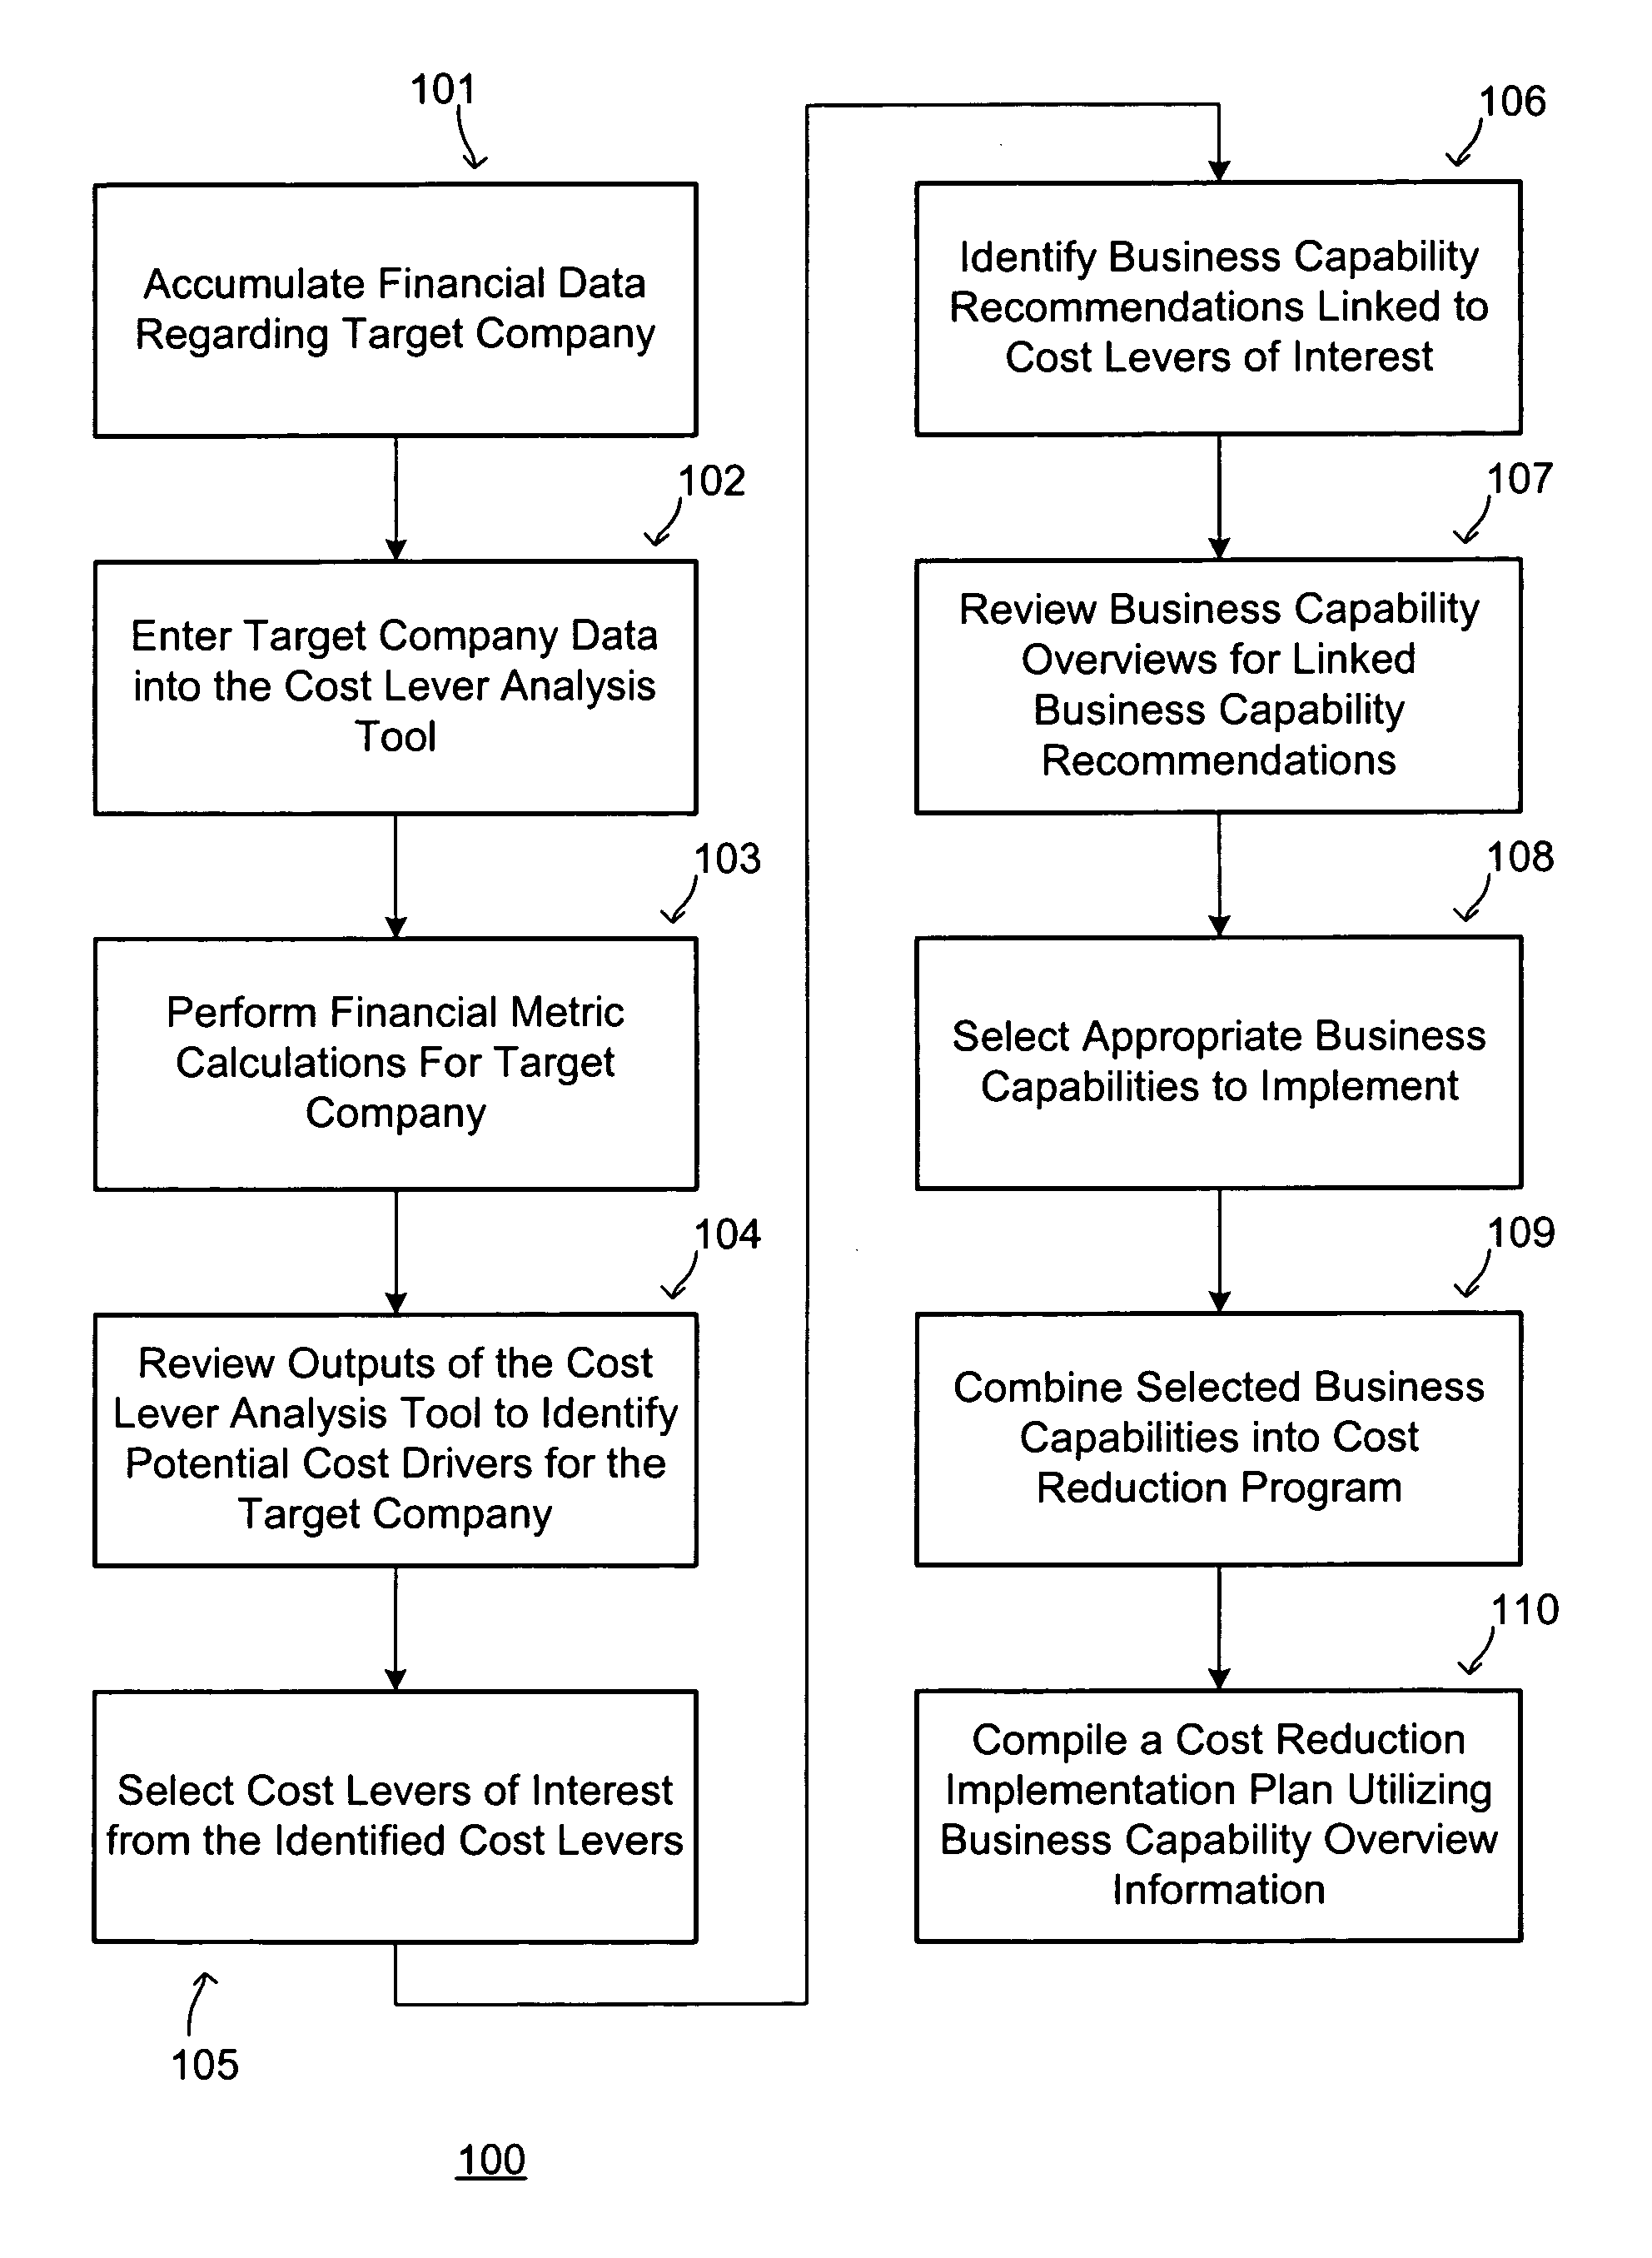
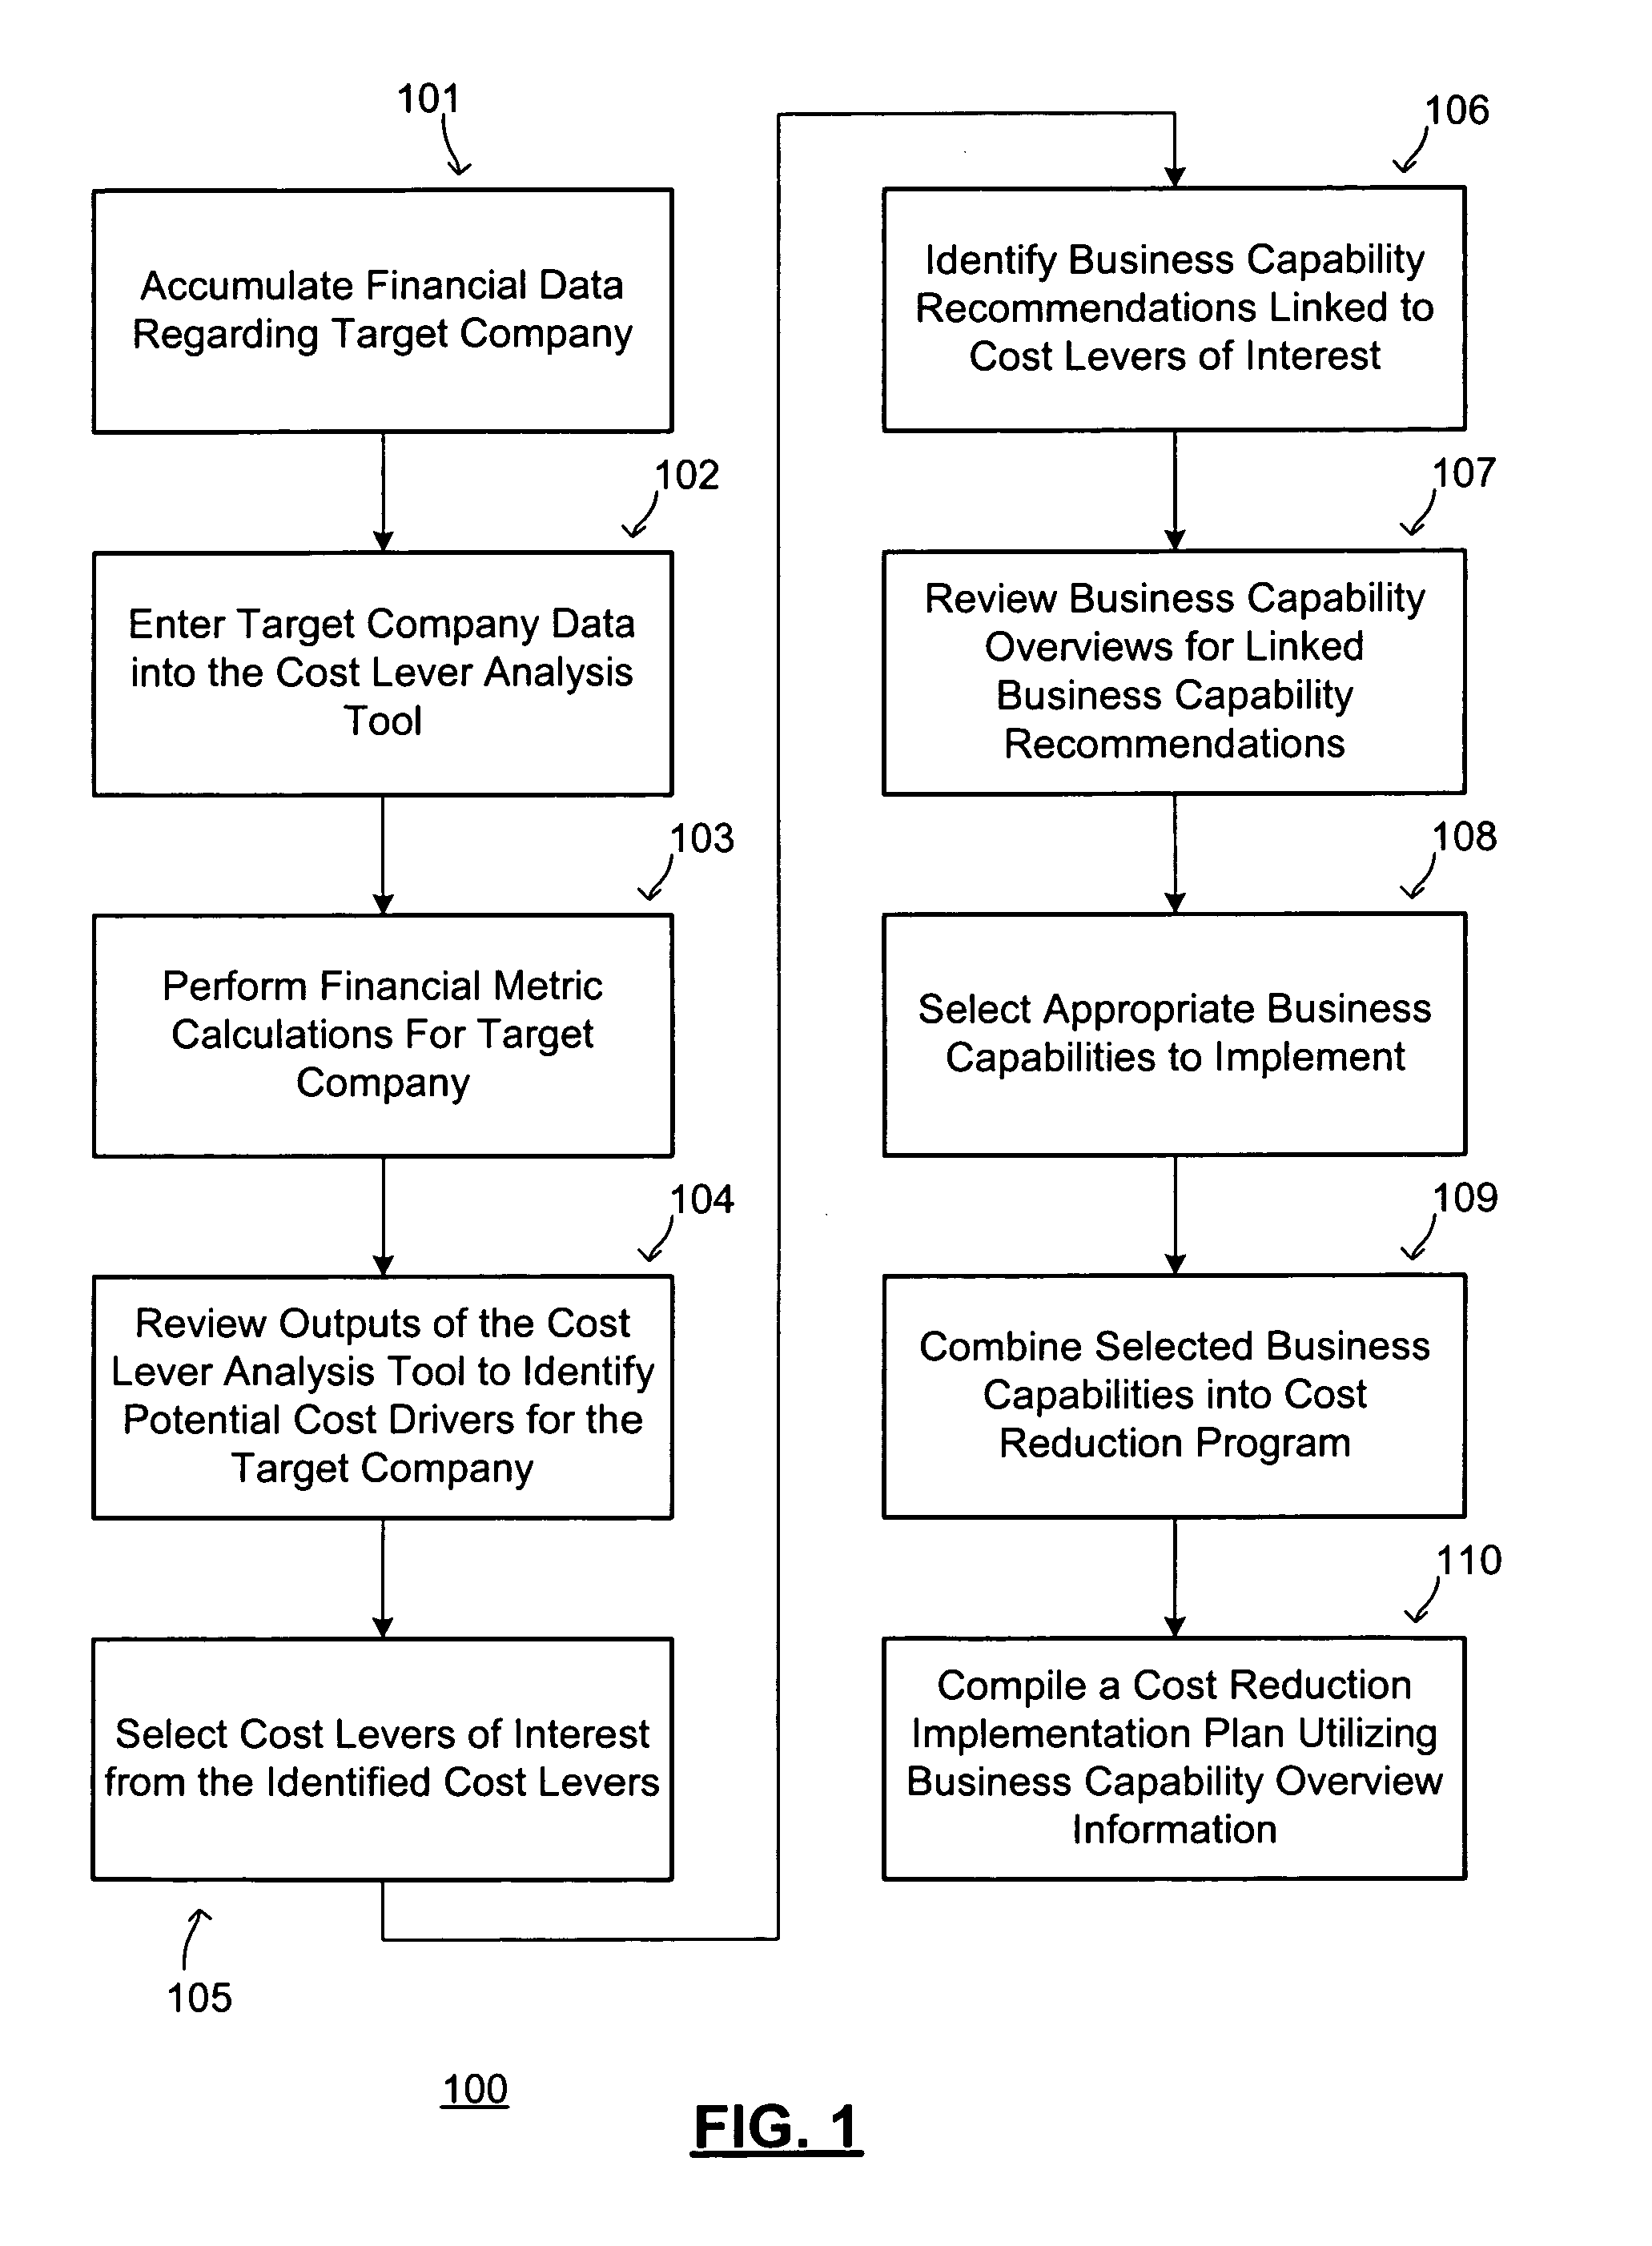
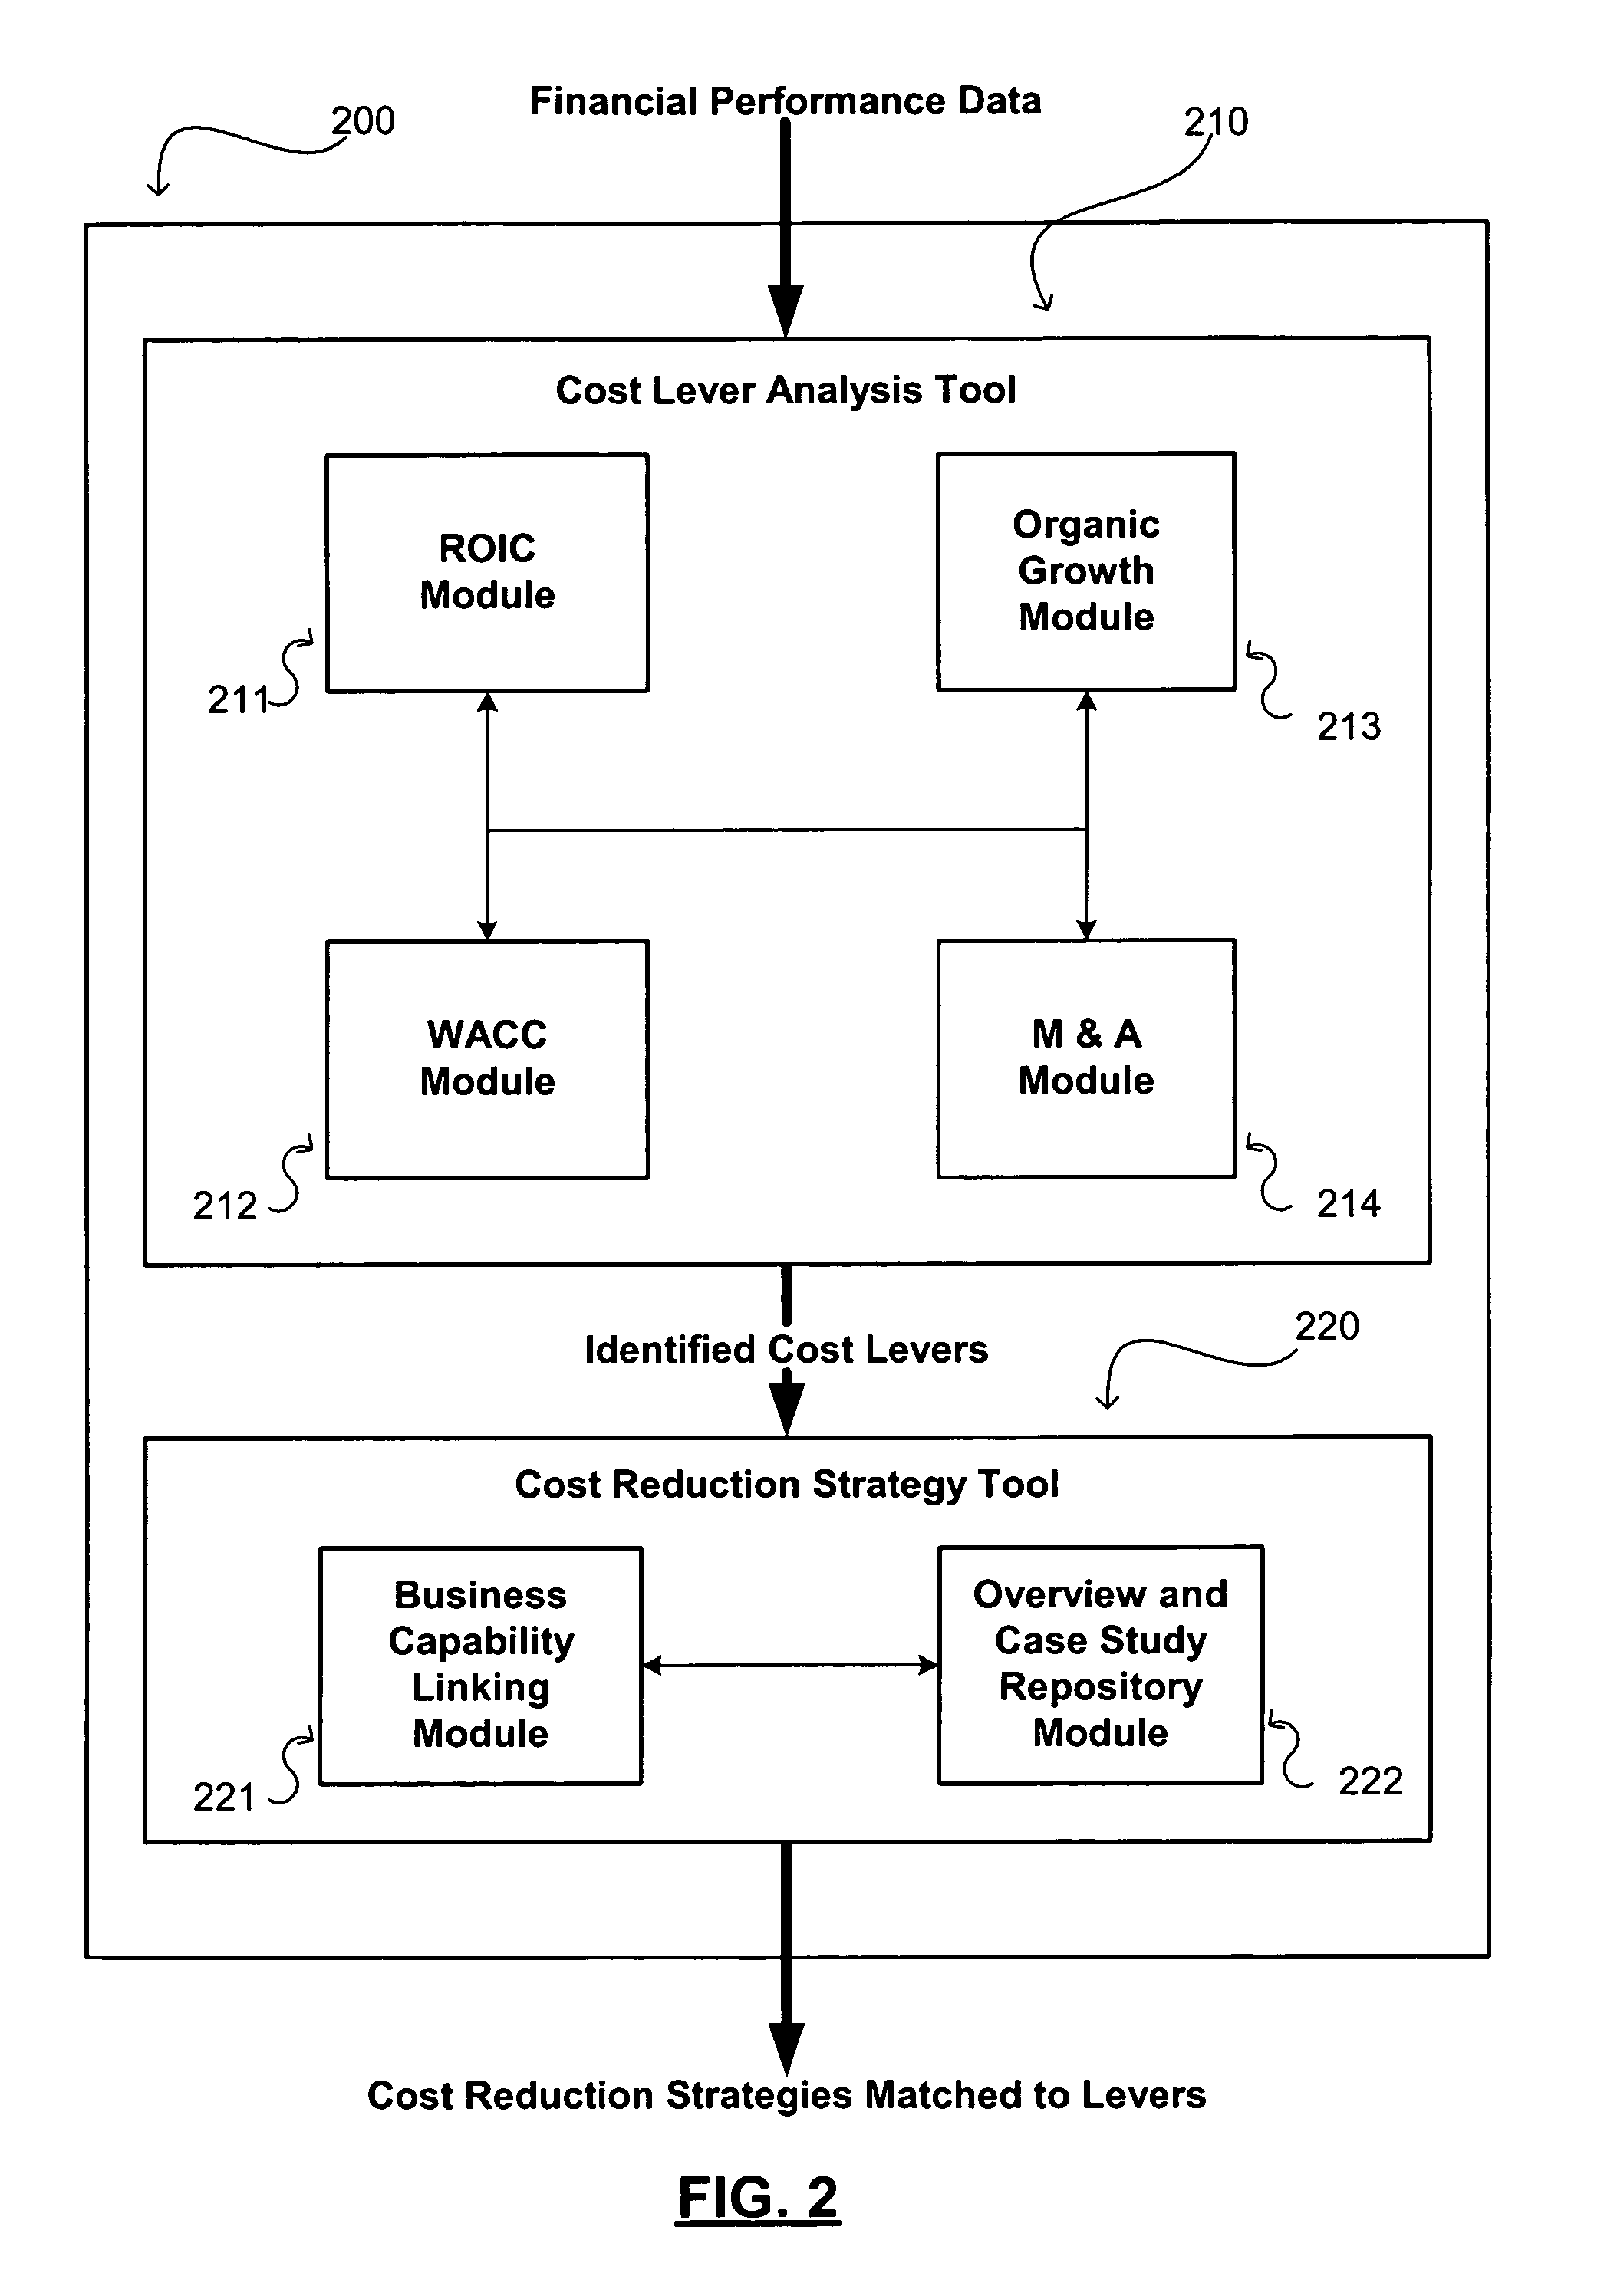
The present invention provides an electronic system, tool, and related methods for analyzing and implementing cost reduction strategies for companies. The system allows for meaningful comparisons of companies using readily available financial data and identifies key cost levers for targeting with cost reduction strategies. The system includes a cost lever identification tool and a cost reduction strategy tool that work together to assist companies in identifying, investigating, and implementing cost reduction strategies. The system also provides a business capability overview for each capability recommendation, allowing companies to better understand the impact of the recommended strategies on their cost structure. Overall, the system simplifies the process of identifying and implementing cost reduction strategies for companies.

Problems solved by technology

Often, such quick fix cost cutting mechanisms produce beneficial effects only in the short term as they may lead to coincidental declines in production or resource shortages once market conditions improve.
Restructuring-based cost reduction strategies, however, are more difficult to implement, have longer time horizons, and thus are more difficult to analyze in terms of impact.
These difficulties make restructuring-based cost reduction strategies typically more risky, and, therefore, companies are hesitant to implement or even consider ambitious restructuring-based cost reduction strategies without having carefully and fully researched them and obtained reliable positive forecasts of success.
However, many factors limit the usefulness of cost reduction case studies and make meaningful forecasting regarding the impact of cost reduction strategies inherently difficult.
Unfortunately, the positions of no two companies are absolutely identical.
While a comparison of a target company to companies described in case studies can be made using financial data, those in the business community understand that financial data regarding companies, whether public or private, is often provided in various different yet legally acceptable forms that make straightforward comparisons misleading or altogether inaccurate.
Importantly, results from simple calculations of such metrics utilizing publicly available information frequently can be misleading.
This makes it difficult to make meaningful comparisons of companies and examine the relative effectiveness of cost cutting policies within different companies because of the inability to gauge the extent of similarity of a target company with a company described in a case study.
With respect to many metrics calculated from public information, standardization of these metrics can be difficult due to the variability introduced by Generally Accepted Accounting Principles (“GAAP”) and international differences in accounting practices.
While readily available, publicly disclosed financial information and metrics calculated from such information cannot be readily compared among differing companies or time frames due to the lack of standardization identified above.
Similarly, there is a wide disparity in the calculation of Net Income from one country to another.
Furthermore, Net Income may be misleading because companies that have been highly involved in acquisitions tend to have higher non-cash charges (e.g., amortization) that result in lower new income.
Also, the assets and equity quantities may be misleading because of accounting anomalies, such as acquisitions in which a seller may sell fully depreciated assets to a buyer who must record assets equal to fair value at the time of purchase.
Similar problems also exist with the other commonly used metrics of business performance because of GAAP limitations and international differences in accounting practices.
As a consequence of inconsistencies with respect to how different entities report similar matters, it is inherently difficult to analyze and compare data from other companies in an easy, yet meaningful, way.
The information from readily available financial statements and filings, such as from the EDGAR or commercial databases, unfortunately is difficult to comprehend without processing that requires a high level of skill and time consuming, expensive labor.
Likewise, the complexity and variation in financial statements as described above likewise often makes it difficult and expensive for many companies to analyze their own financial performance.
From the standpoint of businesses, it is difficult to identify cost drivers and examine cost cutting strategies because the most readily available and complete financial data is compiled for the purpose of financial statements and tax filings.
Given the inaccuracies built into financial data numbers via tax and accounting conventions, companies are left with the non-ideal options of collecting raw data or attempting to use financial data while correcting for any systematic inaccuracies.
Since companies often encounter these difficulties when trying to quantitatively and accurately compare their performance and business situation with those of their peers, they likewise find it difficult to gauge whether certain cost reduction strategies that have been employed successfully by other companies (and restructuring-based cost reduction strategies in particular) will have similar desirable impacts for them.

Method used


Image

  • Cost analysis and reduction tool
  • Cost analysis and reduction tool
  • Cost analysis and reduction tool

Examples


example

[0106]In this example, a company has the following financial numbers:

[0107]βL=0.79

[0108]TR=40%

[0109]E=$2,781 Mill.

[0110]D=$747 Mill.

[0111]RF=5%

[0112]MRP=5%

[0113]KD=7%

For the company in the analysis, the β value is preferably unlevered using Equation 13, as described above. Thus, the company has

[0114]βU=⁢βL / [1+(1-TR)*D / E]=⁢0.79 / [1+(1-40⁢⁢%)*(747 / 2781)]=⁢0.68

[0115]As described above, the unlevered beta values βU should generally fall close to the industry average (within a range of + / −0.25). Unexplained outliers should be adjusted to the industry average to account for measurement errors in calculating betas. For instance, if the industry for the company in this example has an average βU of 0.35, the difference between the two βU values exceeds 0.25. Accordingly, the cost of equity should be recalculated using the industry average βU value. Returning again to Equation 12 from above and using the industry average βU value (βU(Industry)), we can make the following calculations:

[0116]βU=...


PUM


Abstract

Disclosed are systems and related methods for performing cost reduction analyses, and selecting and implementing appropriate cost reduction programs. The systems include electronically enabled tools for automatically performing cost analyses, identifying cost levers, and selecting cost reduction strategies targeting those cost levers. Disclosed embodiments examine a target company's financial data and detect the key levers or drivers that affect the company's cost structure. Thereafter, the identified cost levers are linked to one or more pertinent business capability recommendations where each linked capability recommendation is tailored to provide at least one element of a cost reduction strategy adapted to address one or more of the identified levers. Further, business capability overviews are provided for each capability recommendation, where the overview can contain case studies, implementation plans, integration implications, sample benefit and impact forecasts and other relevant information pertaining to the understanding, assessment and implementation of that particular capability recommendation.

Description

CROSS REFERENCE TO RELATED APPLICATIONS[0001]The present application is a continuation-in-part of U.S. non-provisional application Ser. No. 10 / 609,690, filed Jul. 1, 2003, the subject matter of which is hereby incorporated by reference in full.FIELD OF THE INVENTION[0002]The present invention relates to a system and related methods for performing cost reduction analyses, and selecting and implementing appropriate cost reduction programs. More particularly, the present invention pertains to electronically enabled tools for automatically performing cost analyses, identifying cost levers, and selecting cost reduction strategies targeting those cost levers.BACKGROUND OF THE INVENTION[0003]In times of economic downturn, the focus of many companies turns to reducing costs as a means to maintain profitability. Frequently, such cost cutting measures focus on “quick fix” mechanisms such as cuts in fringe benefits, staffing reductions, and business travel cut backs. Often, such quick fix cost...

Claims


Application Information

Patent Timeline
Patent Type & Authority Patents(United States)
IPC IPC(8): G06Q40/00
CPCG06Q40/00G06Q40/10G06Q40/025G06Q40/02G06Q40/03
Inventor FICERY, KRISTIN L.OSTERGARD, MICHAEL KIRK
Owner ACCENTURE GLOBAL SERVICES LTD
Learn More