Method of visualizing non-targeted metabolomic data generated from fourier transform ion cyclotron resonance mass spectrometers

a metabolomic data and transform ion technology, applied in the field of visualizing non-targeted metabolomic data generated from fourier transform ion cyclotron resonance mass spectrometers, can solve the problems of limiting the ability to view and interpret large amounts of metabolite data, and no effective way to display or organize information from multiple non-targeted sample analyses, so as to achieve rapid and condensed display or visualization, the determination and identification of metaboli

Active Publication Date: 2008-03-25
MED LIFE DISCOVERIES LP
View PDF26 Cites 2 Cited by
  • Summary
  • Abstract
  • Description
  • Claims
  • Application Information

AI Technical Summary

Benefits of technology

[0015]iii) creating a data structure comprising a two dimensional (2-D) array in which the unique mass list defines the vertical axis and the number of files selected defines the horizontal axis. The amount of the metabolite present is displayed in cells defined by the vertical and horizontal axis coordinates according to a user-defined color code. The user may be provided the option of viewing the data in any number of ways, for example, but not limited to, by a) observed metabolite intensity; b) the ratio or percentage of the observed intensity to the: average intensity of that metabolite from the files selected; c) the ratio or percentage of the observed intensity to the observed intensity of one of the selected files, or a combination thereof. Thus, the method allows for the rapid and condensed display or visualization of multiple metabolite data files. As a result the determination and identification of metabolite changes in complex mixtures may be greatly simplified.

Problems solved by technology

Currently, there is no effective way to display or organize information from multiple non-targeted sample analyses such that a user can quickly identify changes in metabolite profiles.
The ability to view and interpret large amounts of metabolite data is a rate-limiting step in the study of biological systems using non-targeted metabolomic methods.

Method used


Image

  • Method of visualizing non-targeted metabolomic data generated from fourier transform ion cyclotron resonance mass spectrometers
  • Method of visualizing non-targeted metabolomic data generated from fourier transform ion cyclotron resonance mass spectrometers
  • Method of visualizing non-targeted metabolomic data generated from fourier transform ion cyclotron resonance mass spectrometers

Examples


example 1

Analysis of Multiple Non-targeted Samples

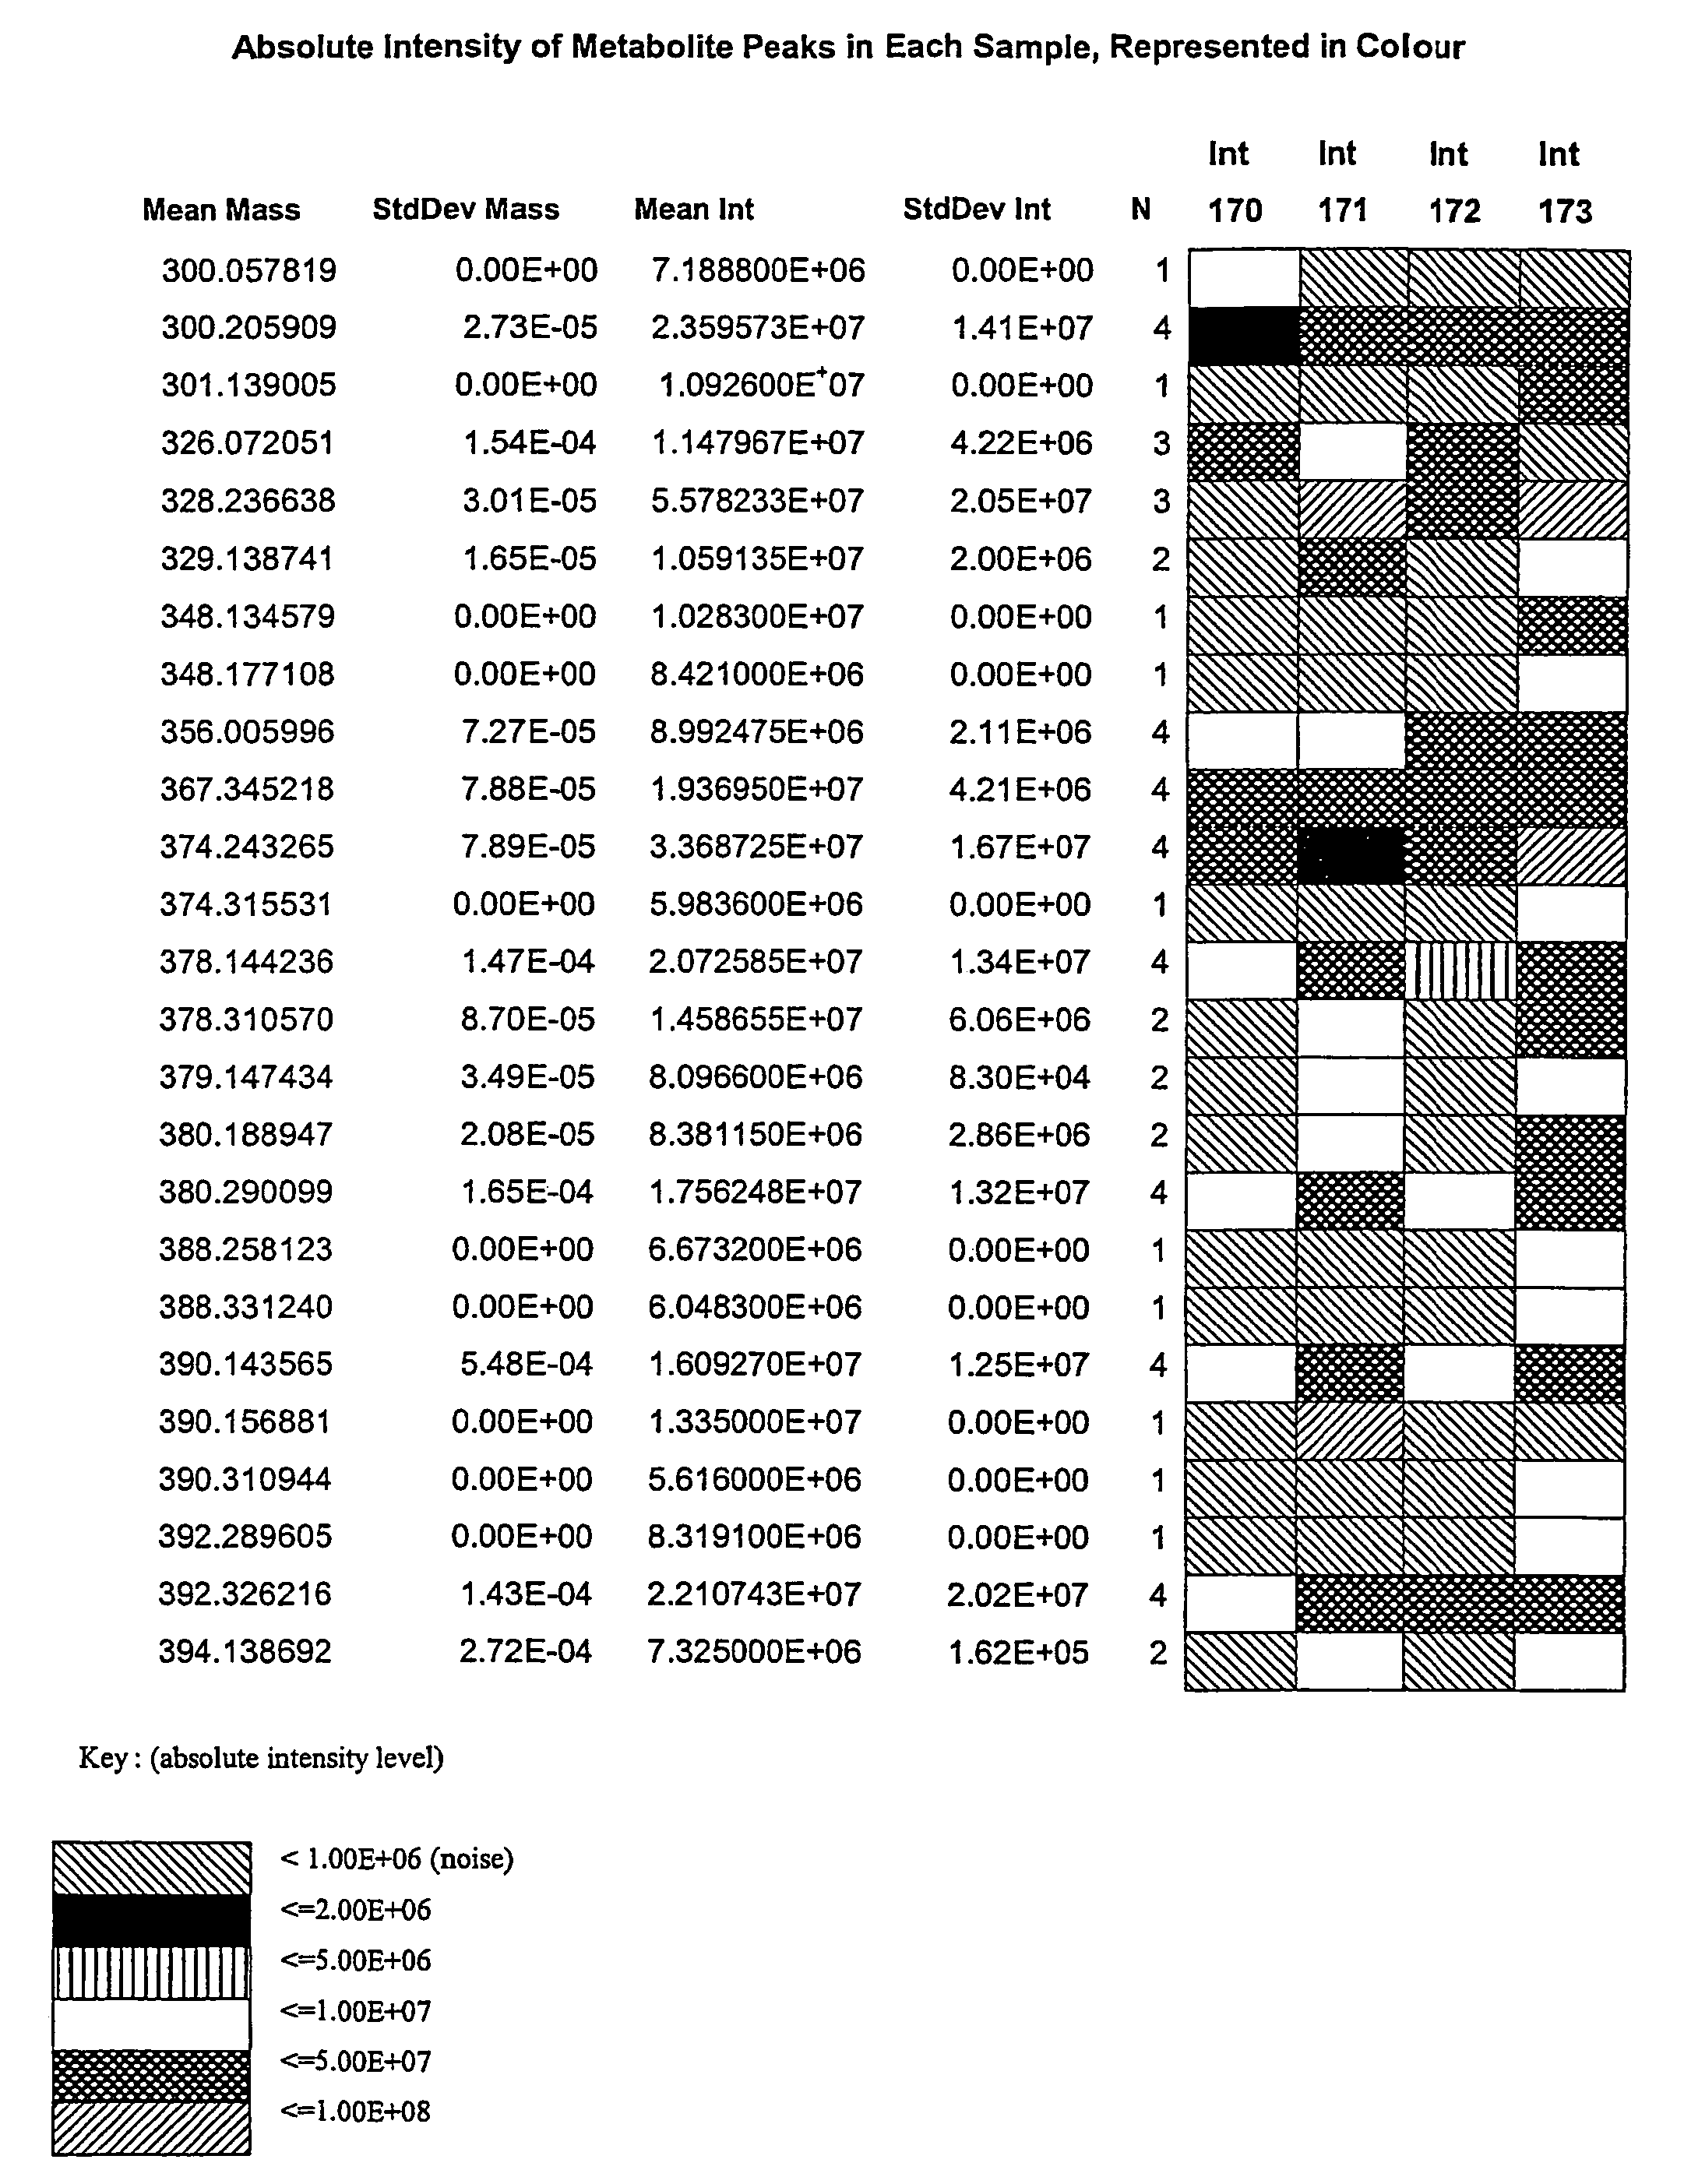
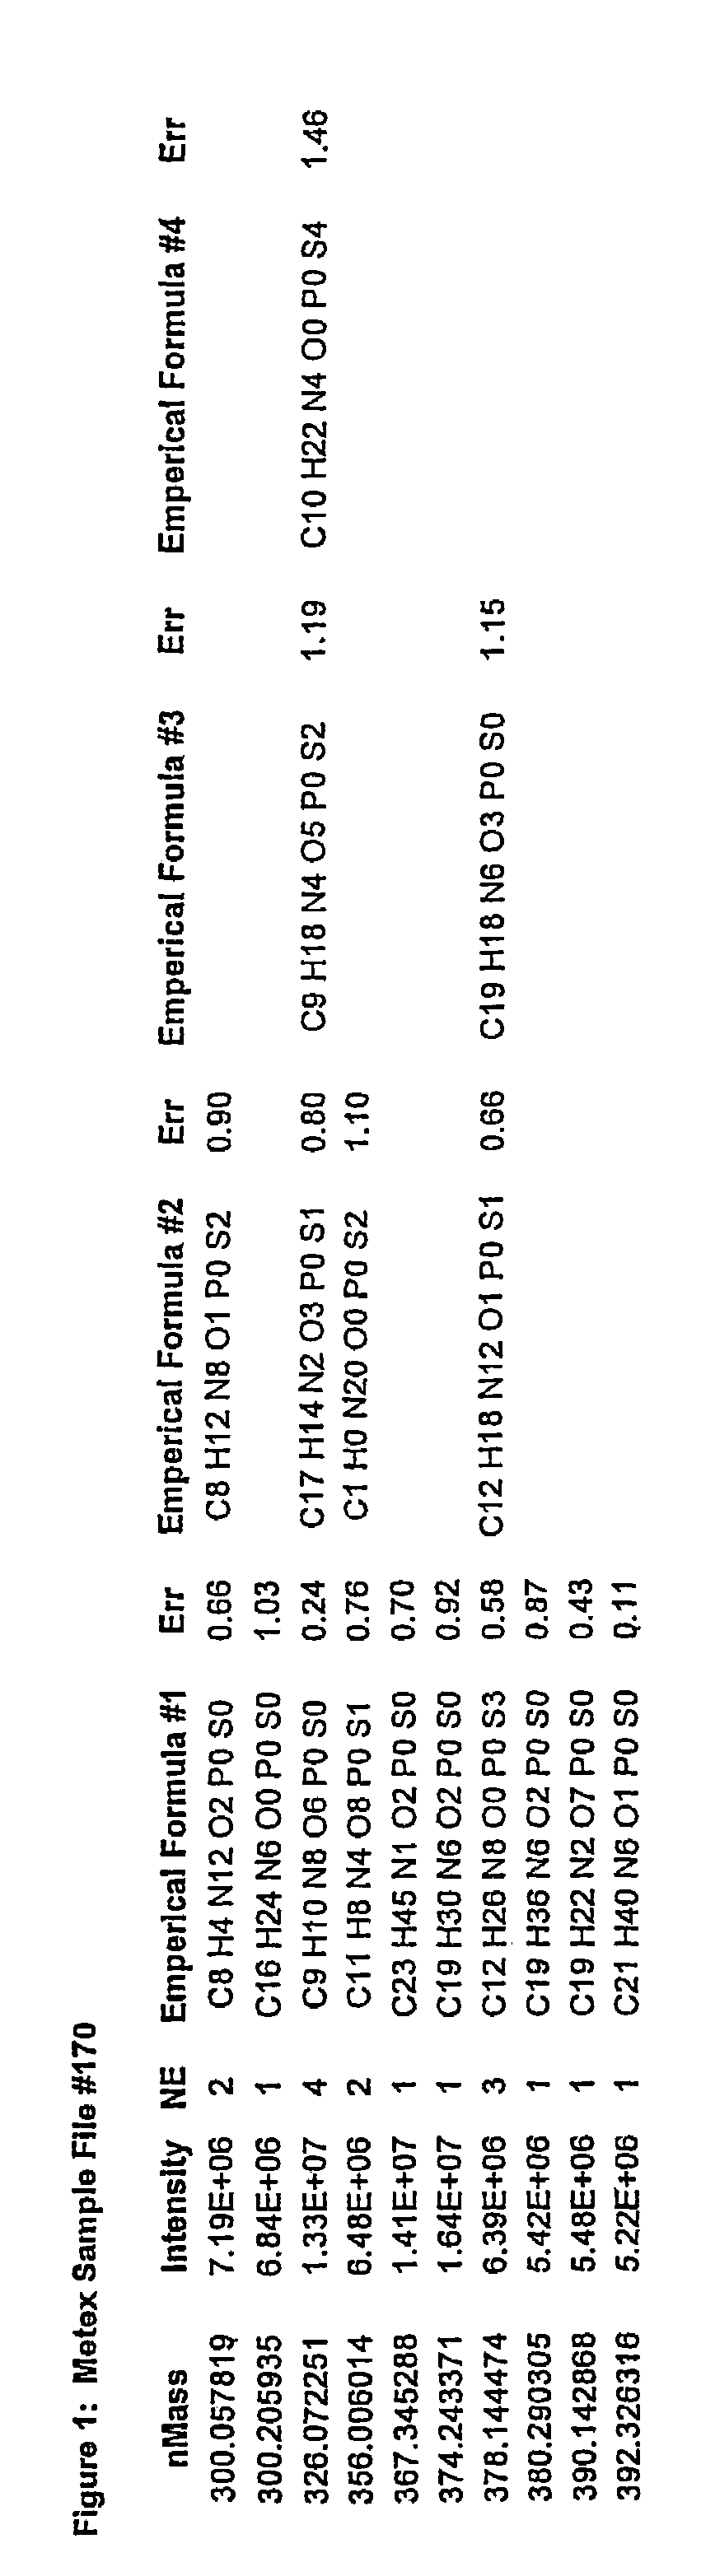
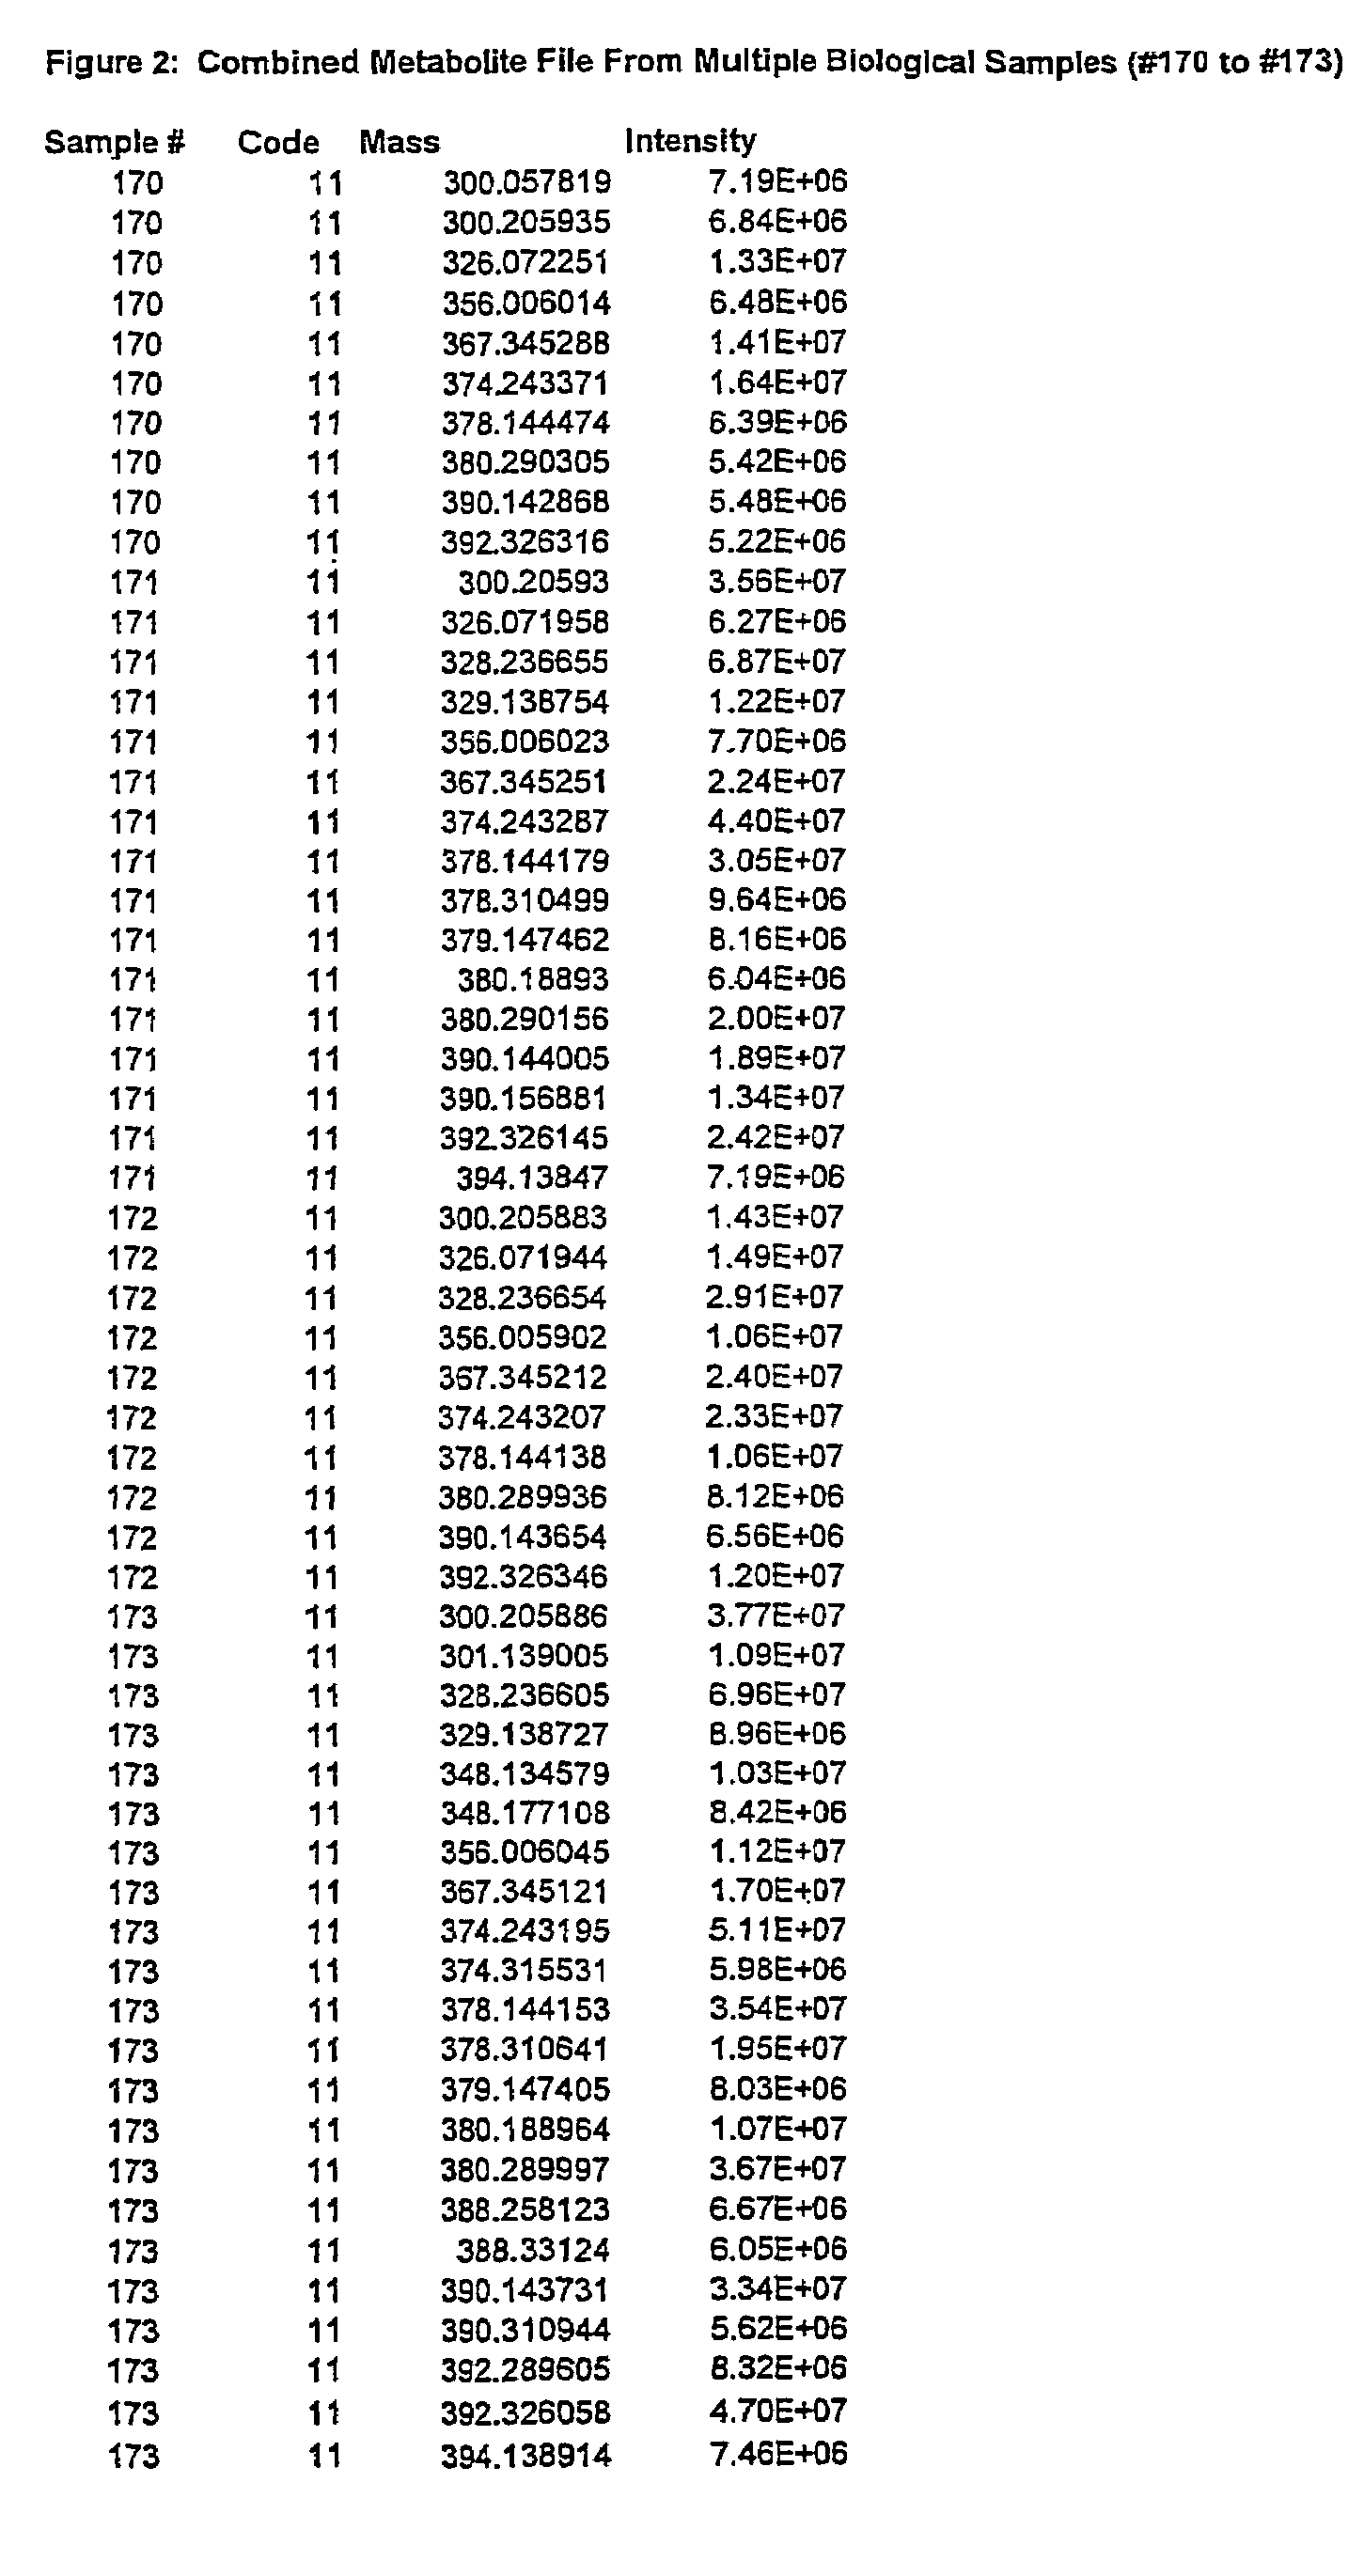
[0072]Processed data files from complex samples are first analyzed as described in a previous patent application (No. 2,298,181, Canada, No. PCT / CA01 / 00111). The results of this analysis are in the format as shown in FIG. 1. Data from multiple files are then combined together as shown in FIG. 2. At this stage the data is reduced such that only file name, ionization / extraction code, mass and intensity values remain. This combined file is then processed to determine all of the unique masses. The average, standard deviation, and number of each unique mass is then determined. This list represents the y-axis. A column is created for each file that was originally selected to be analyzed. This list represents the x-axis. The intensity for each mass found in each of the files selected is then filled into its representative x,y coordinate as is shown in FIG. 3. Coordinates that do not contain an intensity are left blank. Once in the array, the data ca...


PUM

PropertyMeasurementUnit
spectroscopic dataaaaaaaaaaa
Fourier transform ion cyclotron resonance mass spectrometeraaaaaaaaaa
mass spectrometeraaaaaaaaaa

Abstract

The invention can be summarized as follows. The present invention provides a method of displaying spectroscopic data comprising in steps of, i) obtaining spectroscopic data from a plurality of samples, each sample comprising one or more components wherein each component is characterized by an ordered pair (X,Y) of data comprising data element value X and data element value Y, wherein X is a data element value, equivalent or directly proportional to the mass of the component, and Y is a data element value equivalent or directly proportional to the amount of the component; ii) identifying all unique components comprising a common data element value X in said samples; computing the average of all X therefrom; and determining the average and optionally, the standard deviation for all Y values from all ordered data pairs comprising a common X; iii) generating a data structure comprising an array of codable cells, each cell assigned a color or other identifiable characteristic based on the relationship of the amount of each unique component present in each of said samples in relation to a predetermined value or other characteristic of the spectroscopic data. Also disclosed are data structures comprising spectroscopic data.

Description

[0001]The present invention relates to methods of displaying data from analytical instruments. More specifically, the present invention relates to methods of displaying data from mass spectroscopy instruments and data structures containing such data.BACKGROUND OF THE INVENTION[0002]Metabolite profiling is an emerging science that is used in determining gene function, effects of genetic engineering on an organism, substantive equivalence, drug mechanisms of action, adverse drug reaction monitoring and the biochemical basis of diseases. Non-targeted metabolic profiling using FT-ICR-MS identifies a large number of metabolites from complex biological extracts. The final output from such analyses is the masses and intensities of observed metabolites. The masses can be used to determine the molecular formulas, and thus the identity of the metabolites present in the sample, whereas the intensity is used to determine the amount of the metabolite present in the sample. By comparing the metab...

Claims


Application Information

Patent Timeline
Patent Type & Authority Patents(United States)
IPC IPC(8): C12Q1/68G01N31/00G01N33/48G01N33/50G16B45/00G16B50/30
CPCG06F19/26G06F19/708H01J49/0036H01J49/38G06T11/206G06F19/28G16B45/00G16B50/00G16C20/80G16B50/30G06F17/14
Inventor HEATH, DOUGLASGOODENOWE, DAYAN
Owner MED LIFE DISCOVERIES LP
Why Eureka
Try Eureka