Method of interactive visualization and parameter selection for engineering design

a technology of engineering design and parameter selection, applied in the field of engineering design, can solve the problems of increasing the difficulty of design, affecting the design process, and affecting the design process, and achieve the effect of promoting designer understanding

Active Publication Date: 2006-10-31
SYNOPSYS INC
View PDF13 Cites 7 Cited by
  • Summary
  • Abstract
  • Description
  • Claims
  • Application Information

AI Technical Summary

Benefits of technology

[0019]The present invention relates a improved method of interactively determining values of design variables for engineering design. For example, in the realm of circuit design, the present invention relates to helping a designer obtain optimal circuits and providing the designer insight into the complicated interactions between circuit metrics (characteristics of the circuit of concern to the designer) and circuit design variables. These metric, design variable interactions will hereinafter be referred to as “the problem domain”.
[0021]It is a goal of the present invention to provide an approach for front end analog design that is faster than manual design and promotes designer understanding better than automated analog design. Therefore this invention “sits between” manual and automatic design, i.e. is a method for semi-automated design. When implemented as a software tool, the present invention complements tools for manual design and tools for automated design. The present invention combines the best aspects of both manual and automated design and is applicable to analog topology design and to analog sizing, as well as other areas of engineering design.
[0022]It is a further goal of the present invention to apply the insights from the method for semi-automated design to improve the efficiency of automated design. This invention achieves its results through the sequential sweeping of design variables (starting from a nominal circuit). The invention allows construction of optimal circuits and provides insight into the problem domain by proceeding based on the assumption that each metric varies independently with each design variable. Stated another way each metric can be modified by adjusting a design variable without caring how the other design variables are adjusted.
[0023]The invention allows the designer to gain insight into the problem domain by enabling the designer to visualize the metric dependencies on any design variable. This allows the designer to visualize the tradeoffs of multiple metrics through a design variable and allows the identification of the design variables which are important in the modification of a specified metric. By giving the designer insight into the problem domain the designer may be able to optimize some or all of the important metrics or the circuit. This manual optimization involves an entire sweep of the design variables (also referred to as a “sensitivity analysis”) and the designer's investigating tradeoffs and altering design variables to improve important metrics of the circuit. The process of conducting a conducting a design variable sweep and investigating tradeoffs is done one or more times as required.
[0025]The present invention enables the creation of optimal circuits through two different methods. The first method involves the automation of the manual method mentioned above. The second method takes advantage of the metric interdependence on design variables by sweeping each design variable independently. Another important feature of the invention is that it enables the sweeping of design variables independently to allow the discovery of optimal circuits quickly and in a way that scales linearly with the number of design variables used in the circuit.
[0033]We examine the circuit understanding gained from using this method and find that it is greatly improved over automated sizing, and in many ways is comparable to manual sizing. It shows the relation between each design variable and each metric, which is the critical information for the analog designer. It gives the designer an understanding of the important design variables, and their effects. It does it visually so that the information can be learned quickly. And because it gives the designer these relationships and the designer knows the relation between the circuit topology and design variables, then the designer's understanding of the topology's functioning is improved. (In automated sizing that critical link between topology and design variables is weakened because the designer is less involved with specific design variables.) One might argue that since it presents more information about design variables and their relation to metrics or performance characteristics than the designer might otherwise be aware of, then it could conceivably provide more understanding than pure manual design. Of course, there are other aspects of understanding that would still be the realm of manual design, such as simplified equations to relate the design variables to performance. Accordingly, the semi-automated design method of the present invention combines the speed of automated sizing with the understanding of manual sizing.

Problems solved by technology

This is because analog circuits have many characteristics that increase the difficulty of design, including nonlinear effects and the high sensitivity of the performance of the circuits to variations in manufacturing conditions and environmental conditions.
Topology design is typically very time consuming—it is possible for a team of designers to spend six months working on a single topology.
Designers typically have to repeat this process of tweaking, simulating, and examining many times. This process of sizing can typically be very long as well: with each new application of the topology it can take many weeks or months for a design team to come up with device parameter values that satisfy the performance characteristic goals.
Another strength is the flexibility of manual design as compared to automated design, because automated tools may not be programmed to be able to do everything that is required in a given design step.
The greatest weakness of manual analog design is that it is very slow.
Also, to get ever higher quality designs takes ever longer.
Another weakness is that many steps are tedious, such as the sizing process.
Another weakness is that it takes a long time for designers to become truly proficient at analog design; therefore for all the time that they are not fully proficient the design time is even longer, or design quality is lower, than it would have been if they were fully proficient.
A final weakness is that sometimes design rigor is not followed; for example, at the beginning of the design cycle designers may not explicitly state which specific circuit characteristics are targeted; because there is no clear time to stop designing, this lack of rigor leads to overdesign and longer design cycles, or to underdesign.
A weakness of automated sizing is that it does not promote designer understanding; therefore all the benefits associated with designer understanding are not achieved.
Also, the tools may not be as general and flexible as manual design.
Also, because it does not promote designer understanding, adoption of such automated tools is slowed; designers are reluctant to use such tools because they want to maintain and build their understanding of circuits, e.g. so that they can properly do topology design.
In summary: manual analog design is slow but promotes designer understanding, whereas automated analog design is fast but does not promote designer understanding.

Method used


Image

  • Method of interactive visualization and parameter selection for engineering design
  • Method of interactive visualization and parameter selection for engineering design
  • Method of interactive visualization and parameter selection for engineering design

Examples


Embodiment Construction

[0043]The present invention relates to a method of interactive visualization and parameter selection for engineering design.

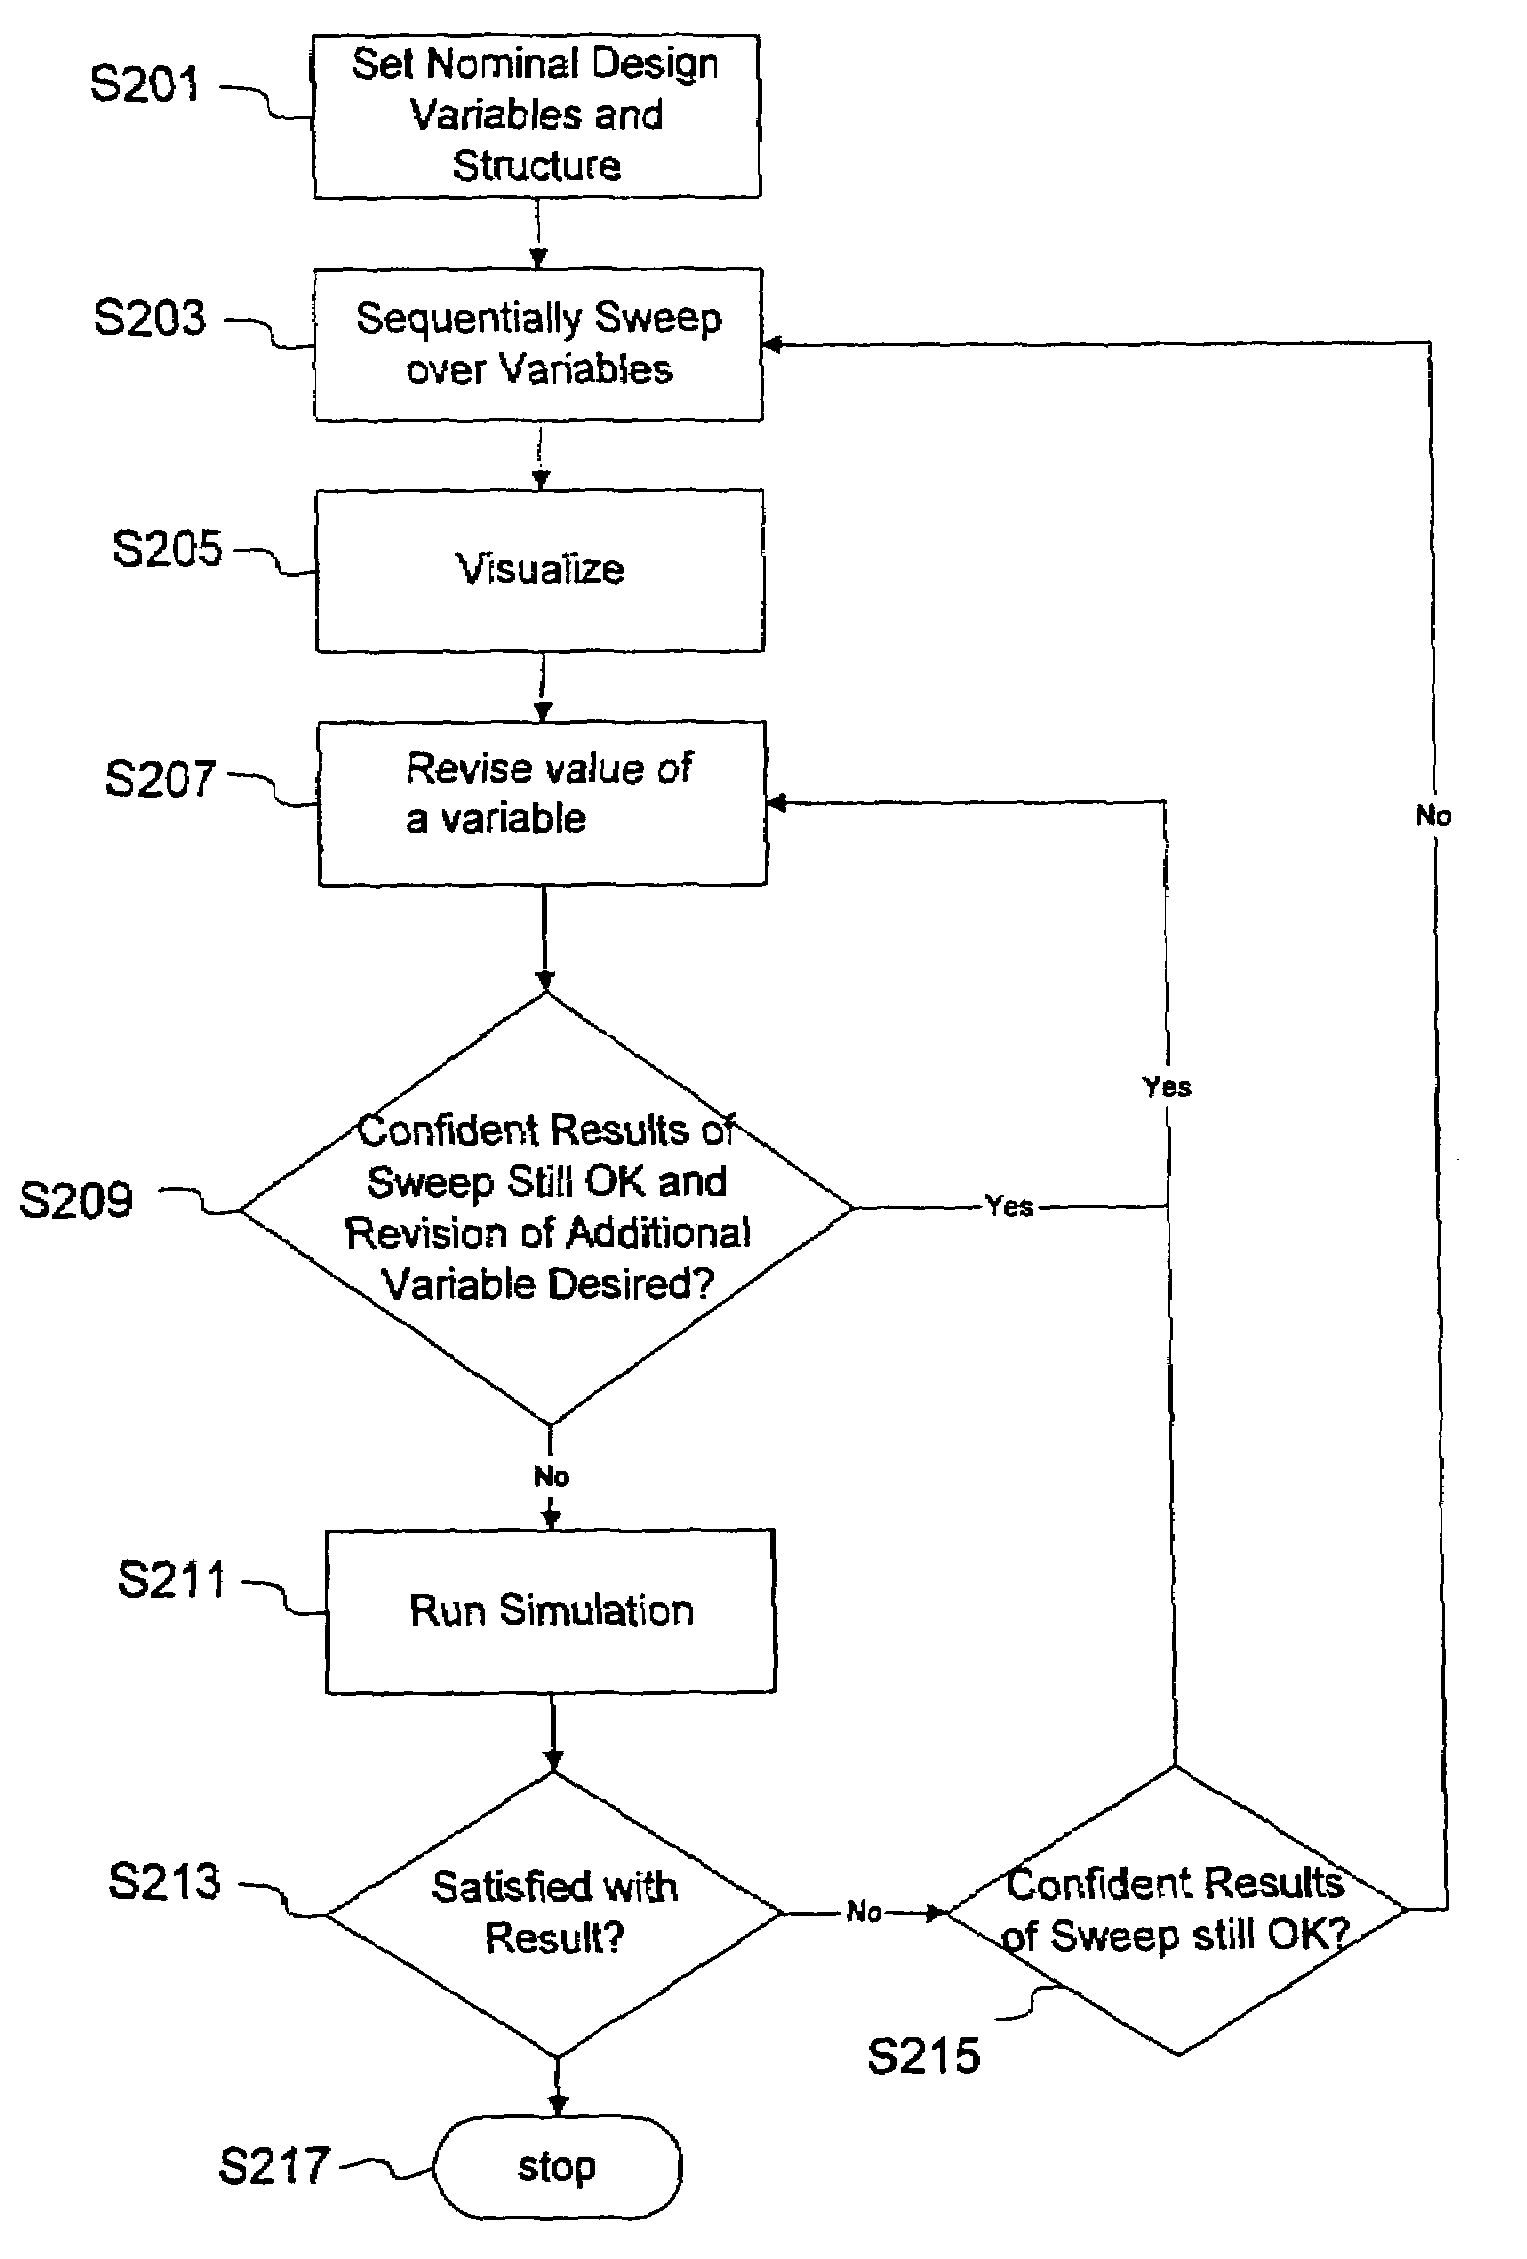
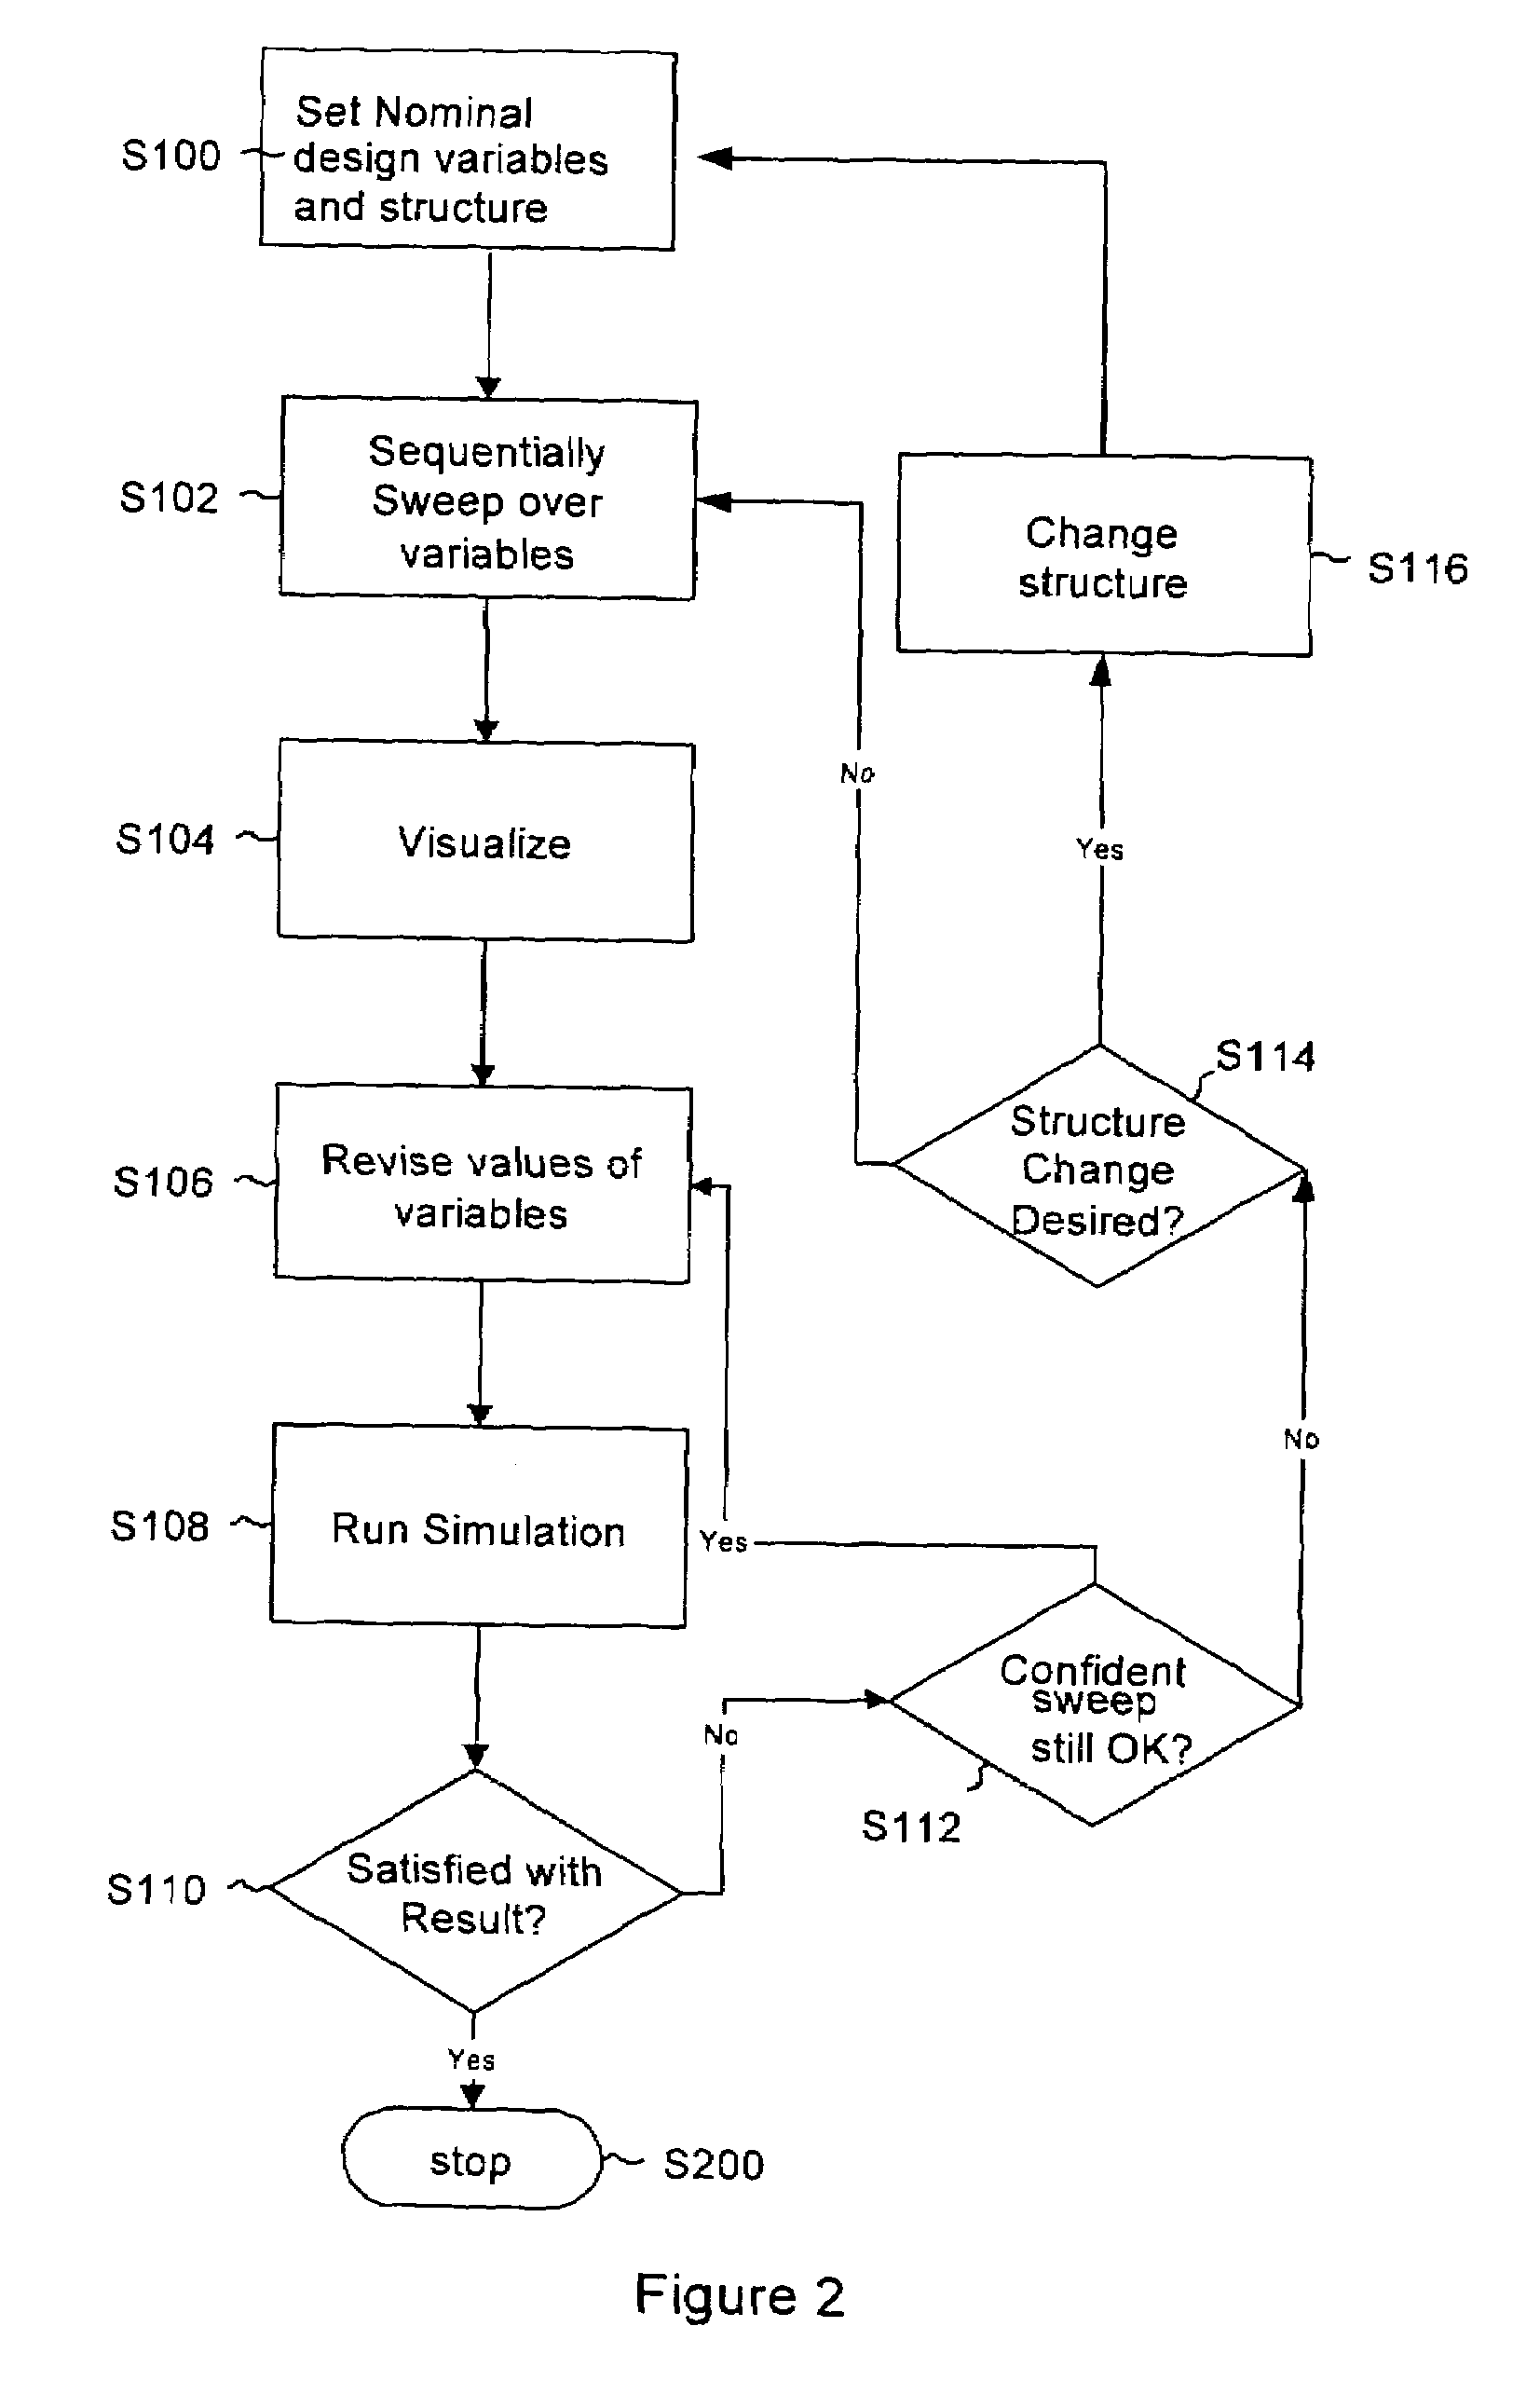
[0044]It is an aspect of the present invention to apply the techniques from the method for semi-automated design to improve the efficiency of automated analog sizing techniques. A core insight is that we can proceed as if design parameters are not coupled. This insight can be developed into a simple algorithm, which cycles through the design parameters one at a time trying all possible values of the parameter, always keeping the best design so far as it goes.

[0045]The algorithm proceeds as follows:

Given an initial set of design parameters Init_params:

Best_design=Init_params

Repeat the following until termination criteria hit:

[0046]For each design parameter p,[0047]For each possible value v of p,[0048]Candidate_design=Best_design but altered to have v at p[0049]Evaluate performance characteristics of Candidate_design[0050]If Candidate_design is better than Best_D...


PUM


Abstract

The present invention relates to a method of interactive visualization and parameter selection for engineering design. Initially, a nominal topology and associated design variables are set. The design variables are treated as being independent of each other for the purposes of a design variable sweep or sensitivity analysis to determine effects of changes in design variables on performance. The results of the sweep are presented to a designer, for example, by a suitable software tool including a graphical user interface. The designer selects design variables and revises their values based on the visually presented results of the sweep and effects a simulation using the revised values. If the results are satisfactory and a stopping condition is satisfied then the method is done. Otherwise, a determination must be made as to whether additional values can be changed or whether a new sweep must be effected. If a sweep is to be made, according the method of the present invention, an optional step is to change to topology prior to sweeping.

Description

CROSS-REFERENCE TO RELATED APPLICATIONS[0001]The present application is related to and claims the benefit of convention priority from U.S. Provisional Patent Application No. 60 / 404,766 entitled “METHOD OF INTERACTIVE VISUALIZATION AND PARAMETER SELECTION FOR ENGINEERING DESIGN” filed on Aug. 21, 2002, the entirety of which is hereby incorporated by reference.FIELD OF THE INVENTION[0002]The present invention relates to engineering design and particularly to electronic design automation (EDA) including analog and mixed-signal circuits design.BACKGROUND OF THE INVENTION[0003]One important area of engineering design is circuit design. In circuit design, there are two main types of circuits: digital and analog circuits. The general aim of analog circuit design is to design an analog circuit with particular performance characteristics. In semiconductor analog circuit design, design of an analog circuit or subcircuit has two main steps: “front end design”—design of a circuit topology inclu...

Claims


Application Information

Patent Timeline
IPC IPC(8): G06F17/50
CPCG06F17/5063G06F30/36
Inventor SHERSTYUK, NICKBROTZEL, DEAN
Owner SYNOPSYS INC
Why Eureka
Try Eureka