Method, computer program, and system for intrinsic timescale decomposition, filtering, and automated analysis of signals of arbitrary origin or timescale

a timescale decomposition and timescale technology, applied in the field of system for analyzing signals and data, to achieve the effect of eliminating the need for sifting, precise time-frequency-energy localization, and absence of significant end effects

Active Publication Date: 2006-05-30
FLINT HILLS SCI L L C
View PDF4 Cites 73 Cited by
  • Summary
  • Abstract
  • Description
  • Claims
  • Application Information

AI Technical Summary

Benefits of technology

[0043]The principal objects and advantages of the present invention include: providing a system and method for analyzing non-stationary and/or non-linear signals; providing such a system and method that can operate in real-time due to its computational simplicity, recursive nature, elimination of need for sifting, and absence of significant end effects; providing such a system and method that adapts to any timescale and uses complete signal information, including all critical points such as inflection points and zero crossings; providing such a system and method that can extract weak signals embedded in stronger signals; providing such a system and method that provides precise time-frequency-energy localization, either simultaneously via the Hilbert transform or novel methods for instantaneous phase and instantaneous frequency computation not requiring use of this transform, on other timescales, such as the inter-extrema timescale or the inter-critical point timescale for example; providing such a system and method having the ability to interpolate adjacent critical points using the signal itself; providing such a system that is well-behaved even if the data is unevenly sampled or is discontinuous; providing such a system that may be applied to analysis of multidimensional signals or data such as images or surfaces; providing such a system and method that has the ability to preserve intact phase and morphology characteristics of the signal; providing such a system and method that can extract proper rotation components in one step; providing such a system and method wherein all extracted components are guaranteed to be “proper rotations” with all strictly positive local maxima and all strictly negative local minima; providing such a

Problems solved by technology

In many practical applications, the raw data have characteristics that change over time, commonly referred to as being non-stationary and, additionally, very often result from non-linear processes.
Unfortunately, the majority of existing methods for analyzing data are designed to treat stationary, linear data.
Another common and serious problem of data analysis is the existence of noise and / or non-stationary trend.
However, these filters are Fourier based and, as such, typically result in the introduction of spurious harmonics in non-stationary data.
Therefore, Fourier-based filters have limited utility and practical value for use with non-stationary and / or non-linear data.
The application of these methods to analysis of non-stationary, non-linear data can give misleading results.
Therefore, Fourier analysis needs many additional harmonic components in order to simulate non-stationary data, which are not uniform globally.
Unfortunately, many of the components, that are added in order to simulate the non-stationary nature of the data in the time domain, divert energy to a much wider frequency domain.
Constrained by energy conservation, the spurious harmonics that are added and the wide frequency spectrum required to simulate the non-linearity cannot faithfully represent the true energy density in the resulting frequency space.
As explained above, both non-stationarity and non-linearity can induce spurious harmonic components that cause energy spreading.
The resulting consequence is a misleading or incorrect time-frequency distribution of signal energy for non-linear and / or non-stationary data.
This assumption is not valid for most non-stationary data.
Furthermore, there are practical difficulties in applying the method.
Unfortunately, the frequency resolution worsens as window size decreases.
Although the conflict in these requirements can be mitigated by different techniques, it renders the applicability of Fourier analysis to non-linear, non-stationary data of limited use.
This approach allows wavelet analysis to detect changes that occur rapidly, i.e., those on a small time scale, with good temporal resolution but poor frequency resolution, or slowly, i.e., those on a large time scale, with good frequency resolution but poor temporal resolution.
Unfortunately, the finite length of the basic wavelet function results in energy leakage across different levels of resolution in a multi-resolution analysis, which causes quantitative applications of the time-frequency-energy distribution to be more difficult.
In many applications, the interpretation of such a result would be difficult if not impossible.
Another difficulty with wavelet analysis is that it is not adaptive.
Unfortunately, these developments in wavelet analysis continue to suffer from the representation of the signal information in terms of a pre-selected basis of functions that often has little or nothing to do with the dynamics and other characteristics of the input signals.
The difficulty with this method is the severe cross terms indicated by the existence of negative power for some frequency ranges.
Although this approach can be applied to a wide variety of problems, applications to nonstationary or nonlinear data are extremely complicated.
Further, such applications again suffer from the same limitation of the other prior art methods described above in that the bases for representation of information are not derived from the data itself.
The problem with this approach, which severely limits its applicability, is due to the lack of means for adequately defining the basis.
To date, no systematic method of constructing such a basis exists.
Therefore, it is impossible to construct an evolutionary spectrum from a given set of data.
Consequently, evolutionary spectrum analysis has very little useful application, if any.
In addition, any single component of the non-unique decomposition, even if the basis is orthogonal, does not usually provide any physical meaning.
Unfortunately, since EOF components from a non-linear and non-stationary data set are not linear and stationary, use of Fourier spectral analysis generated by SSA is flawed.
Consequently, SSA is not a genuine improvement of EOF.
Although adaptive in nature, the EOF and SSA methods have limited applicability.
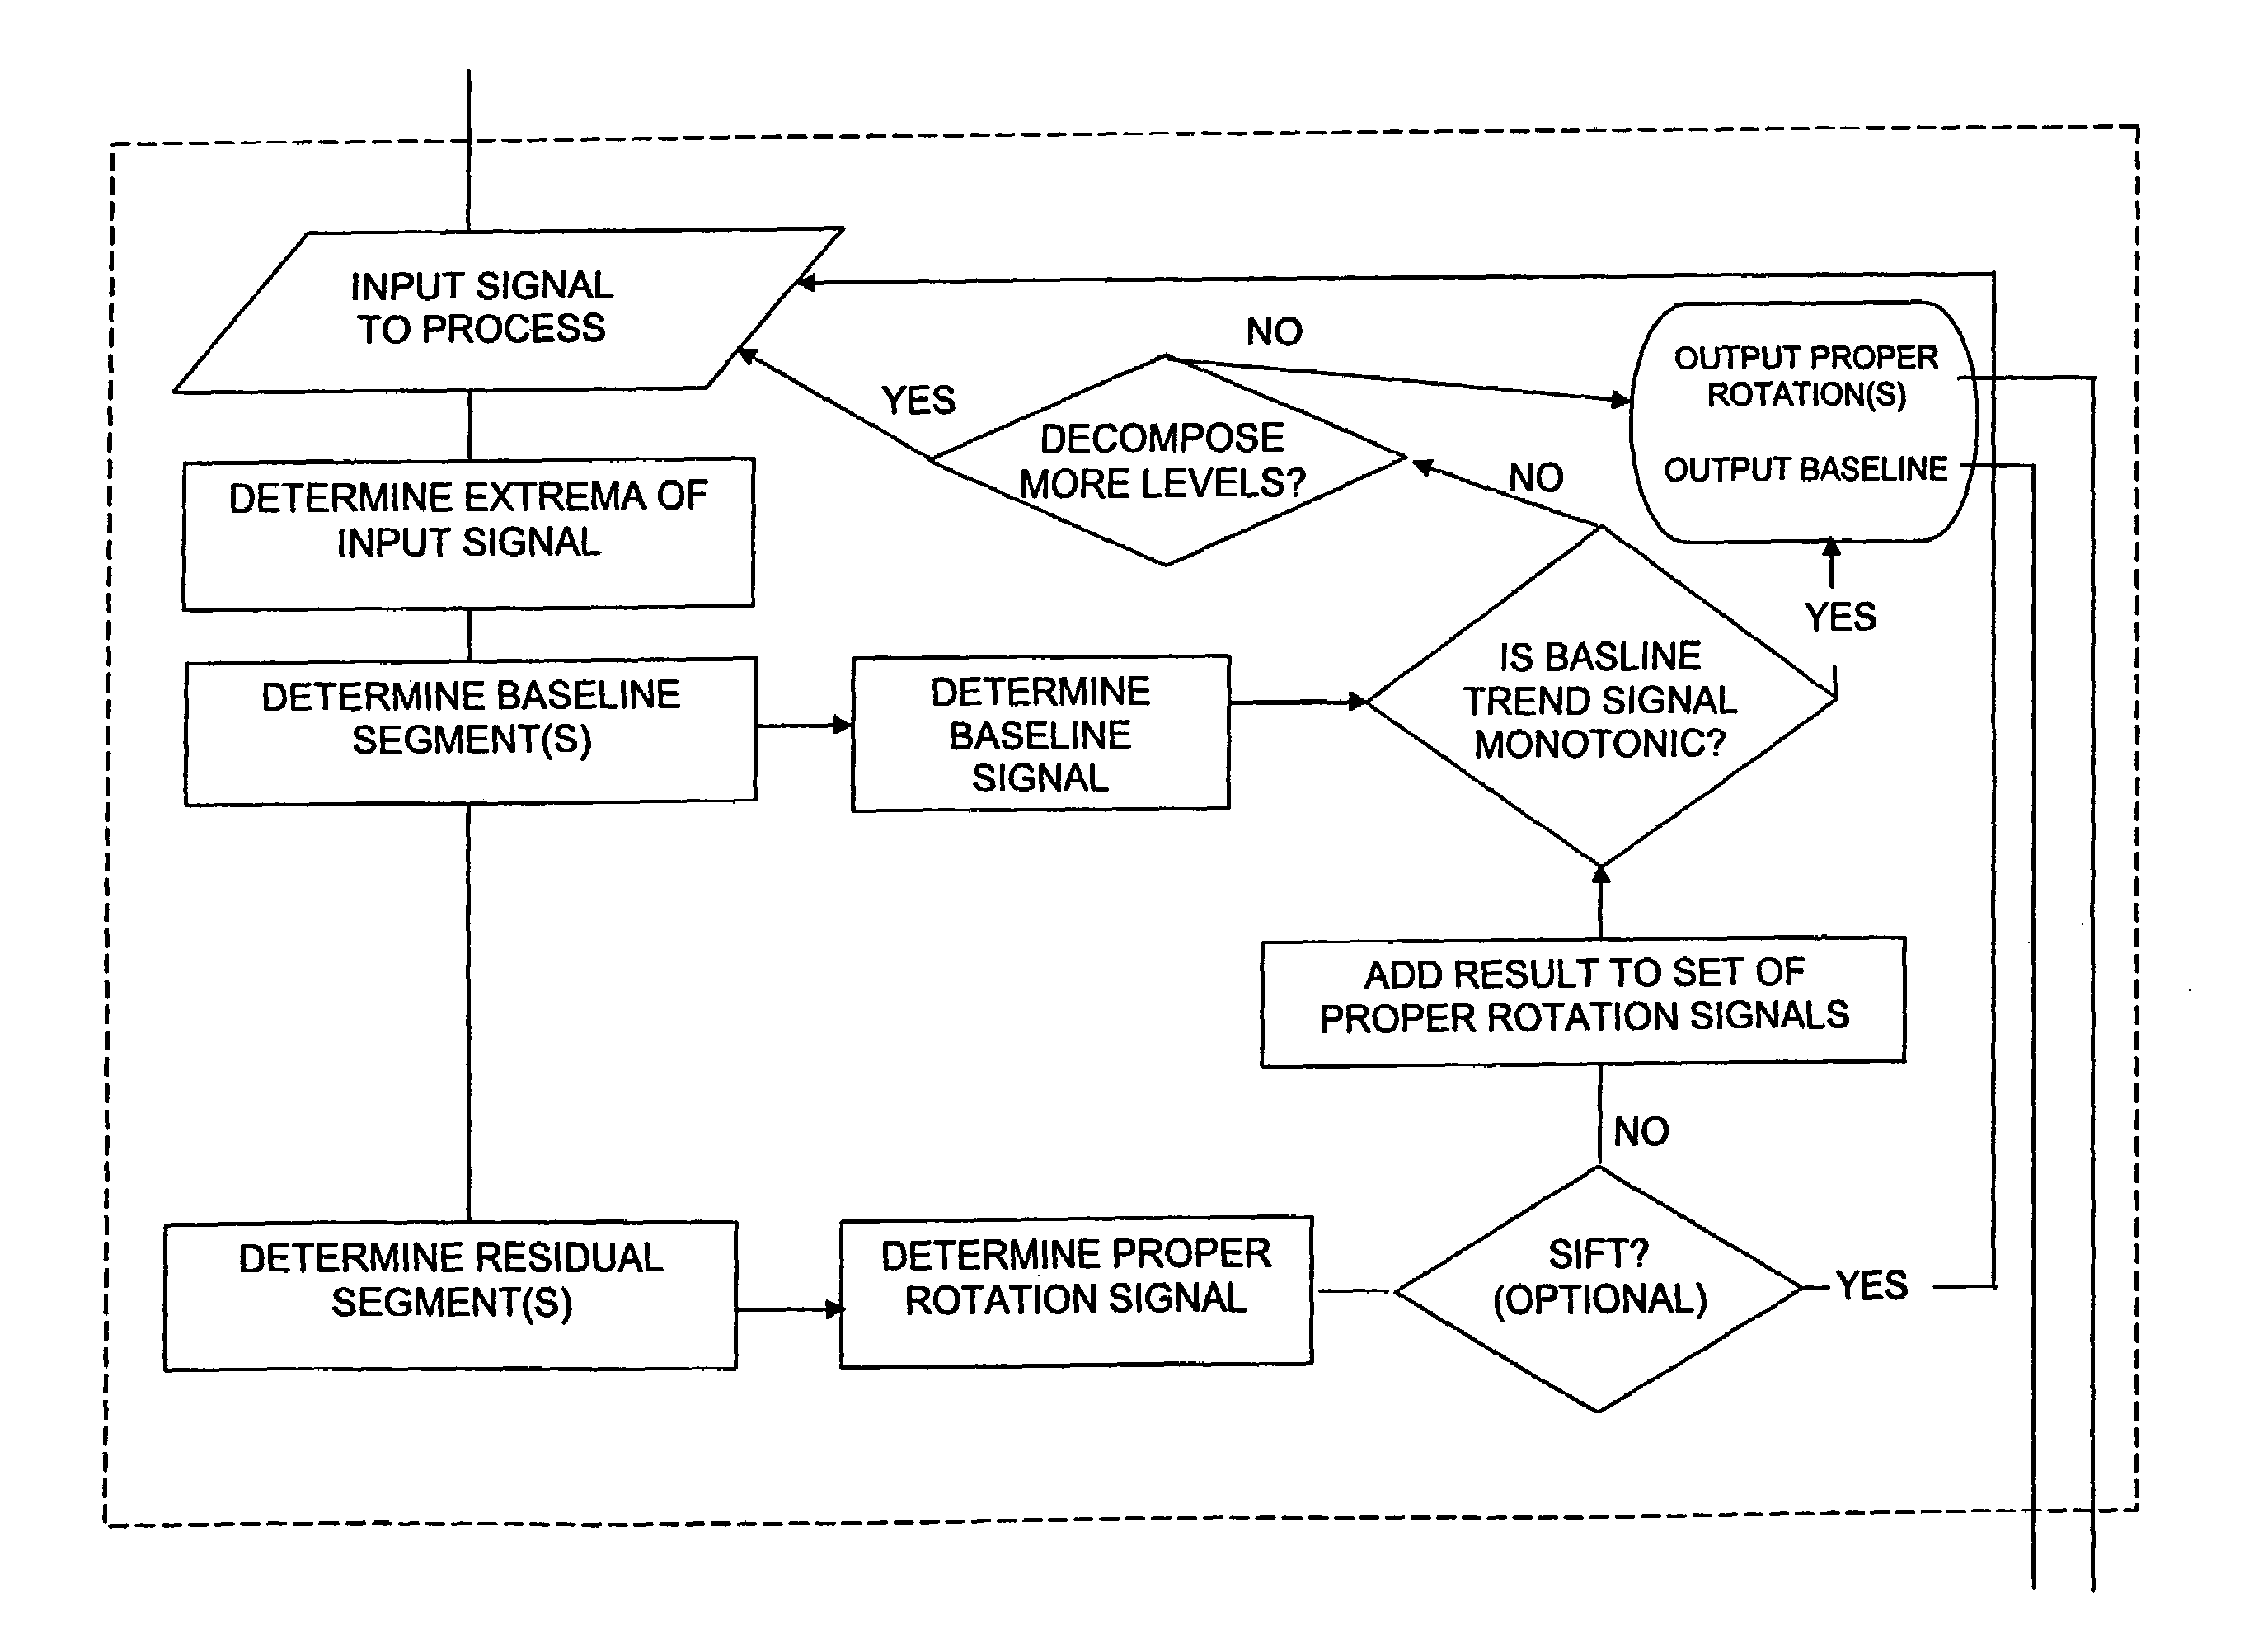
This does not necessarily happen with one step of EMD, and thus a laborious, iterative “sifting” process is applied to the signal baseline and is terminated when a set of “stopping criteria” are satisfied, such as when the resulting IMF either becomes a proper rotation or when some other criteria are reached (e.g., a predetermined number of iterations exhausted) without obtaining a proper rotation.
Unfortunately, these goals are often conflicting for non-stationary signals wherein riding waves may be isolated and / or are highly variable in amplitude.
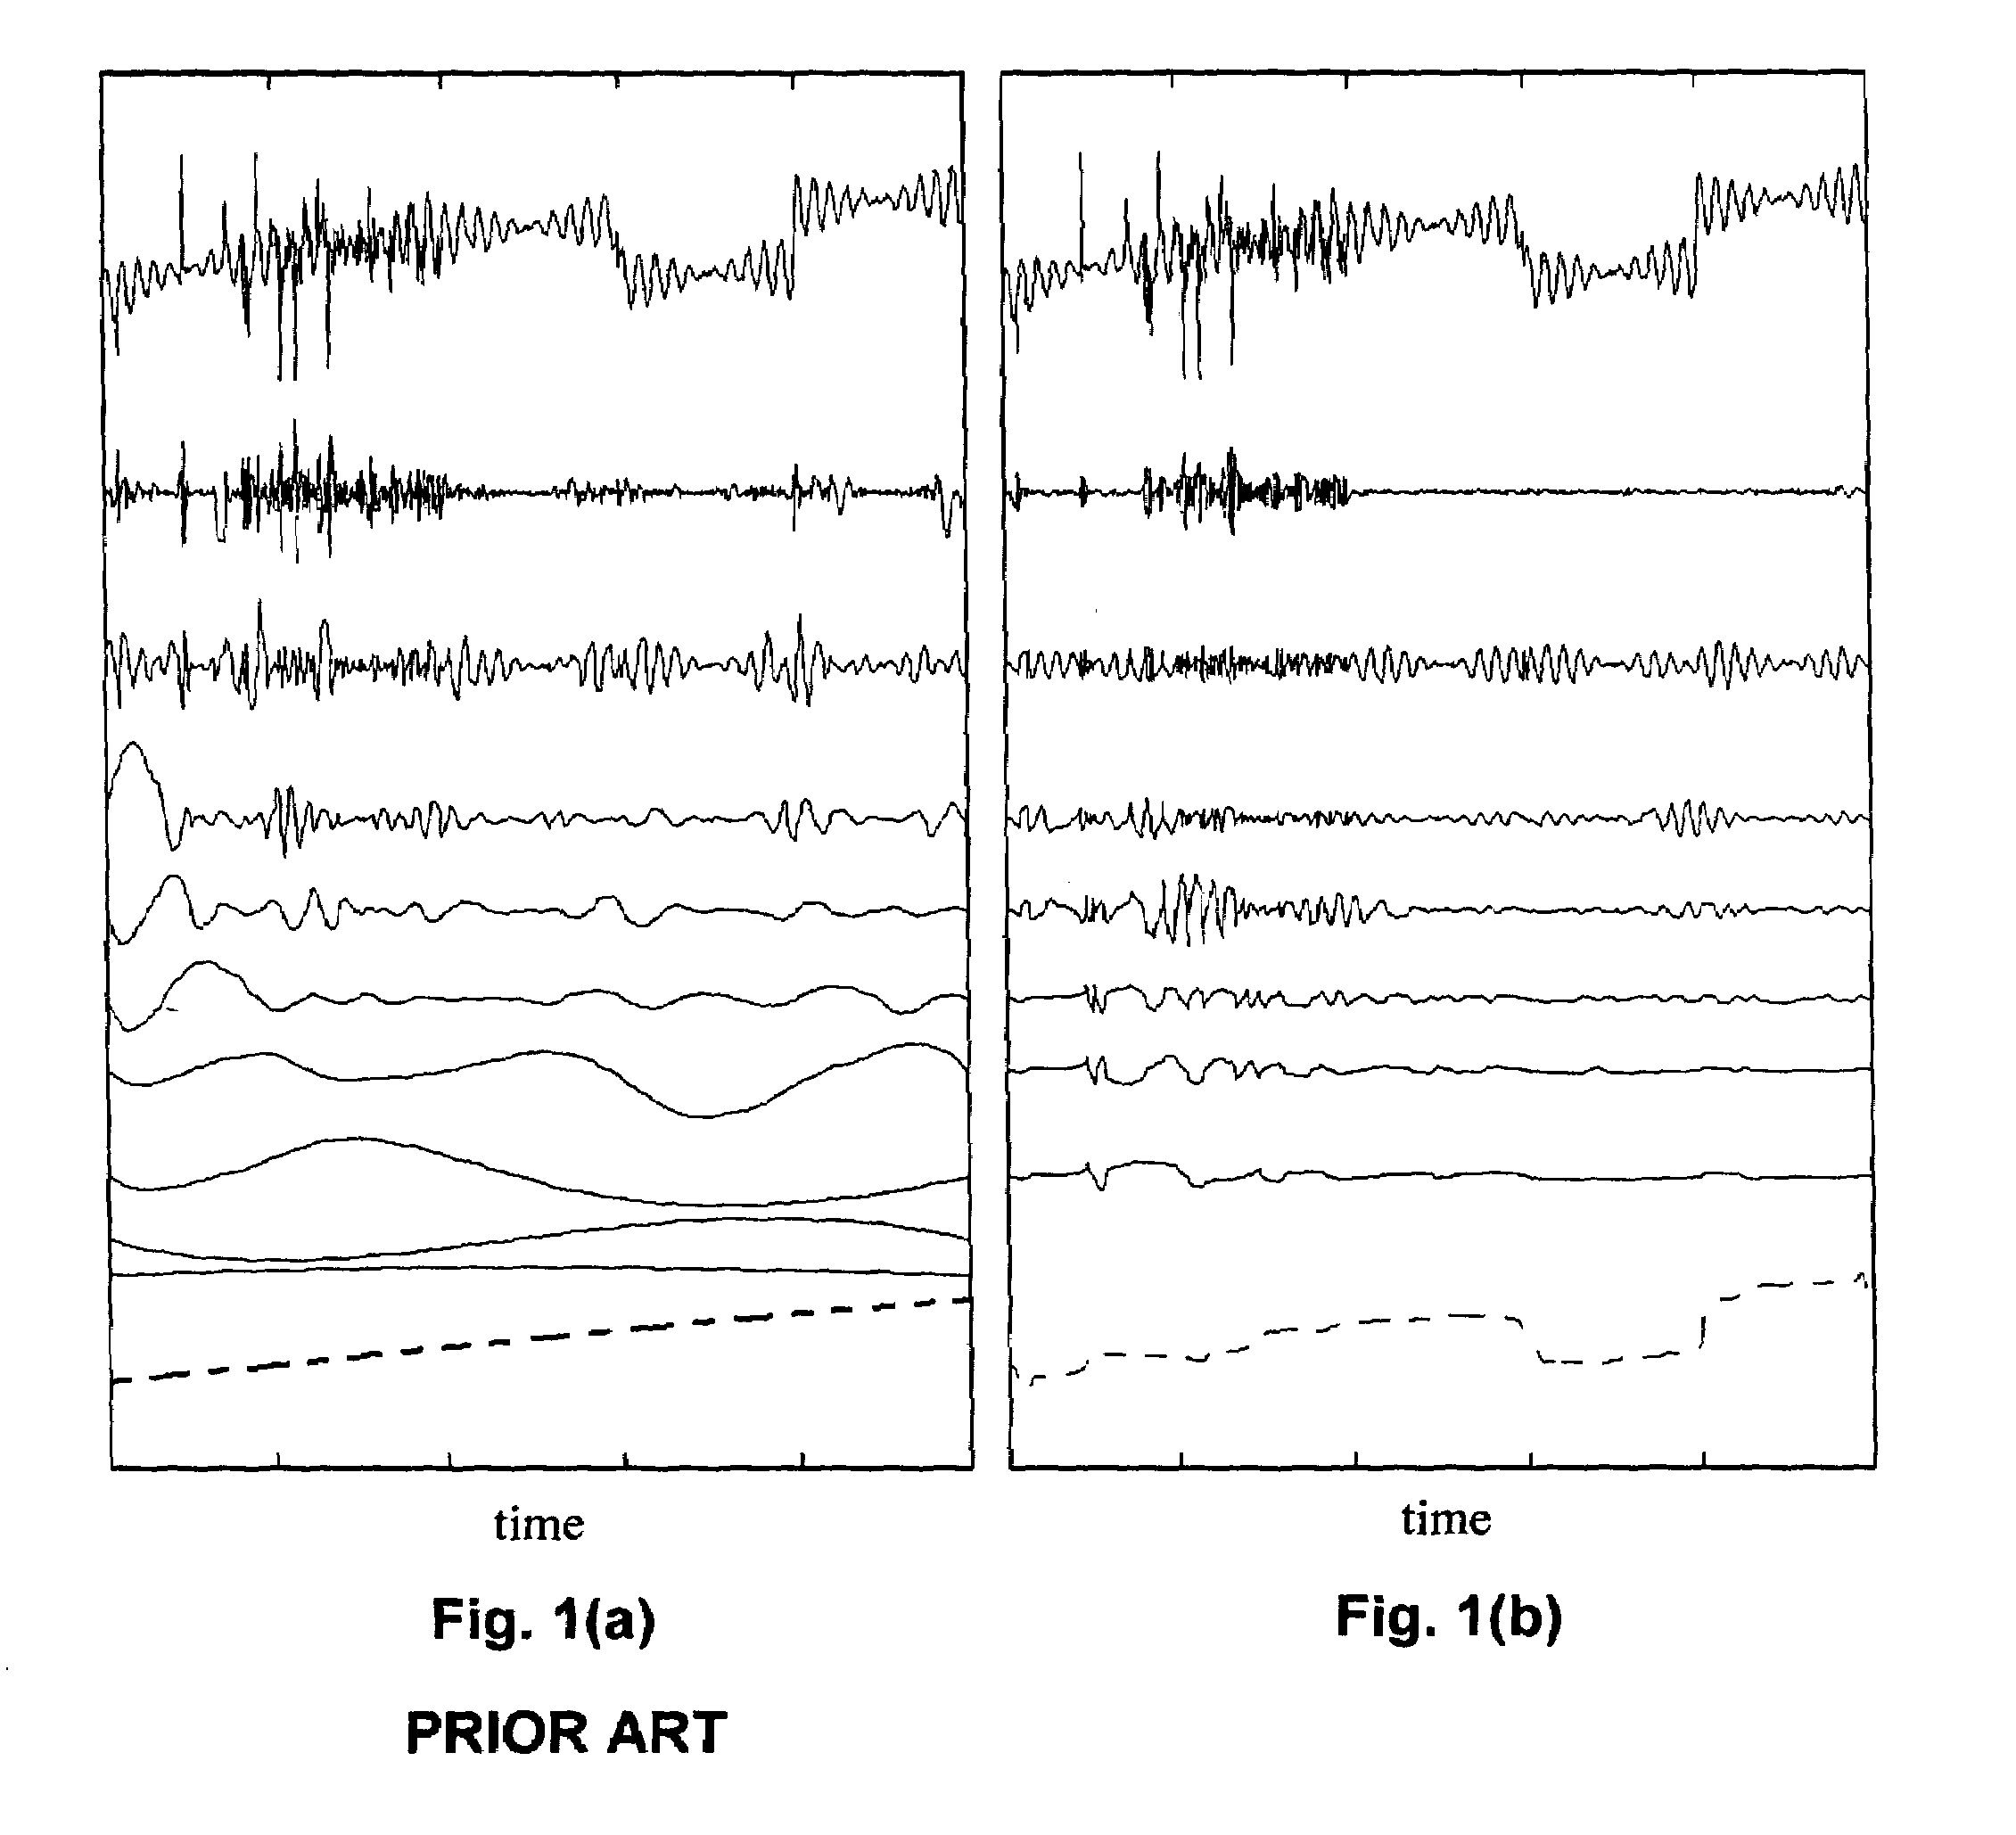
As a result, the sifting process must be applied cautiously as it can potentially obliterate the physically meaningful amplitude fluctuations of the original signal.
However, the EMD method suffers from a number of shortcomings that lead to inaccuracies in depiction of signal dynamics and misleading results in subsequent signal analysis, as follows:(a) The construction of the IMF baseline as the mean of the cubic spline envelopes of the signal suffers from several limitations, including the time scale being defined only by the local extrema of the original signal, ignoring the locations of the rest of the critical points, such as inflection points and zero crossings, which are not preserved by the sifting process.(b) The EMD transformation is window-based; the sifting procedure and other processing requires an entire window of data to be repeatedly processed.
On average, this causes a delay in obtaining the resulting information of at least half the window length plus the average computational time for a window of data.
As a result, an insurmountable problem is created for the EMD in real-time / online applications.
However, short windows have less accurate results due to boundary or edge effects, and are incapable of resolving frequency information on a time scale longer than the window length itself.(c) The EMD method is computationally expensive, and also subject to uncertain computational expenses.
Therefore, the envelope-mean method of the extraction of the baseline does not work well in certain cases, such as when there are gaps in the data or data are unevenly sampled, for example.
Although this problem can be mitigated by using more sophisticated spline methods, such as the taut spline, such improvements are marginal.
Moreover, splines are not necessarily well suited to approximate long timescale trends in real data.(e) The EMD method does not accurately preserve precise temporal information in the input signal.
Also, the EMD method, being exclusively determined by extrema, is deficient in its ability to extract weak signals embedded in stronger signals.(f) Since the cubic splines can have wide swings at the ends, the envelope-mean method of the EMD method is particularly unsuitable for real-time applications or for applications utilizing a narrow window.
Moreover, proper rotations, which are not guaranteed by the EMD, are necessary for the existence of a meaningful, instantaneous frequency that is restrictive and local.(h) Primarily due to the sifting procedure, the EMD method causes (i) a smearing of signal energy information across different decomposition levels, and (ii) an intra-level smoothing of energy and frequency information that may not reflect the characteristics of the signal being decomposed or analyzed.
The potential negative effects of over-sifting include the obliteration of physically meaningful amplitude fluctuations in the original signal.
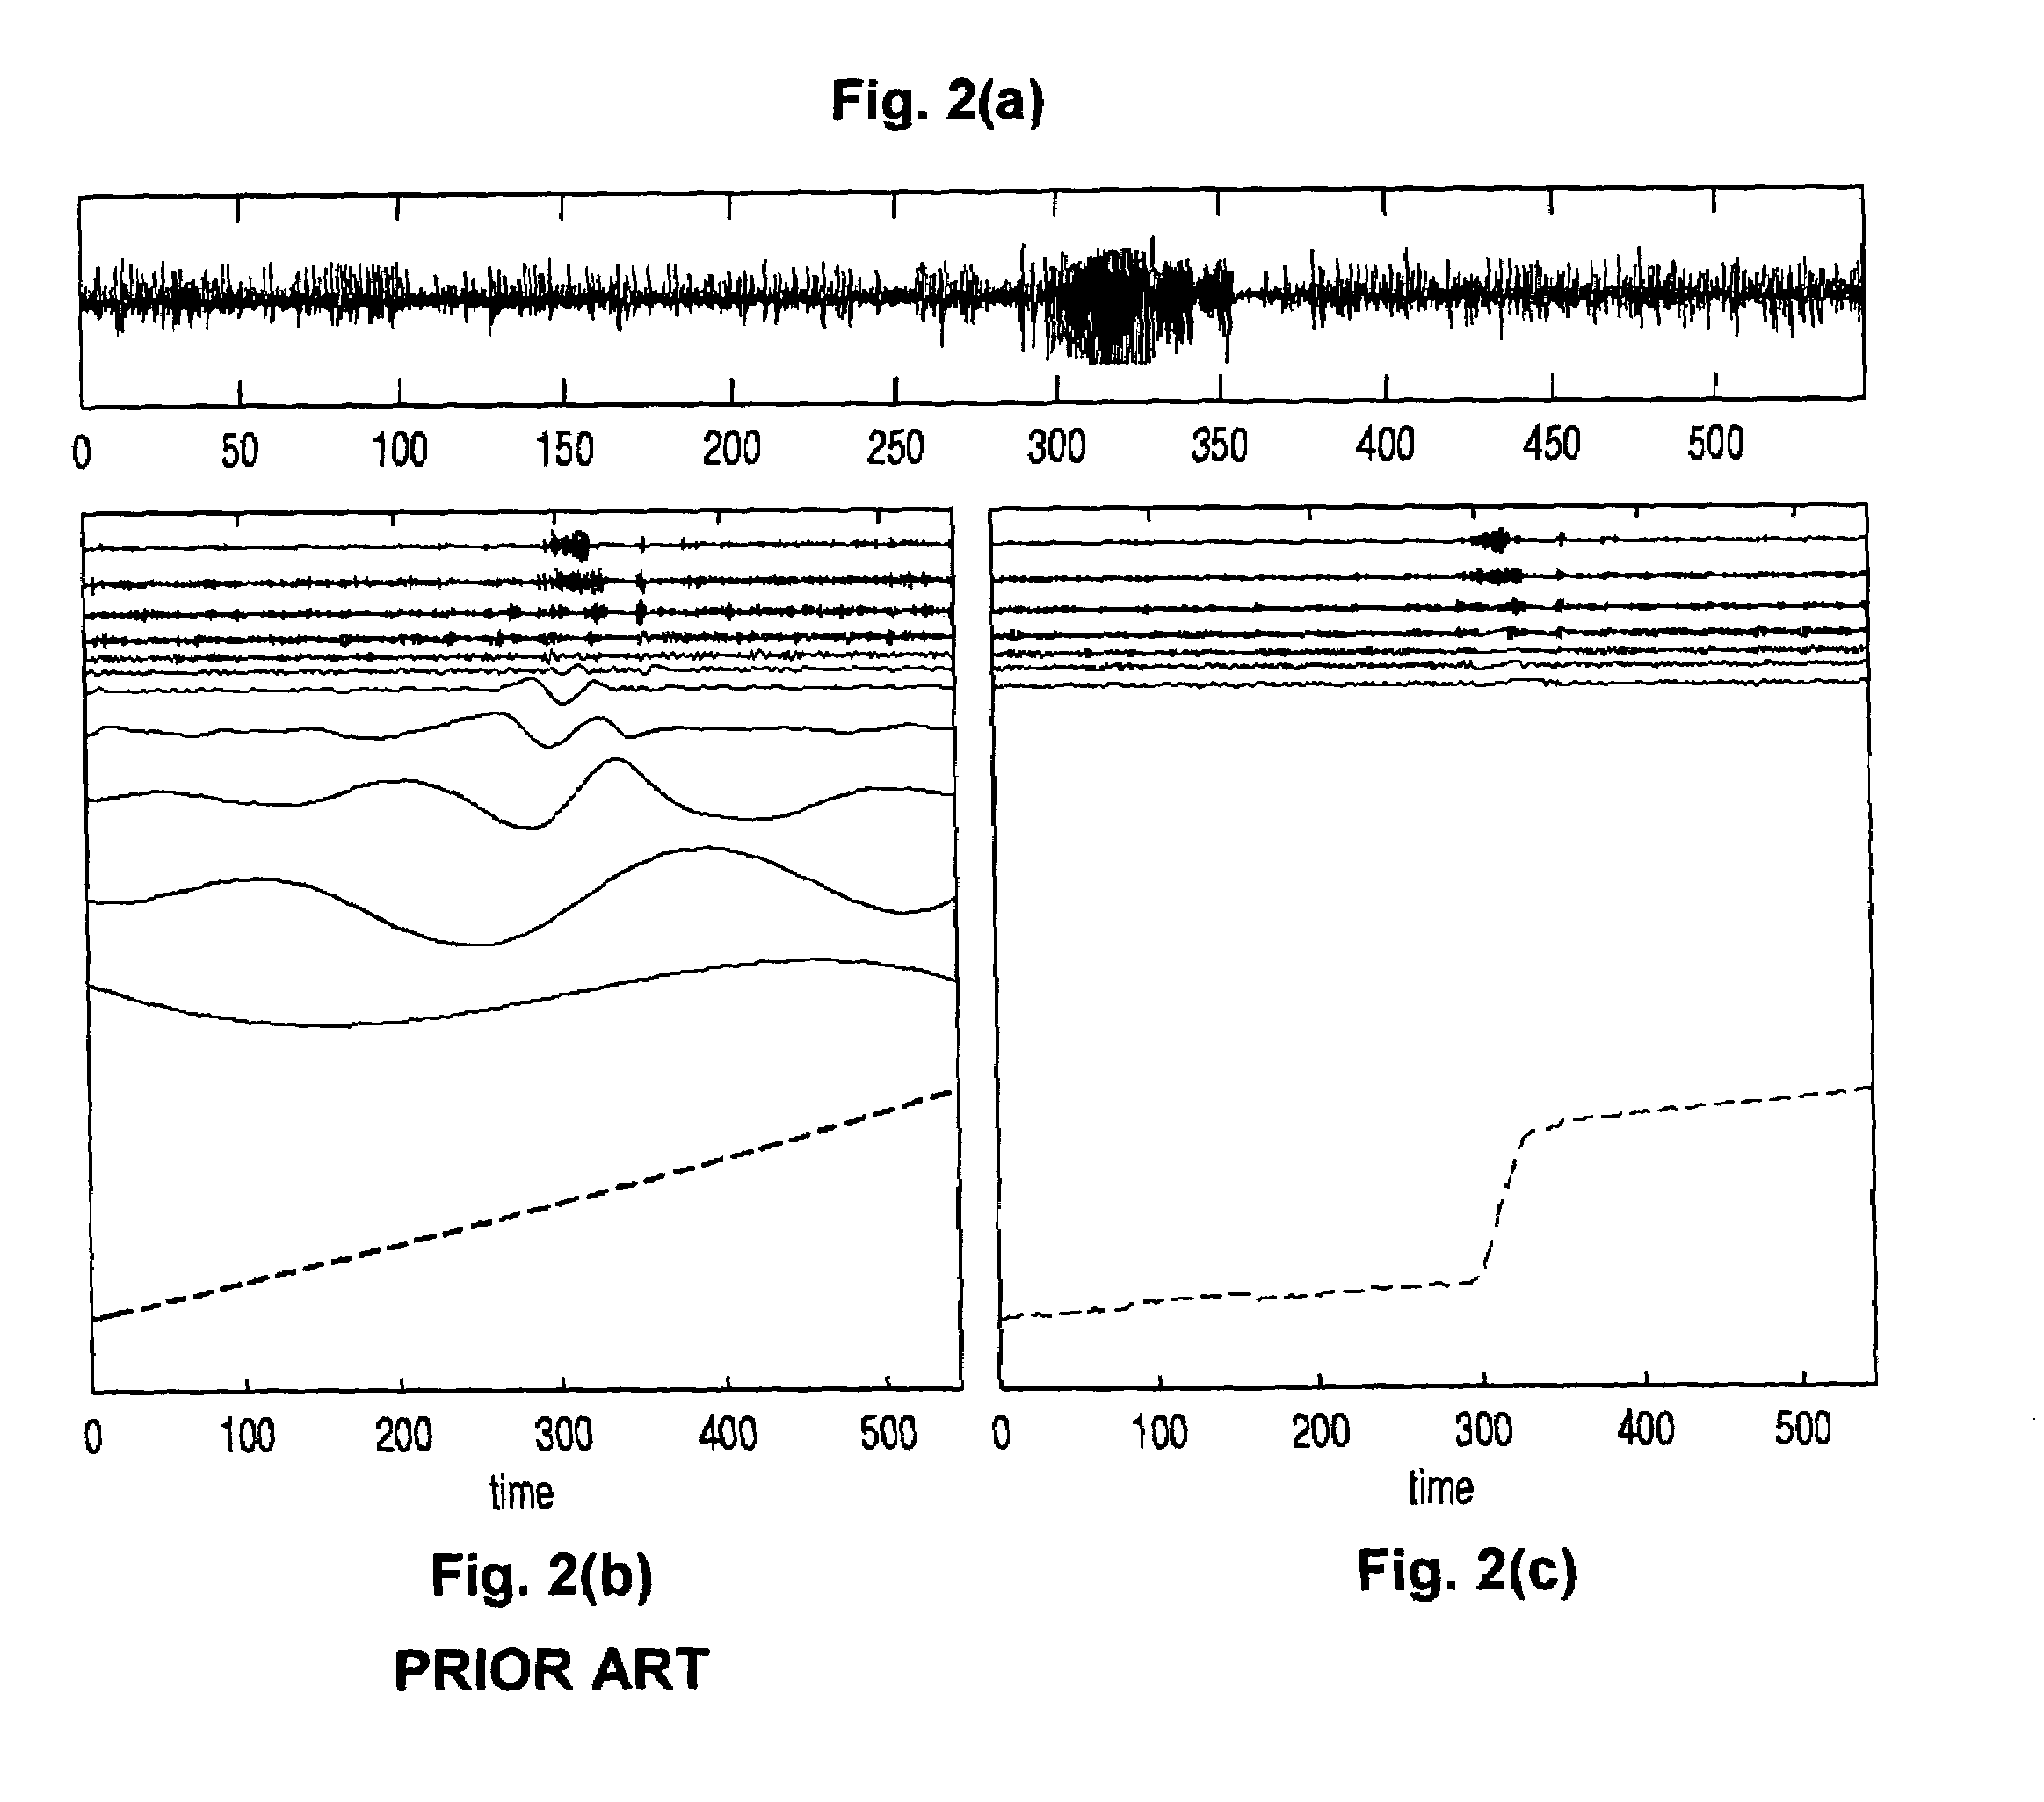
Also, the inter-level smearing of energy and limitation of decomposition in a window of data create inaccuracies in the EMD's representation of the underlying signal trend, especially if the signal trend is longer than a single window.(i) The EMD method cannot guarantee that the IMF components will be “proper rotations,” even with the sifting reiterations.
Often, in practice, they are not.(j) The EMD method is not well behaved if the data is unevenly sampled or if it is discontinuous, and, therefore, may not preserve intact phase and morphology characteristics of the signal.

Method used


Image

  • Method, computer program, and system for intrinsic timescale decomposition, filtering, and automated analysis of signals of arbitrary origin or timescale
  • Method, computer program, and system for intrinsic timescale decomposition, filtering, and automated analysis of signals of arbitrary origin or timescale
  • Method, computer program, and system for intrinsic timescale decomposition, filtering, and automated analysis of signals of arbitrary origin or timescale

Examples


first embodiment

[0107]Application of the ITD to an input signal results in a decomposition that consists of a set of proper rotation components of successively lower relative frequencies, along with a monotonic signal trend. The proper rotations are ideally suited for subsequent analysis to determine the time-frequency-energy (“TFE”) distribution of the original signal. This can be accomplished, e.g., by using the Hilbert transform if TFE information is sought at every data point (i.e., with temporal precision equal to the signal sampling rate). However, the present invention also includes methods for instantaneous phase angle and instantaneous frequency computation that do not require use of the Hilbert transform. These methods are “wave-based,” i.e., they define the instantaneous frequency in a piece-wise manner, each piece corresponding to the time interval between successive upcrossing of a proper rotation and using only information about the single wave of the proper rotation occurring during ...

second embodiment

[0110]the method for instantaneous phase angle computation is similar to the first, in that it is based on the progression of the proper rotation through each successive full wave, but is designed to provide an even more computationally efficient alternative. In this embodiment, the phase angle is computed for each wave of the signal as follows:

[0111]θ⁡(t)={(x⁡(t)A1)⁢π2t∈[t1,t2)(x⁡(t)A1)⁢π2+(1-x⁡(t)A1)⁢πt∈[t2,t3)(-x⁡(t)A2)⁢3⁢⁢π2+(1+x⁡(t)A2)⁢πt∈[t3,t4)(-x⁡(t)A2)⁢3⁢⁢π2+(1+x⁡(t)A2)⁢2⁢⁢πt∈[t4,t5)

This approach obtains the instantaneous phase angle via linear interpolation of the signal value between zero and its value at an extrema. Phase angles that are computed using this second method may deviate more significantly from those obtained via the Hilbert transform than those derived from the first embodiment. However, it will be appreciated that either embodiment may be more useful than the other (or Hilbert transform-based analysis) for certain applications, such as measuring certain typ...


PUM


Abstract

A method and system for intrinsic timescale decomposition, filtering, and automated analysis of signals of arbitrary origin or timescale including receiving an input signal, determining a baseline segment and a monotonic residual segment with strictly negative minimum and strictly positive maximum between two successive extrema of the input signal, and producing a baseline output signal and a residual output signal. The method and system also includes determining at least one instantaneous frequency estimate from a proper rotation signal, determining a zero-crossing and a local extremum of the proper rotation signal, and applying interpolation thereto to determine an instantaneous frequency estimate thereof. The method and system further includes determining at least one instantaneous frequency estimate from a proper rotation signal, extracting an amplitude-normalized half wave therefrom and applying an arc sine function to the amplitude-normalized half wave to determine an instantaneous frequency estimate of the proper rotation signal.

Description

CROSS REFERENCE TO RELATED APPLICATIONS[0001]This application is based on Provisional Patent Application Ser. No. 60 / 418,141 of Mark Frei, filed Oct. 11, 2002.COMPUTER PROGRAM LISTING APPENDIX[0002]An appendix containing five computer files on compact disk is included in this application. The files, which are formated for an IBM PC / MS Windows-compatible computer system, are as follows:[0003]contents.txt  864 bytes;itd.m  964 bytes;itd_step.m1,528 bytes;itd_sift.m1,477 bytes;pangle.m2,881 bytes;Itd.cpp3,619 bytes;Itd.h1,742 bytes;ItdStep.cpp12,300 bytes; ItdStep.h6,180 bytes;itd_rec.cpp3,384 bytes;FhsBuffers.h4,275 bytes;These files were loaded on the non-rewritable CD-R disc on Oct. 7, 2003 and are incorporated herein by reference.BACKGROUND OF THE INVENTION[0004]1. Field of the Invention[0005]This invention relates generally to a system for analyzing signals and data and, more specifically but without limitation, to a system for analyzing non-linear and / or non-stationary signals an...

Claims


Application Information

Patent Timeline
IPC IPC(8): G06F17/00G01R29/02G06K9/00H04B15/00
CPCG06F17/14G06K9/00523G06K9/00503G05B23/0221G06F2218/02G06F2218/08
Inventor FREI, MARK G.OSORIO, IVAN
Owner FLINT HILLS SCI L L C
Why Eureka
Try Eureka