Cell viability detection using electrical measurements
a cell and electrical measurement technology, applied in the field of cell viability detection, can solve the problems of cumbersome optical inspection apparatus, inability to determine the effect of drugs or chemicals, and a certain period of time for the cell
- Summary
- Abstract
- Description
- Claims
- Application Information
AI Technical Summary
Benefits of technology
Problems solved by technology
Method used
Image
Examples
example 1
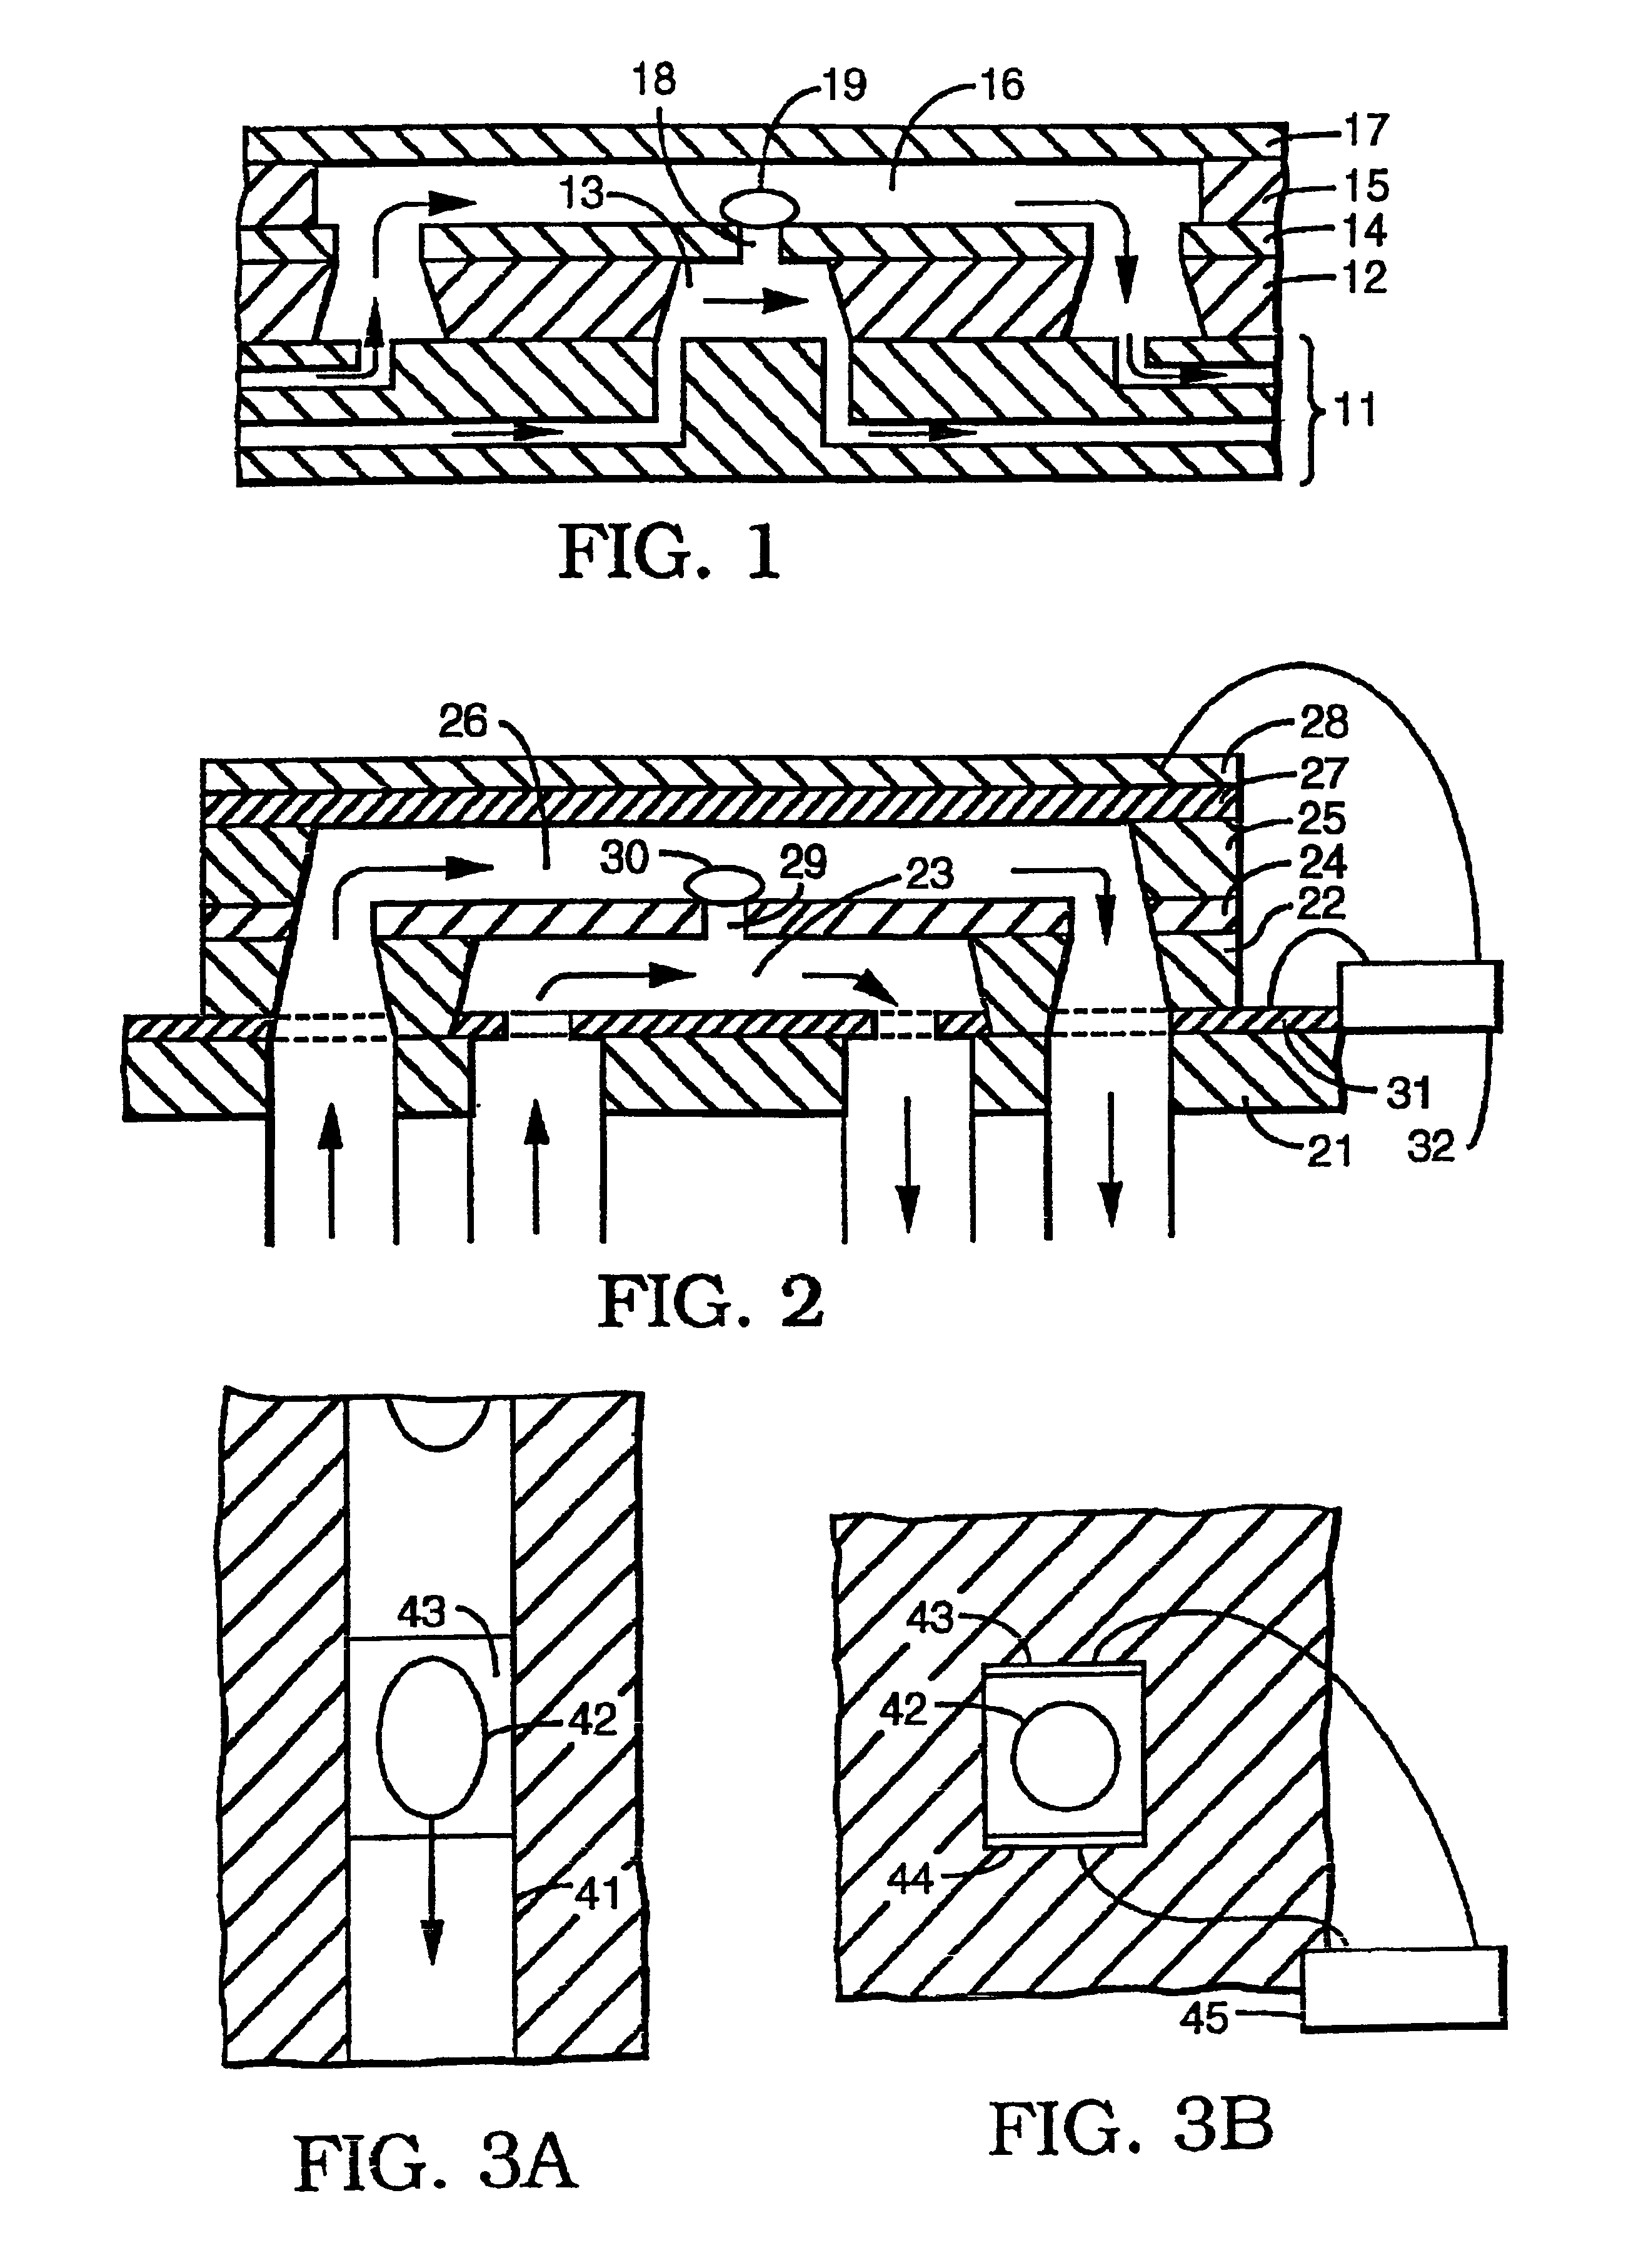
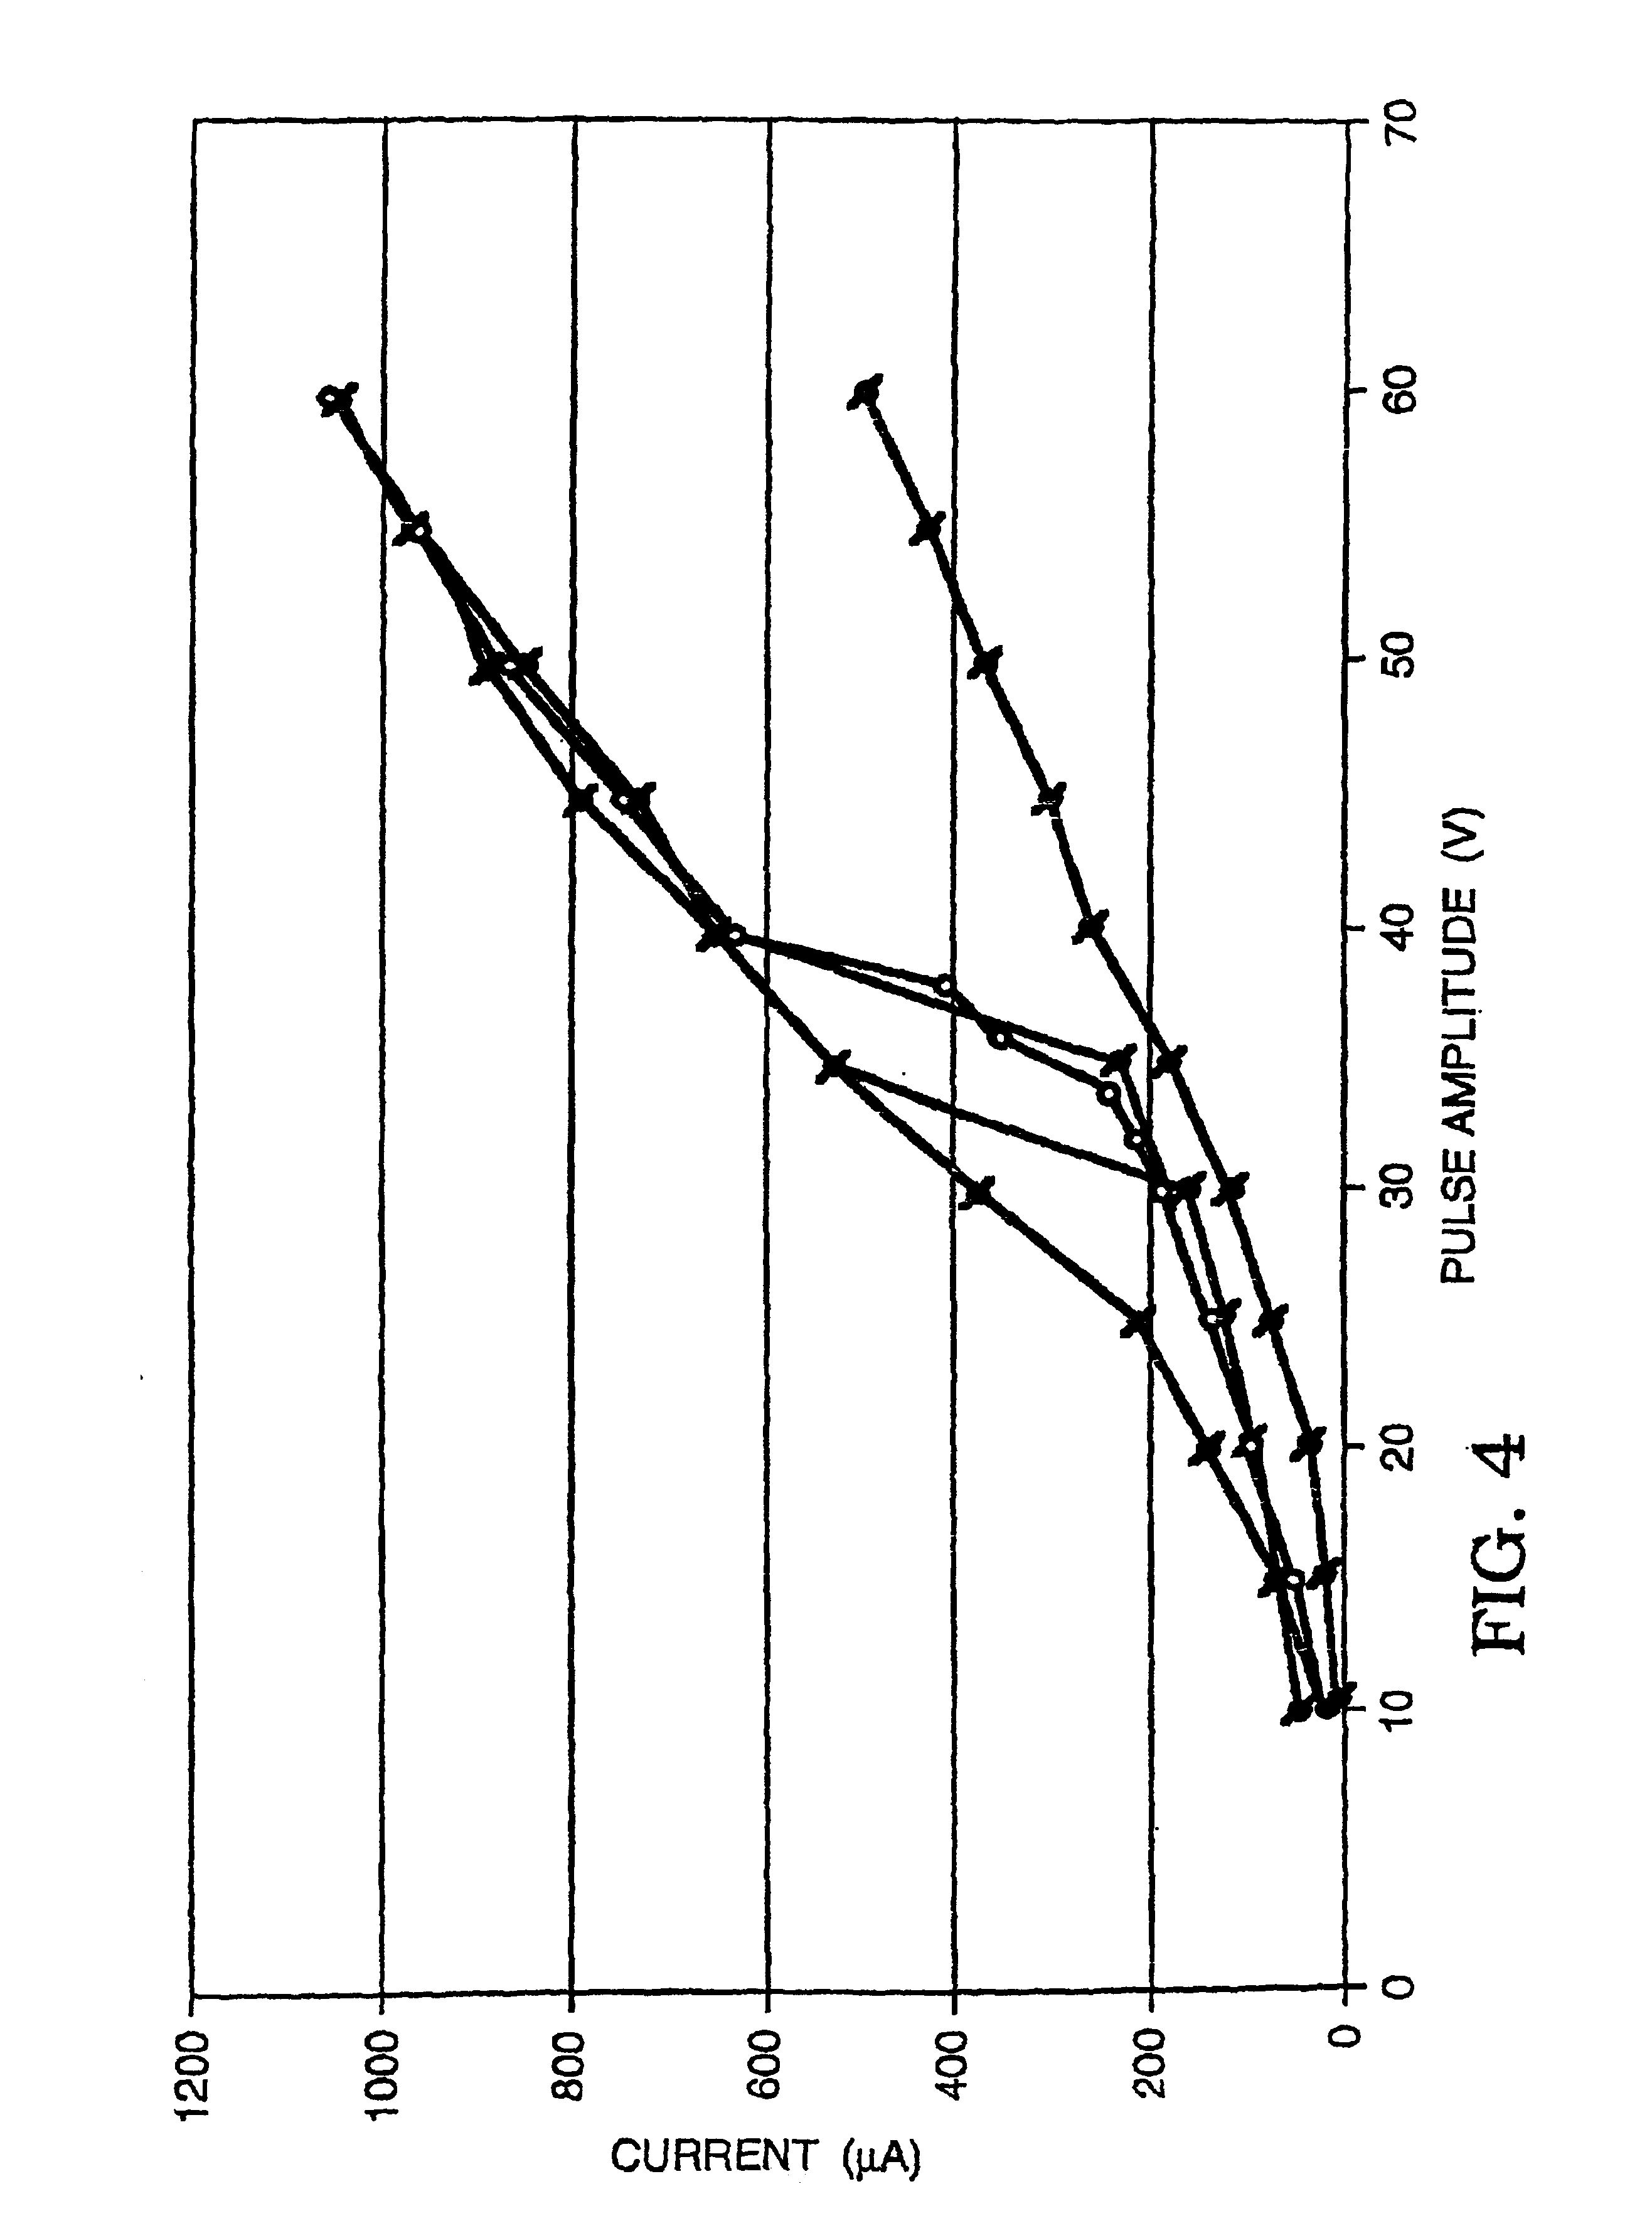
[0123]A series of experiments was performed using a microelectroporation system consisting of the microelectroporation device described above and shown in FIG. 2, combined with flow and pressure control units and pressure gauges for the liquids to be circulated through the upper and lower chambers, a variable DC power supply, a pulse generator and power amplifier for imposing voltage pulses across the device, a digital oscilloscope for monitoring the pulses, a fluorescent microscope, a CCD (charge coupled device) camera, and a computer with image processing and waveform processing software. Both chambers of the device were filled with physiological saline and cells were introduced into the upper chamber. Liquid motion in the top and bottom chambers was controlled by syringes. The pressure in the upper chamber was atmospheric while the pressure in the lower chamber was reduced below atmospheric by pulling on the barrel of the syringe connected to that chamber. The voltage was applied...
example 2
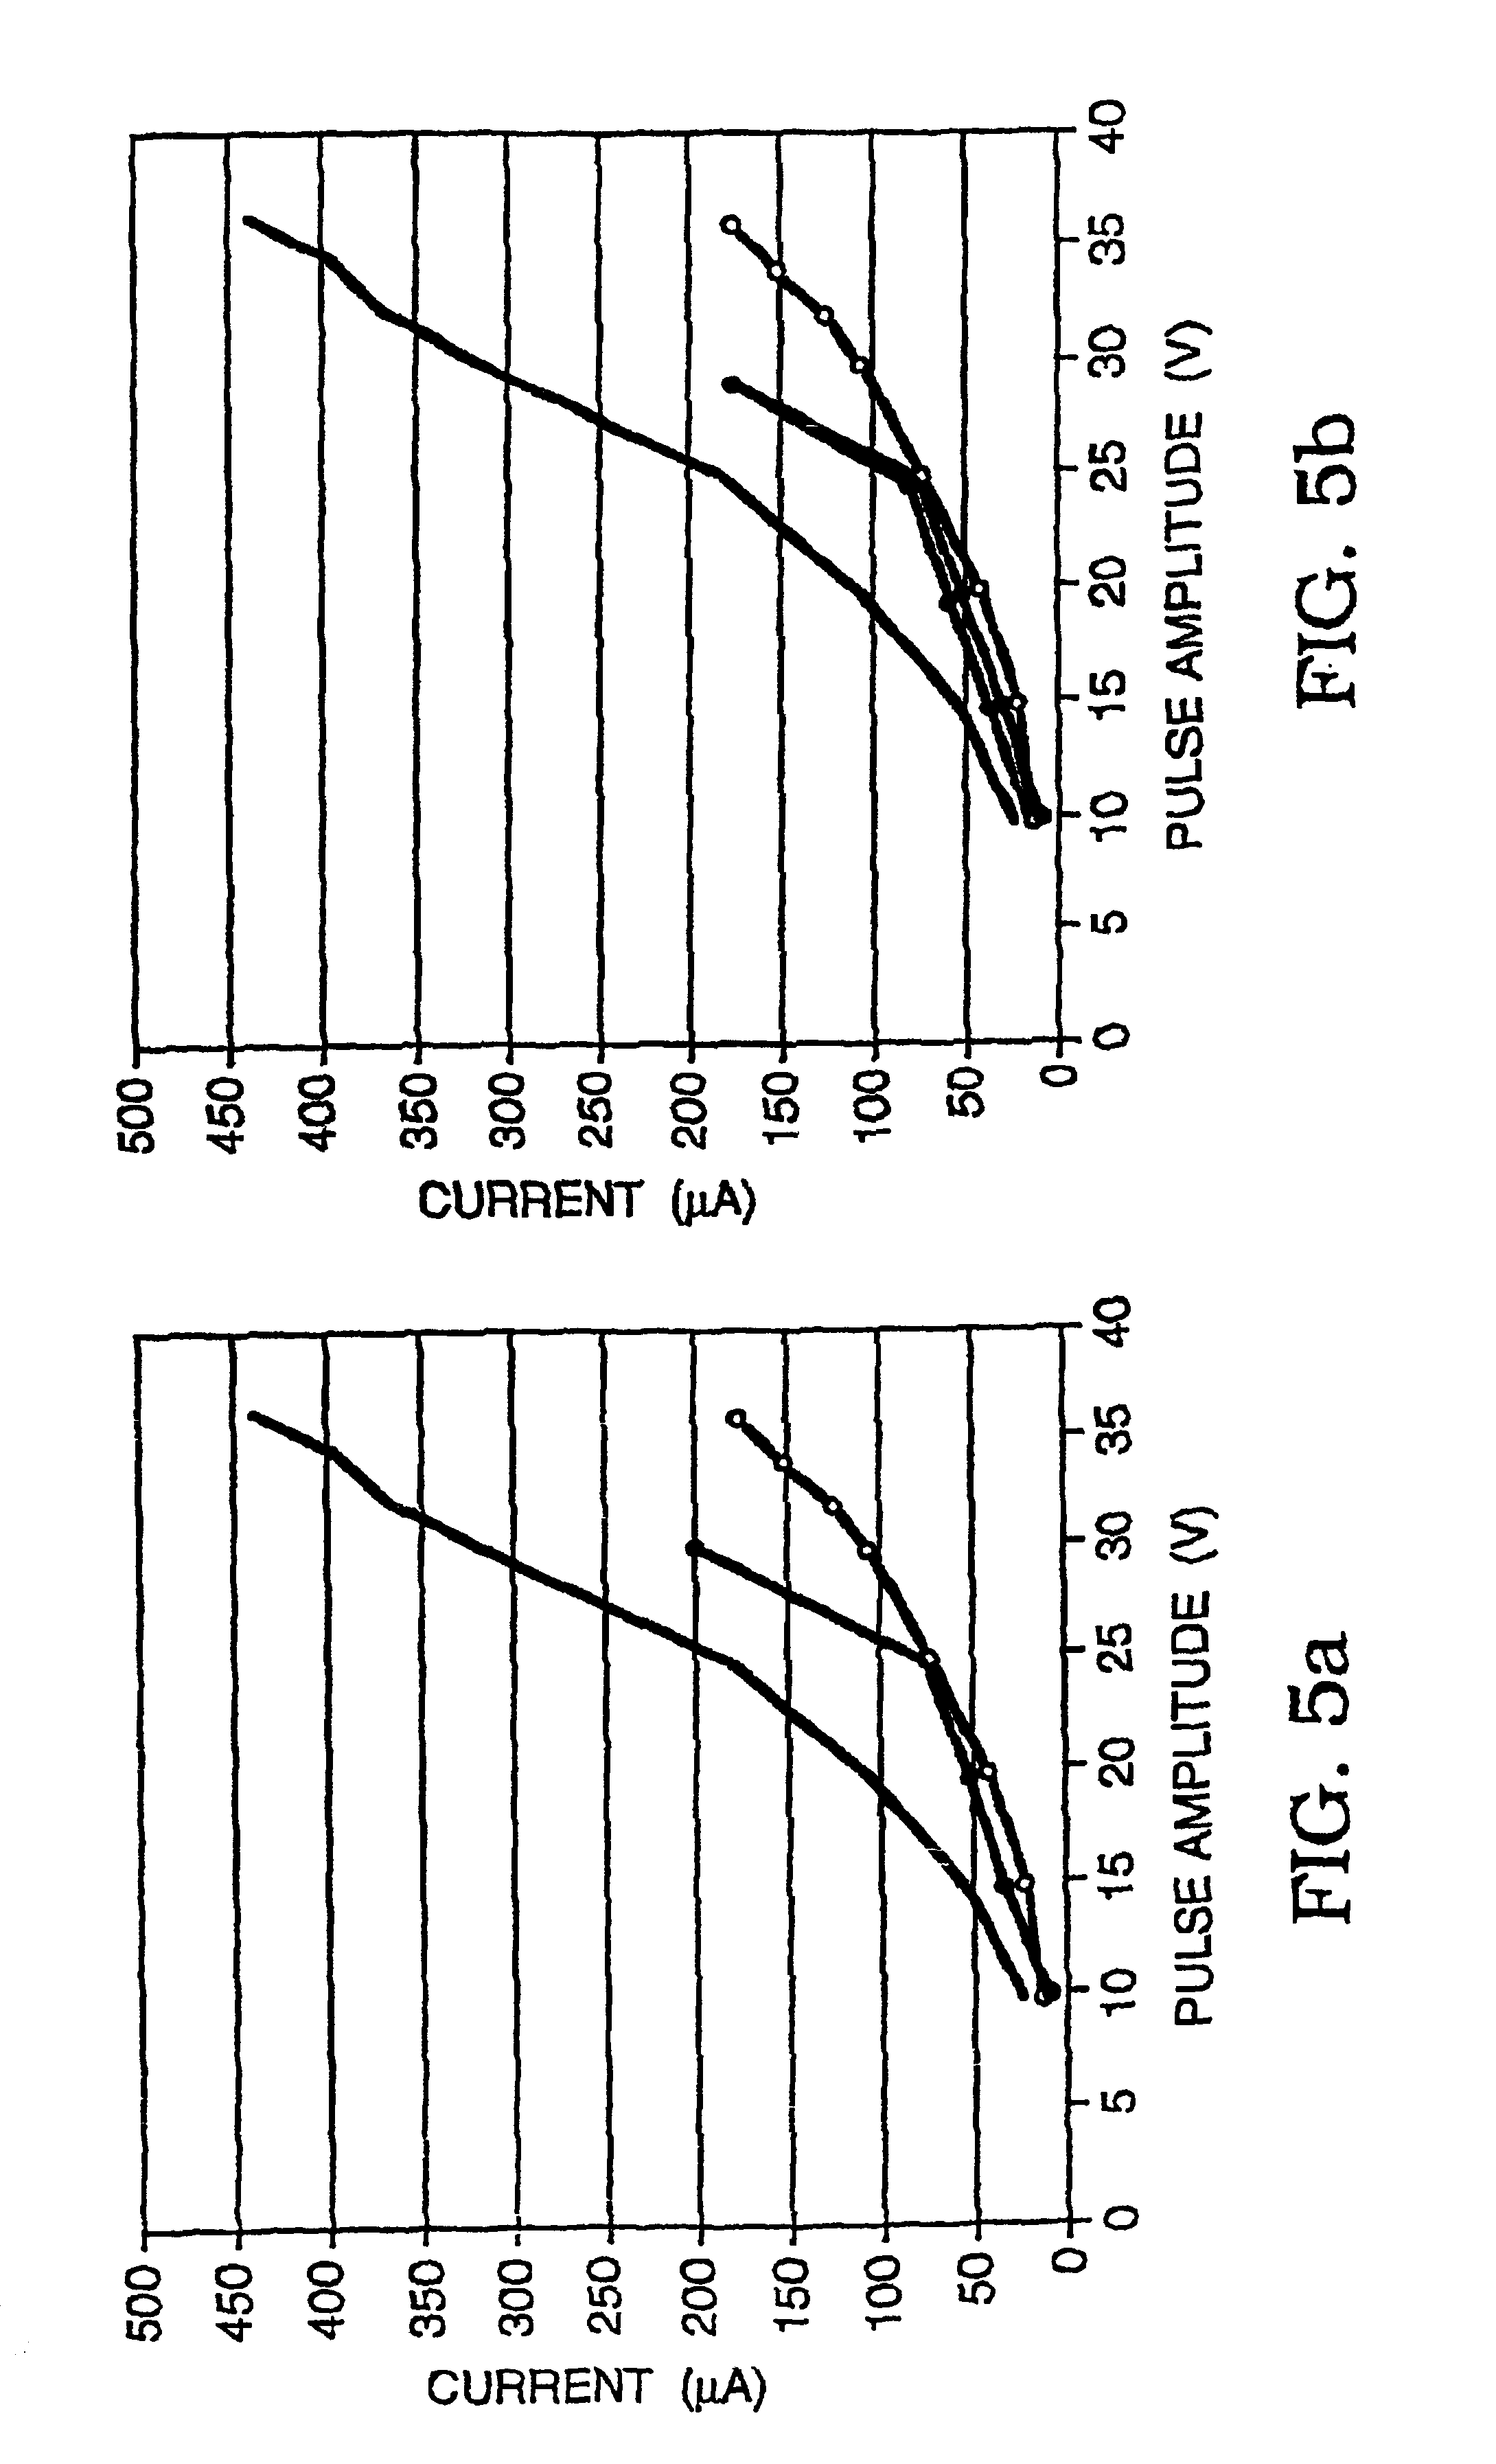
[0127]Using the same microelectroporation system used in Example 1, a series of tests were performed on rat hepatocytes (ATCC #CRL-1439), whose typical cell diameter was 20 microns, the microelectroporation apparatus having an opening that was 4 microns in diameter. Here as well, rectangular voltage pulses that were 60 milliseconds in duration were used, ranging in amplitude from 10V to 37.5V in increments of 5 V in the portion from 10V to 30V and in increments of 2.5V in the portion from 30V to 37.5V. The experiments were performed in some cases only by increasing the amplitudes and in others by first increasing, then decreasing the amplitudes to evaluate reversibility. The results are plotted in the graphs shown in FIGS. 5a, 5b, 5c, and 5d. In each case, the upper curve (data points represented by circles) is the data taken with neither a cell nor a glass bead residing in the opening, the lower curve (data points represented by squares) is the data taken with a glass bead in the o...
example 3
Electrical Impedance Mapping of Electroporated Domains
[0131]In order to illustrate the ability of EIT to monitor electroporation in tissue we have solved a mathematical simulation of the problem.
[0132]To provide the necessary data for electroporation imaging simulation, a simulated tissue phantom was created first using a 2-D fine-mesh FEM model (˜1600 nodes, ˜3100 elements). The phantom, shown in FIG. 9, consisted of a circular imaging domain (20 mm radius, resistivity 500 ohm cm for muscle with a variable number of point source electrodes equally spaced around the periphery. Within this imaging region, a single arbitrarily shaped electroporated region was defined with a different resistivity. An opposite electrode current injection pattern was used, providing N(N−1) / 2 independent voltage measurements where N is the number of electrodes. The model was solved using the adaptive mesh generation and FEM solution algorithms available in MATLAB's Partial Differential Equation Toolbox (T...
PUM
 Abstract
Description
Claims
Application Information
 - R&D
- Intellectual Property
- Life Sciences
- Materials
- Tech Scout
- Unparalleled Data Quality
- Higher Quality Content
- 60% Fewer Hallucinations
Browse by: Latest US Patents, China's latest patents, Technical Efficacy Thesaurus, Application Domain, Technology Topic, Popular Technical Reports.
© 2025 PatSnap. All rights reserved.Legal|Privacy policy|Modern Slavery Act Transparency Statement|Sitemap|About US| Contact US: help@patsnap.com


