Non-invasive psychophysical measurement of glucose using photodynamics
a photodynamic and psychophysical technology, applied in the field of non-invasive in vivo measurement of blood glucose, can solve the problems of unsatisfactory need to draw blood for analysis, high cost of testing supplies, and potential risk of spreading disease through skin puncture, so as to facilitate the diabetic patient and influence the regeneration rate of visual pigments
- Summary
- Abstract
- Description
- Claims
- Application Information
AI Technical Summary
Benefits of technology
Problems solved by technology
Method used
Image
Examples
example 1
Visual Acuity Test: Effect of Increasing Glucose Concentration on Pigment Regeneration
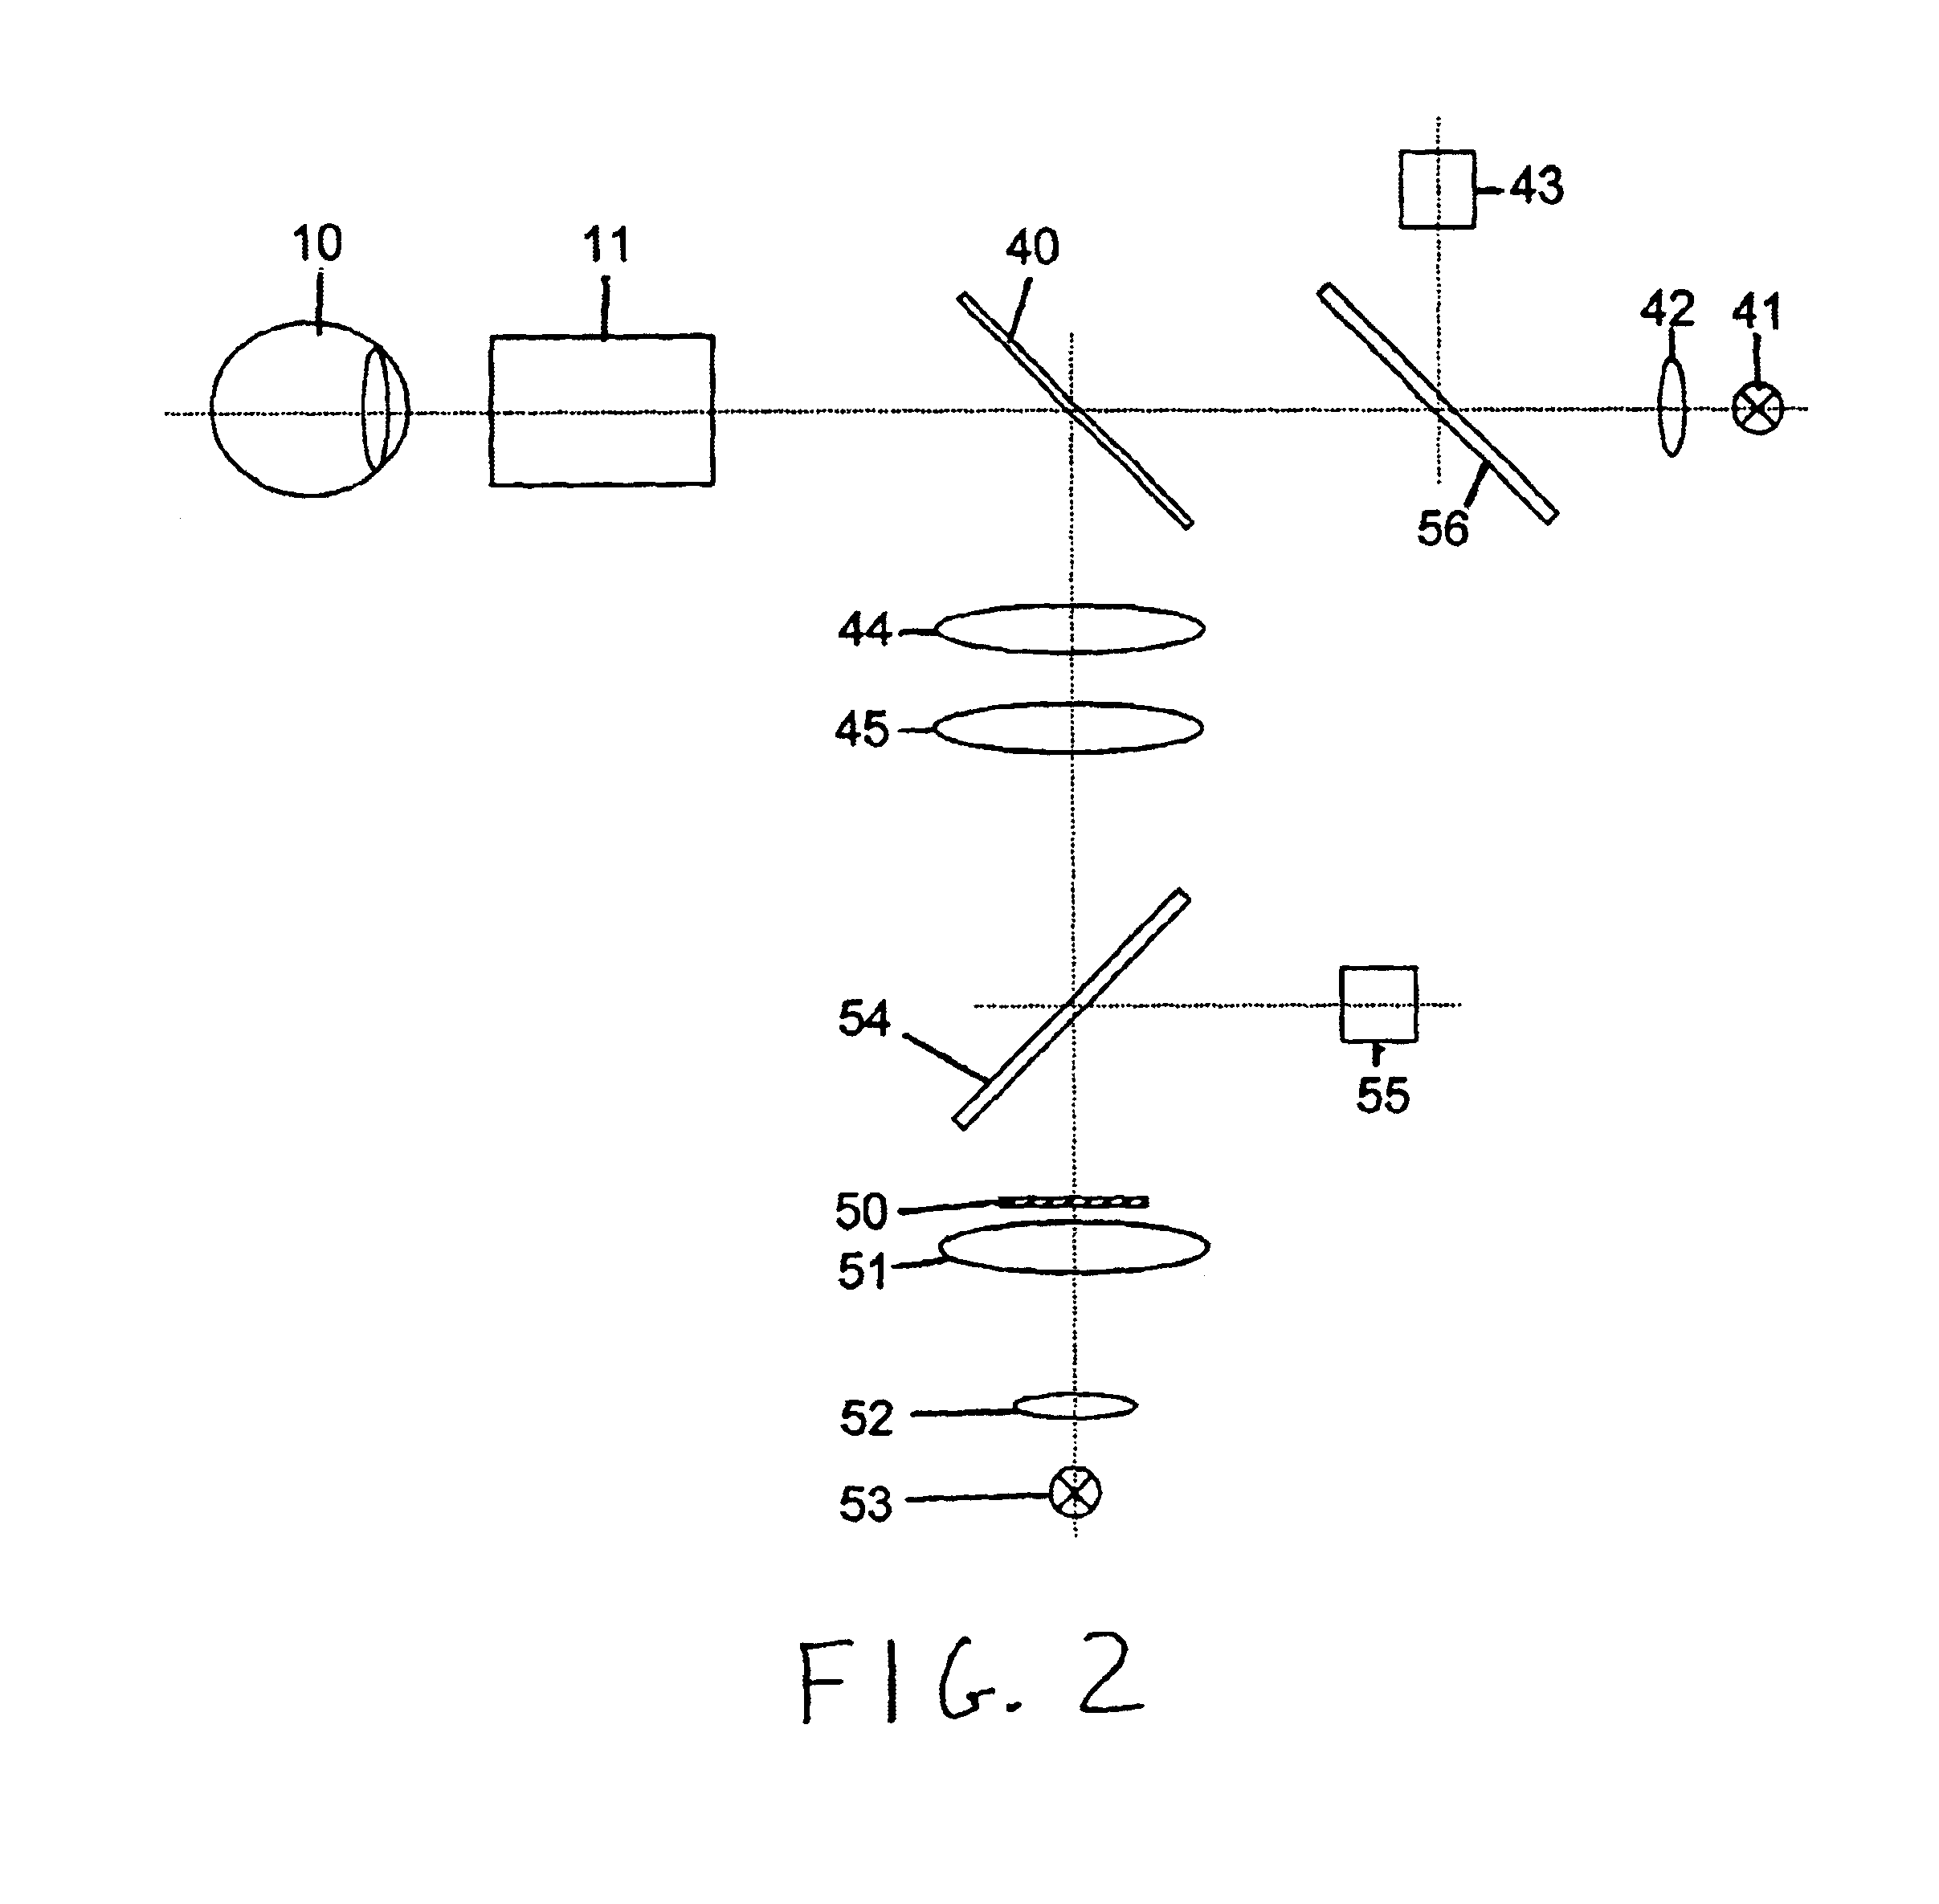
[0050]FIG. 5 is a graph of actual patient data showing the change in the rhodopsin regeneration rates as measured by the time to restoration of visual acuity (measured in seconds) following a series of bleaching pulses plotted against the time (measured in minutes) during glucose tolerance testing. The tests were conducted on the apparatus shown in FIG. 2. At time zero on the x-axis the subject completed drinking a glucose solution. The four points to the left of time zero were measured as baseline tests. Also in this graph is shown the actual blood glucose concentration as measured with a traditional blood glucose testing method (One Touch System, Lifescan, Inc. Johnson and Johnson). FIG. 5 demonstrates the correlation between increasing blood glucose levels and decreasing times to visual acuity which correspond to faster rhodopsin regeneration times.
example 2
Visual Acuity Test: Effect of Increasing Glucose Concentration on Pigment Regeneration
[0051]Visual acuity tests were conducted using a system wherein a single bleaching light pulse is triggered each time the patient is just able to see the visual acuity target. This process is repeated eight times and the resultant data set is a series of triggering time periods that are summated and then averaged. Longer visual pigment regeneration times produce longer average time periods. FIG. 6 shows actual patient data using this method of averaging the time periods between successive repeated bleachings. As shown in the graph, the visual pigment regeneration times decrease as the blood glucose concentration increases and the regeneration times then increase as the blood glucose values return to baseline. At time zero on the x-axis the subject completed drinking a glucose solution. The two points to the left of time zero were measured as baseline tests. At each testing point, two separate bleac...
example 3
Color-matching Test: Effect of Increasing Glucose Concentration on Pigment Regeneration
[0052]FIG. 10 shows actual patient data from color-matching tests. The tests were conducted at two different blood glucose concentration values. The data were obtained using the color-matching apparatus shown in FIG. 8. As shown in the graph, there is a right shift of the curve of red / green intensity versus yellow intensity and Io with a higher blood glucose concentration value. Individual patient calibration reveals a plot of Io vs. blood glucose concentration. The blood glucose can be ascertained for a patient by measuring the Io point and then calculating the appropriate blood glucose value. The desired relationship may be amenable, alternatively, to development as a look-up table, regression model, or other algorithm carried out with a special purpose computer or an appropriately programmed personal computer, work station, etc.
PUM
 Abstract
Description
Claims
Application Information
 - R&D
- Intellectual Property
- Life Sciences
- Materials
- Tech Scout
- Unparalleled Data Quality
- Higher Quality Content
- 60% Fewer Hallucinations
Browse by: Latest US Patents, China's latest patents, Technical Efficacy Thesaurus, Application Domain, Technology Topic, Popular Technical Reports.
© 2025 PatSnap. All rights reserved.Legal|Privacy policy|Modern Slavery Act Transparency Statement|Sitemap|About US| Contact US: help@patsnap.com


