Methods and systems for data analysis

Inactive Publication Date: 2006-01-19
LEALAND STANFORD JUNIOR UNIV
View PDF3 Cites 82 Cited by
  • Summary
  • Abstract
  • Description
  • Claims
  • Application Information

AI Technical Summary

Benefits of technology

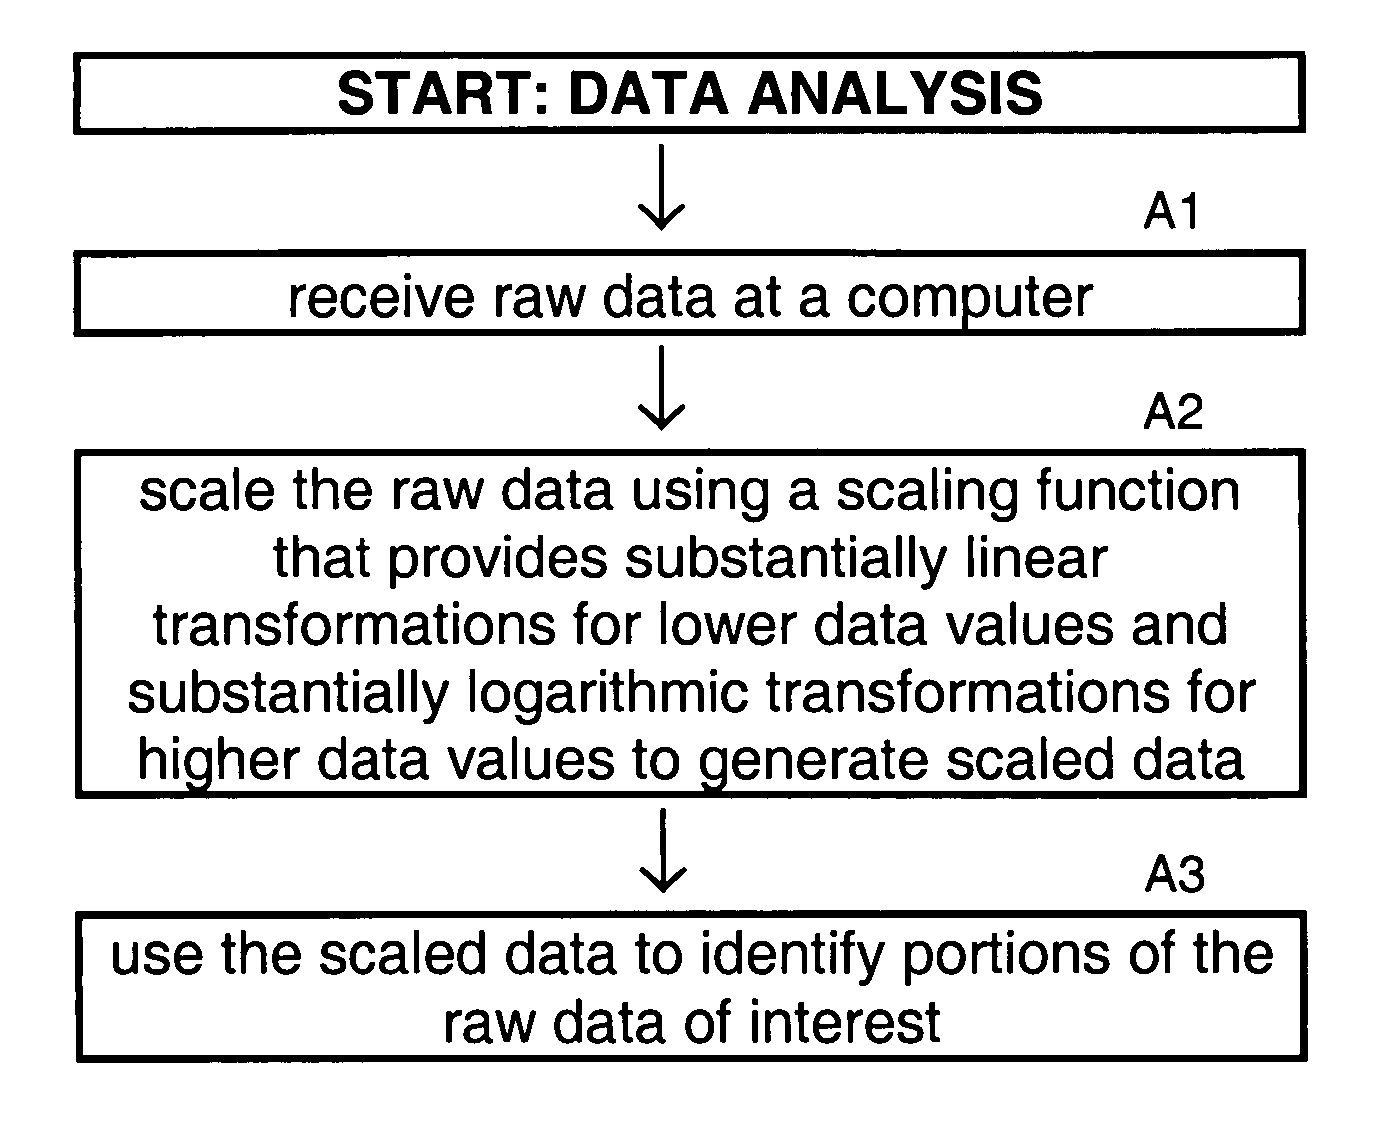
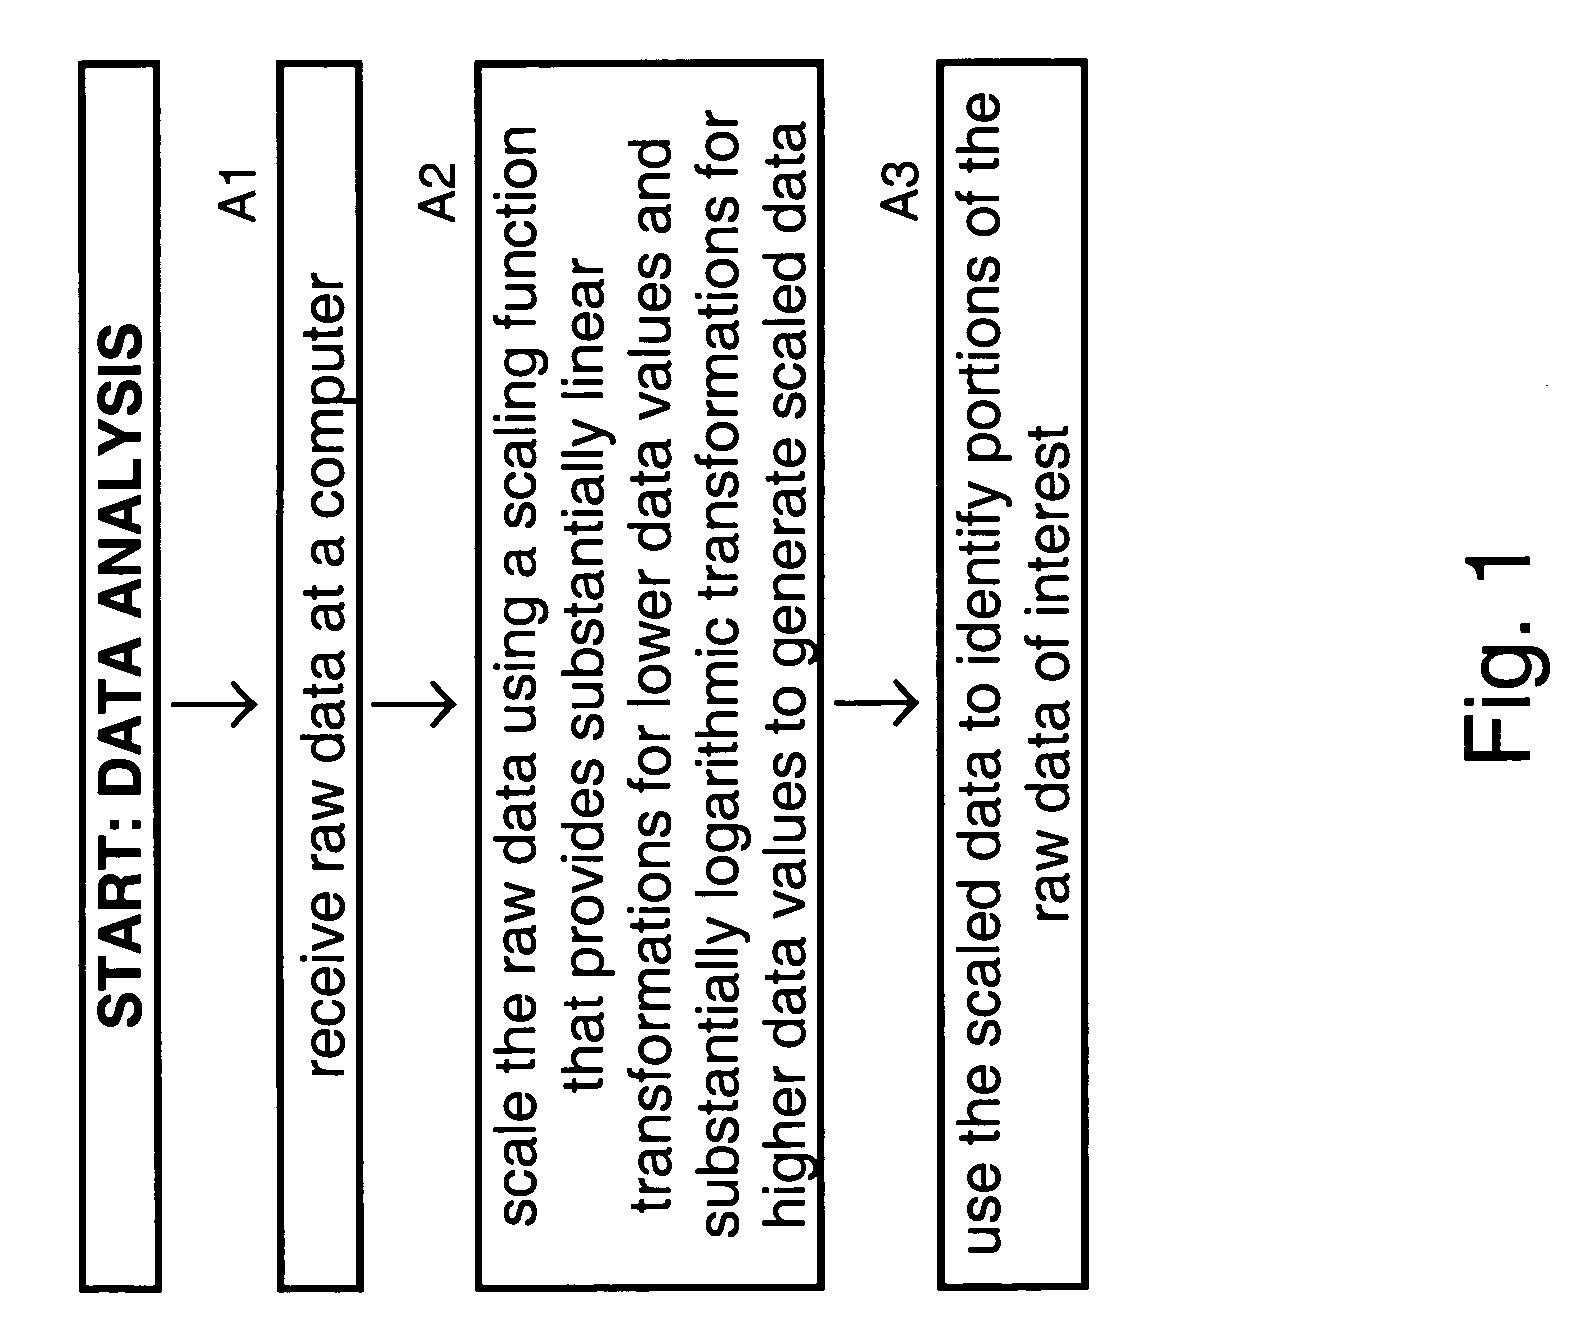
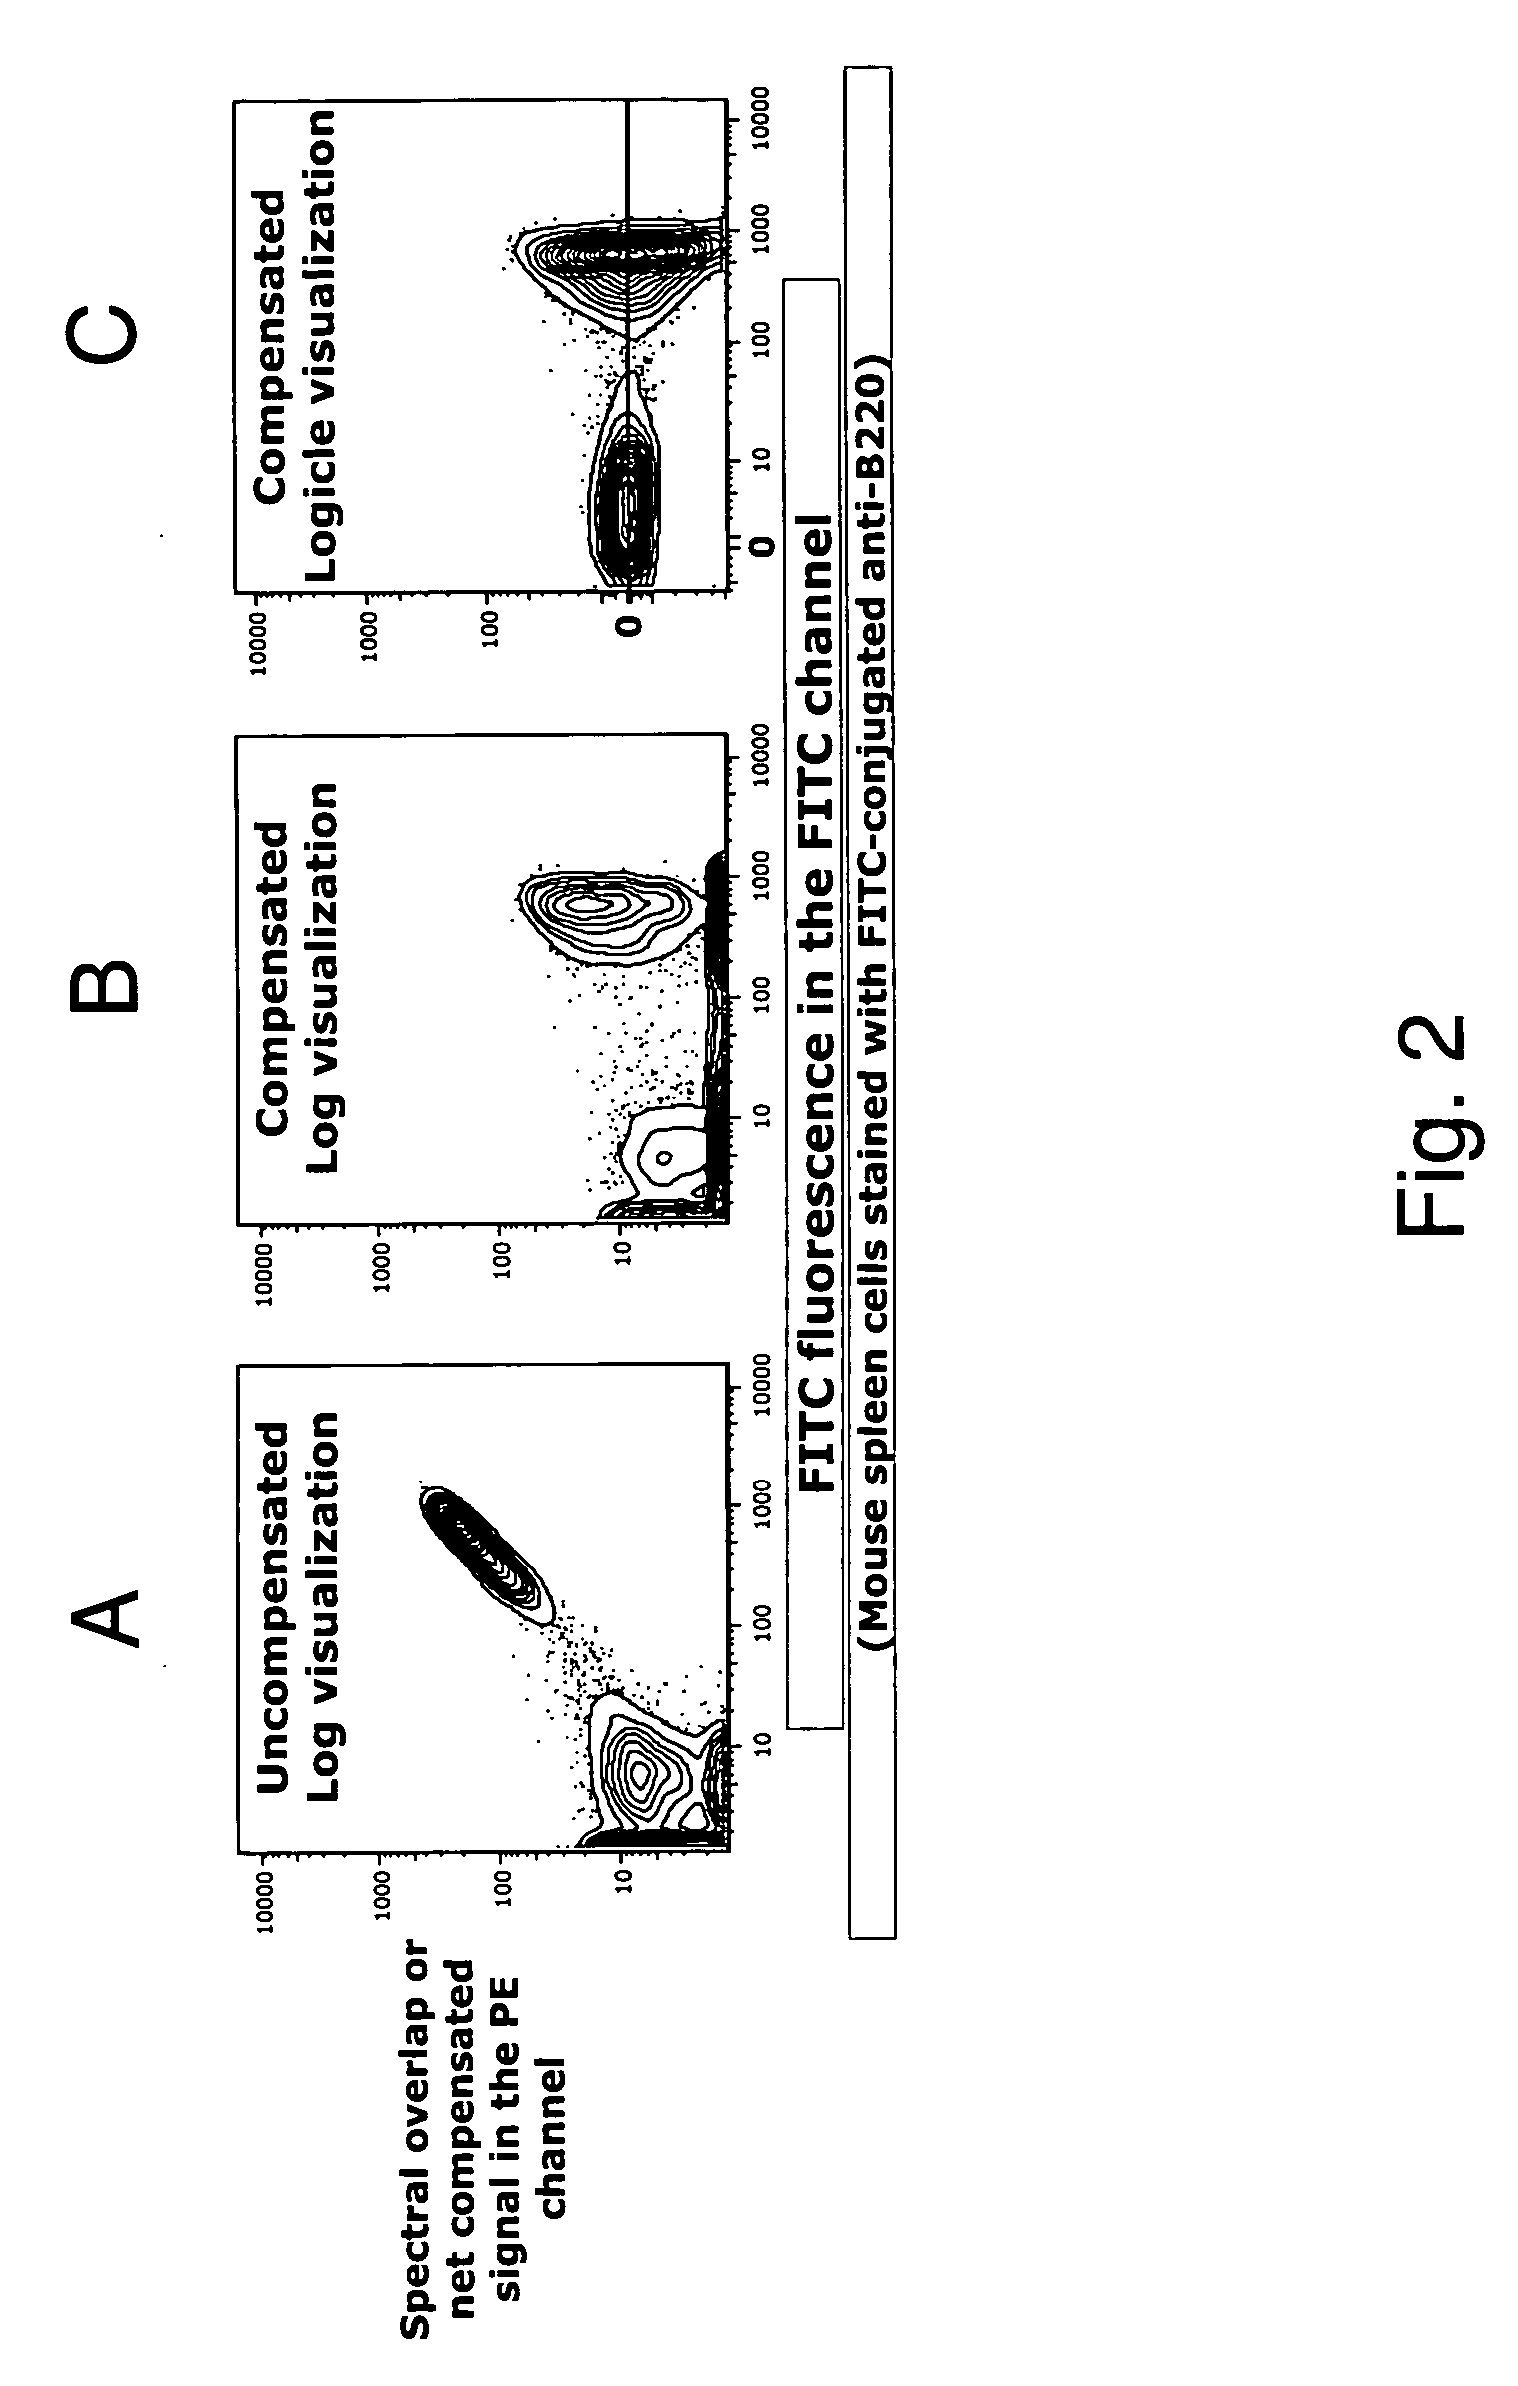
[0020] In certain aspects, for example, the invention relates to data visualization methods that provide advantages over linear or logarithmic scaling for display of flow cytometry and other types of data. These methods scale the axes on one-dimensional histograms and bivariate plots to provide complete and readily interpretable displays of data from all cell populations, including those that have minimal fluorescence values and are poorly represented with traditional logarithmic axes. This “Logicle” scaling provides superior representations of compensated data and makes correctly compensated data look correct. It eliminates “picket fencing” and anomalous peaks introduced by log scaling. It also makes flow cytometry or other types of data more suitable for automated cluster analysis.

Problems solved by technology

In most applications linear scaling fails to provide appropriate resolution across the typical data range of up to 10,000:1.
Logarithmic displays are unable to deal with negative data values and typically introduce biologically artifactual peaks, particularly in data derived through fluorescence compensation.
The result is that both the compactness and central tendency of low signal cell populations is severely obscured.
Previous attempts to develop improved visualizations (e.g., displaying cytometry data for a human viewer) have not been very successful in that they have involved seriously compromising quantitation and / or introduced their own artifacts into the display (e.g., a simple linear-to-log splice tends to introduce a distinct transition line into the display).
As is so often the case, this mathematical analysis is not complete in the real world.
In practice the limiting step is the number of photoelectrons emitted at the cathode of the photomultiplier tube.
For cells with just autofluorescence or very low dye levels the effects of photon statistics, possible electronic noise and real differences in low-level fluorescence among cells in a particular population often result in signal distributions with low means and high relative variances.
In particular, this process can properly result in negative dye estimates for some cells even though, of course, negative dye amounts are not possible.
This occurs because of the subtraction of a relatively large value (the spectral overlap signal) with its associated relatively large error term, results in a dye estimate that is near zero, but still carries the same large error term: the plus-or-minus range of this error in the measurement can be significantly larger than the autofluorescence.
In no case, however, can the mean of a population fall below zero except through instrument or experimenter error.
These negative values must not be disregarded since truncating them will deform the data distributions and result in incorrect computation of signal means.

Method used


Image

  • Methods and systems for data analysis
  • Methods and systems for data analysis
  • Methods and systems for data analysis

Examples


example system embodiment

[0205]FIG. 29 is a block diagram illustrating an integrated system according to specific embodiments of the present invention. This particular example embodiment optionally supports providing statistical analysis over a network. The server system 210 includes a server engine 211, various interface pages 213, data storage 214 for storing instructions, data storage 215 for storing sample data, and data storage 216 for storing data generated by the computer system 210. According to specific embodiments of the invention, the server system further includes or is in communication with a processor 240 that further comprises one or more logic modules for performing one or more methods as described herein.

[0206] Optionally, one or more client systems may also comprise any combination of hardware and / or software that can interact with the server system. These systems may include digital workstation or computer systems (an example of which is shown as 220a) including a logic interface module ...


PUM


Abstract

The present invention provides methods of analyzing and / or displaying data. In one aspect, the invention provides methods for visualizing or displaying high dynamic range data obtained from flow cytometry analyses. Related systems and computer programs products are also provided.

Description

CROSS-REFERENCES TO RELATED APPLICATIONS [0001] This application is a continuation-in-part of U.S. application Ser. No. 10 / 688,868, filed Oct. 17, 2003, which claims the benefit of U.S. Provisional Application No. 60 / 419,458, filed Oct. 18, 2002, which are both incorporated by reference.STATEMENT AS TO RIGHTS TO INVENTIONS MADE UNDER FEDERALLY SPONSORED RESEARCH AND DEVELOPMENT [0002] this invention was made with Government support under grant No. EB00231 awarded by the National Institutes of Health (Bioengineering grant, Leonard A. Herzenberg, PI.) The Government has certain rights to this invention.COPYRIGHT NOTIFICATION [0003] Pursuant to 37 C.F.R. 1.71(e), applicants note that a portion of this disclosure contains material that is subject to and for which is claimed copyright protection, such as, but not limited to, source code listings, screen shots, user interfaces, or user instructions, or any other aspects of this submission for which copyright protection is or may be availa...

Claims


Application Information

Patent Timeline
IPC IPC(8): G06F19/00G06F17/18G01N15/14G06F15/00G16B40/10H03F1/26
CPCG01N2015/1488G06F17/18G01N2015/1402G01N15/1459G16H10/40G16B40/00G16B45/00G16B40/10
Inventor PARKS, DAVIDMOORE, WAYNE
Owner LEALAND STANFORD JUNIOR UNIV
Why Eureka
Try Eureka