Method for estimating inflammation area of periodontal pockets
- Summary
- Abstract
- Description
- Claims
- Application Information
AI Technical Summary
Benefits of technology
Problems solved by technology
Method used
Image
Examples
example 1
[0285]At the Osaka University Dental Hospital, 46 samples of 1 ml of saliva were collected from a total of 46 male and female subjects in their 20s to 70s undergoing periodontal disease treatment. The saliva collected was frozen and stored at −20° C. before use.
Calculation of PISA Values Associated with Saliva Samples
[0286]The following clinical information was recorded for all samples. The following two items are indexes that are widely used in dentistry.
[0287](i) Periodontal pocket depth (PPD): PPD refers to the distance from the gingival margin to the tip of a periodontal probe when the probe is inserted into the pocket. The buccal mesial, buccal center, buccal distal, lingual mesial, lingual central, and lingual centrifugal were measured by the 6-point method, and numerical values were calculated in units of 1 mm.
[0288](ii) Bleeding on probing (BOP): BOP refers to the presence or absence of bleeding when a periodontal probe is inserted into the pocket. Th...
example 2
[0322]The same detection results as in Example 1 were used for predicting the PISA values based on the bacterial loads.
[0323]First, the PISA value and the SN ratio data indicating the bacterial load of each bacterium were associated with each sample. Then, the median of the SN ratios of the absolute load index probes of all the samples was calculated, and the SN ratio of the absolute load index probe of each sample was divided by this median. This is specified as the interchip correction value. The interchip SN ratio data were then standardized by dividing the SN ratio data of all bacteria for each sample by the interchip correction value for each sample. The results are shown in Table 7.
TABLE 7PISATotal bacteriagingivalisforsythiadenticolagracilisrectusshowae4772148.11.81.71.51.91.41.2202973.72.22.41.72.21.71.621520831.42.631.51.512502162.21.37.83.91.61.311672743.51.71.61.61.81.51.2772357.11.61.41.41.71.41.11611158.41.60.81.11.10.90.83182689.11.41.21.81.71.31.11802872.62.12.31.82.2...
example 3
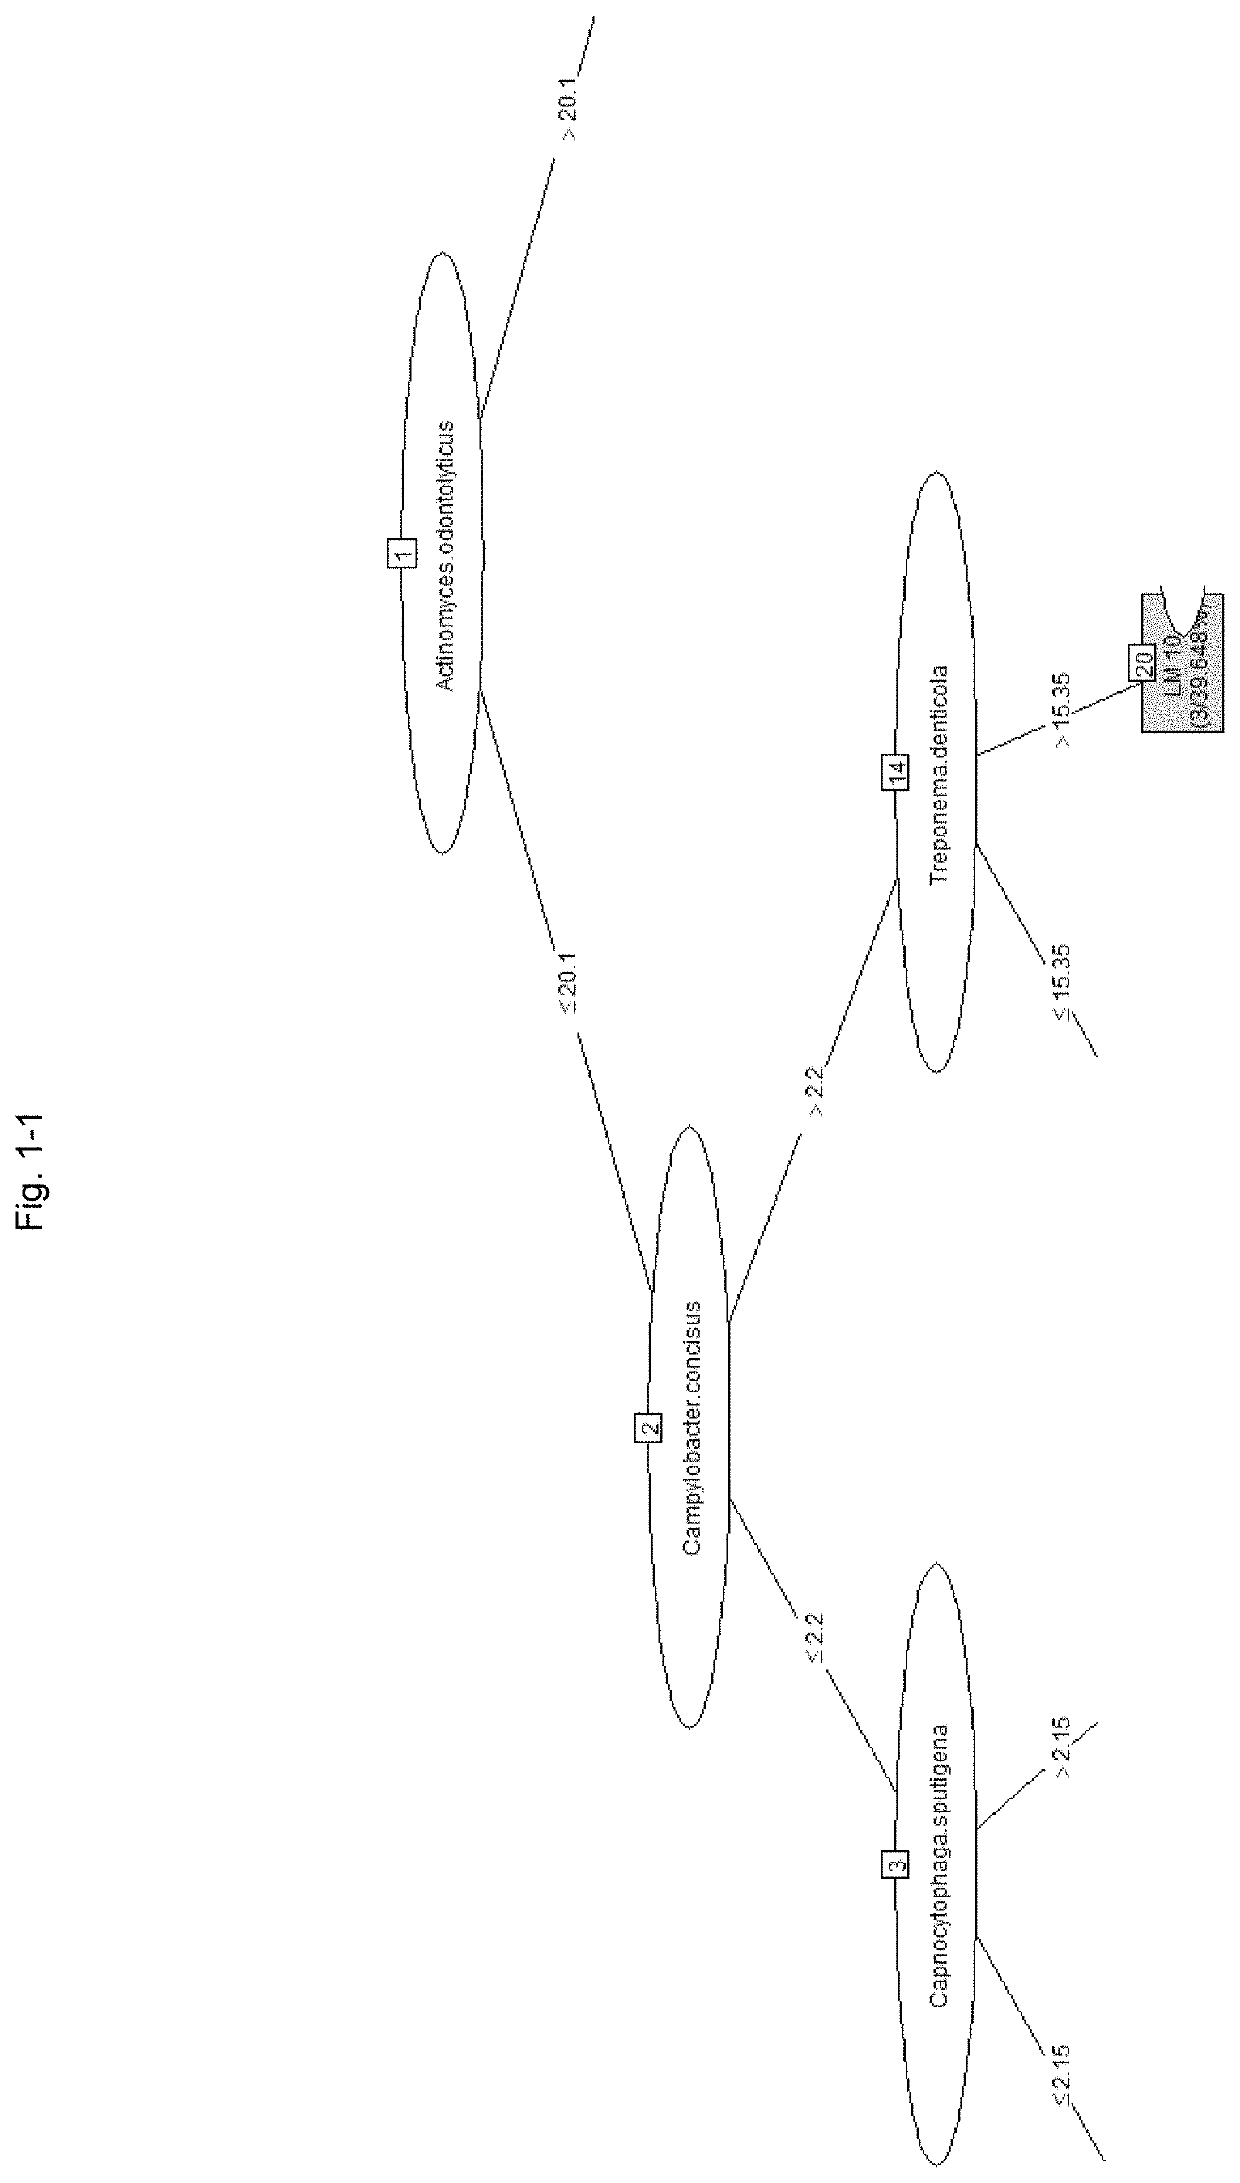
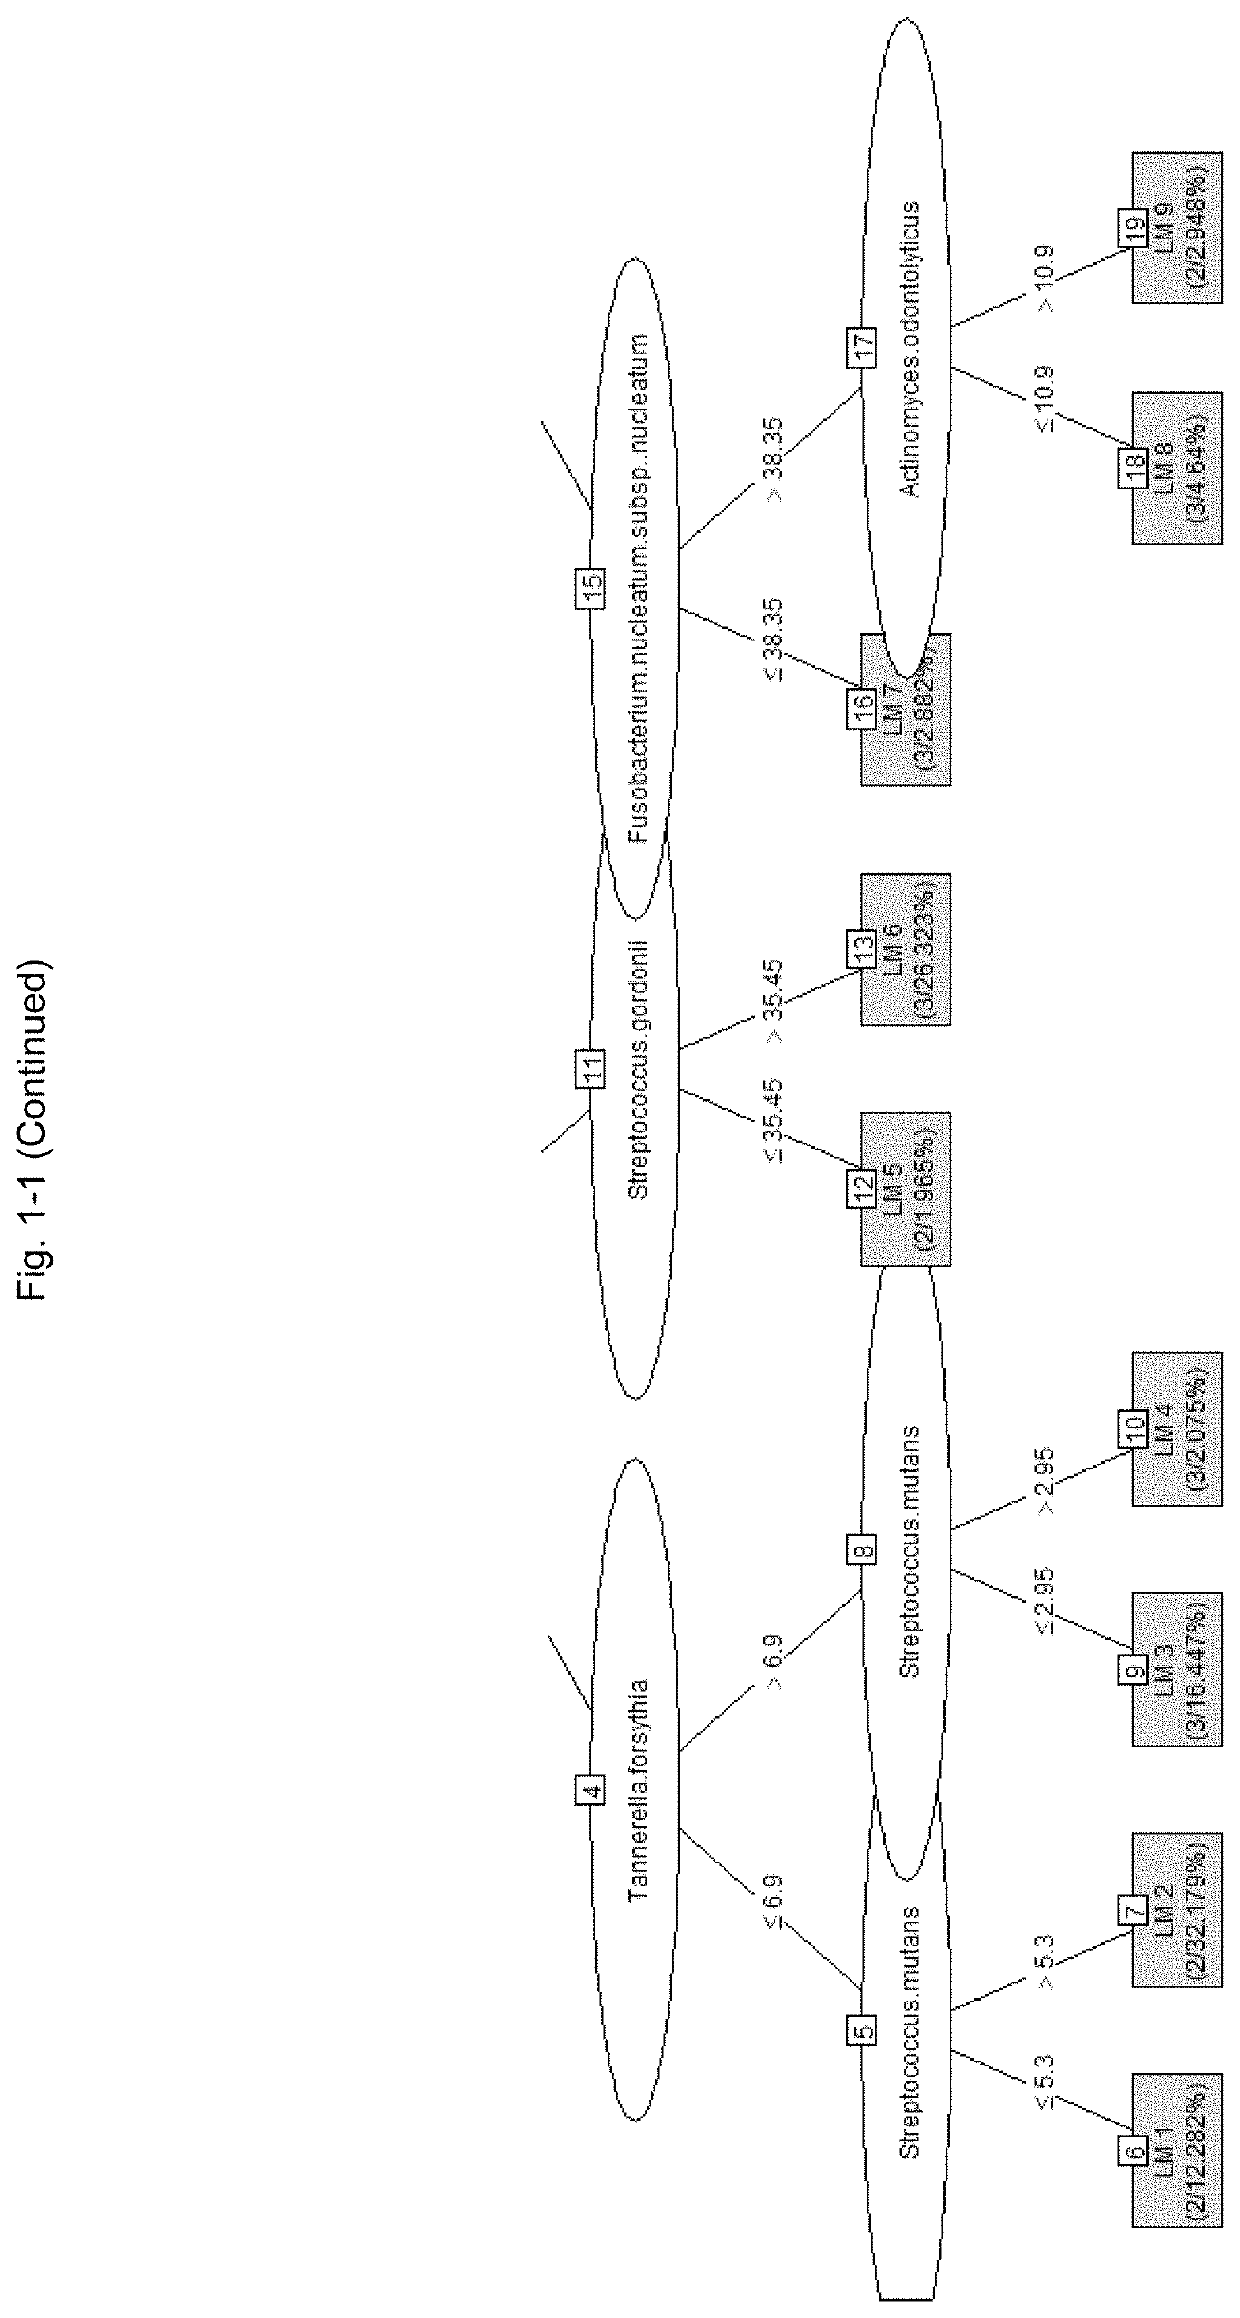
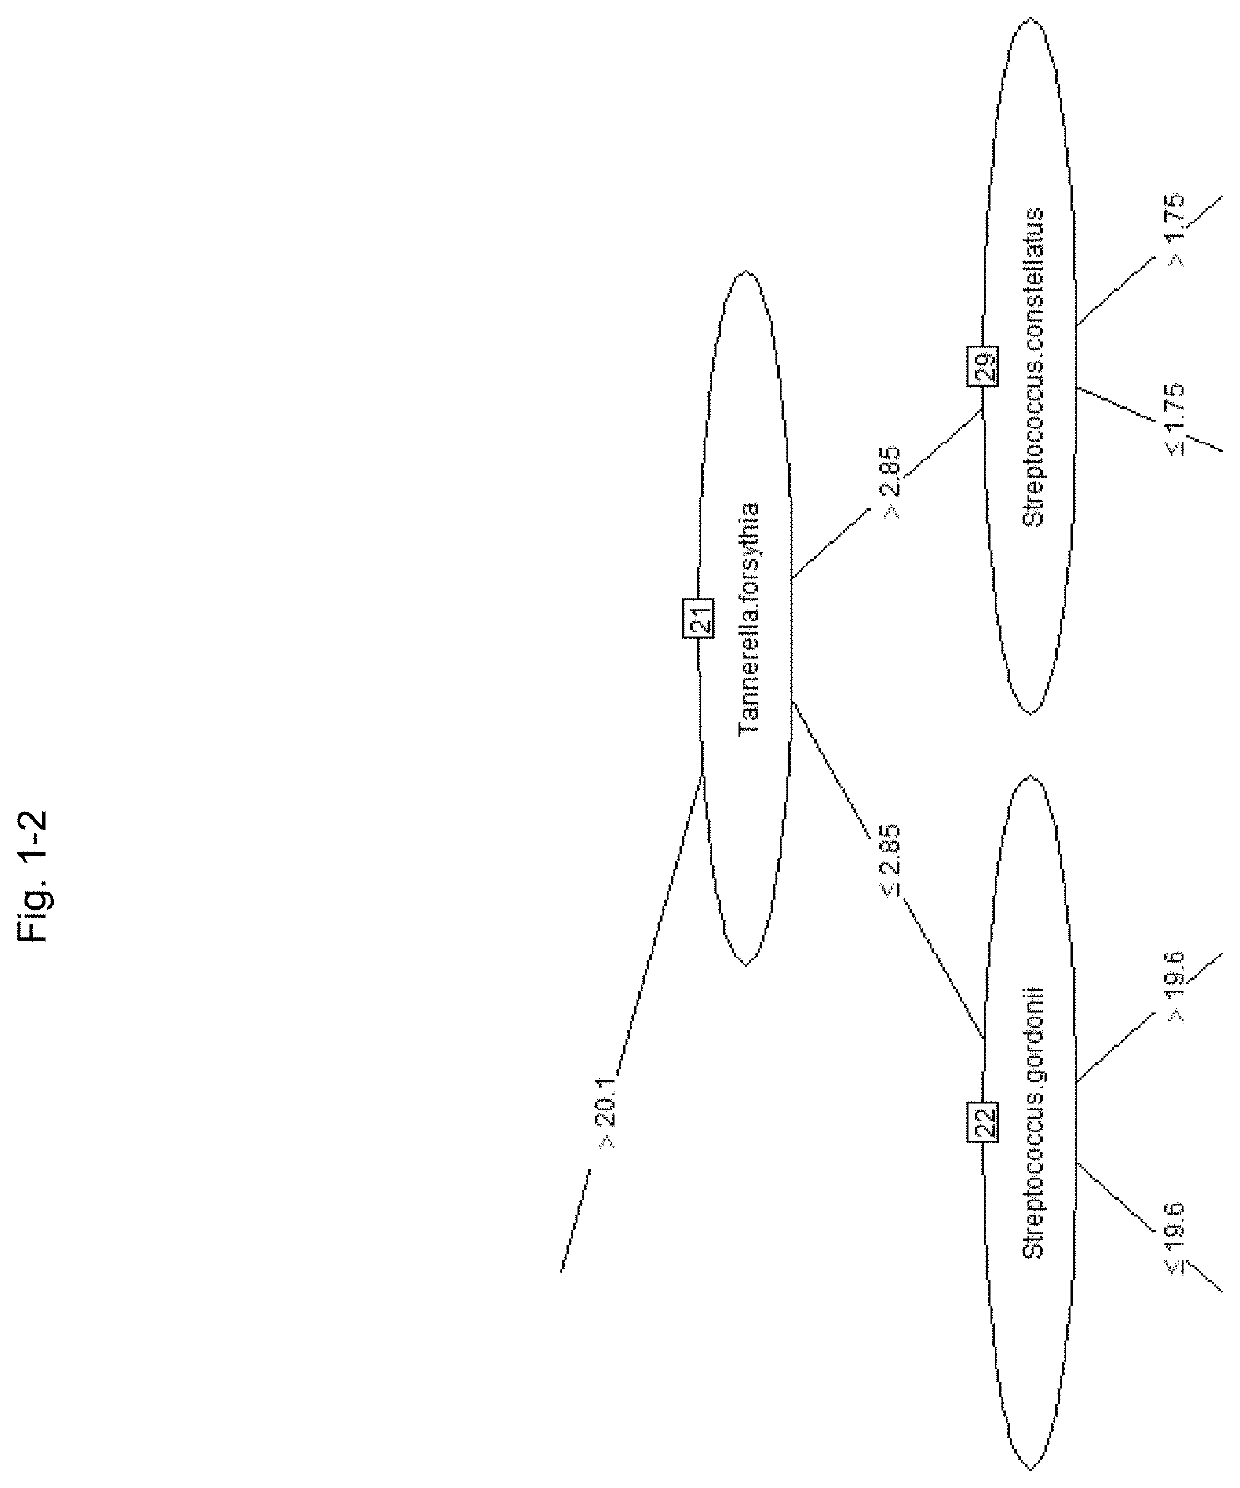
[0334]A model for predicting the PISA value with a model tree was created using a machine learning technique based on the SN ratio of the bacterial load of each bacterium using the same data as in Table 7 described in Example 2. The “M5” method of the “caret” package of the statistical software “R” (R Development Core Team) was used for analysis.
[0335]In constructing the prediction model, 34 samples were randomly extracted from 46 samples and used for the cross-validation method. The ratio of model construction training data and verification data in the cross-validation method was 75:25, and the learning frequency was 10 times.
[0336]After the model construction, the remaining 12 samples of data that were not used for model construction were used as future unknown data and used for verification.
[0337]More specifically, after setting the table of Table 7 to the data frame name “bacteria,” the following commands were executed.
fitControl<-trainControl(method=“CV”,p=0.75, number=10)
train...
PUM
| Property | Measurement | Unit |
|---|---|---|
| Volume | aaaaa | aaaaa |
| Fraction | aaaaa | aaaaa |
| Fraction | aaaaa | aaaaa |
Abstract
Description
Claims
Application Information
 - R&D
- Intellectual Property
- Life Sciences
- Materials
- Tech Scout
- Unparalleled Data Quality
- Higher Quality Content
- 60% Fewer Hallucinations
Browse by: Latest US Patents, China's latest patents, Technical Efficacy Thesaurus, Application Domain, Technology Topic, Popular Technical Reports.
© 2025 PatSnap. All rights reserved.Legal|Privacy policy|Modern Slavery Act Transparency Statement|Sitemap|About US| Contact US: help@patsnap.com


