Method for detecting joint diseases
a joint disease and radiological diagnosis technology, applied in the direction of material excitation analysis, instruments, measurement devices, etc., can solve the problems of no osteoarthritis therapy capable of protecting cartilage, no relationship between the extent of radiological lesions and the severity of osteoarthritis pain, and difficult implementation
- Summary
- Abstract
- Description
- Claims
- Application Information
AI Technical Summary
Benefits of technology
Problems solved by technology
Method used
Image
Examples
example 1
btained by White-Light Interferometry
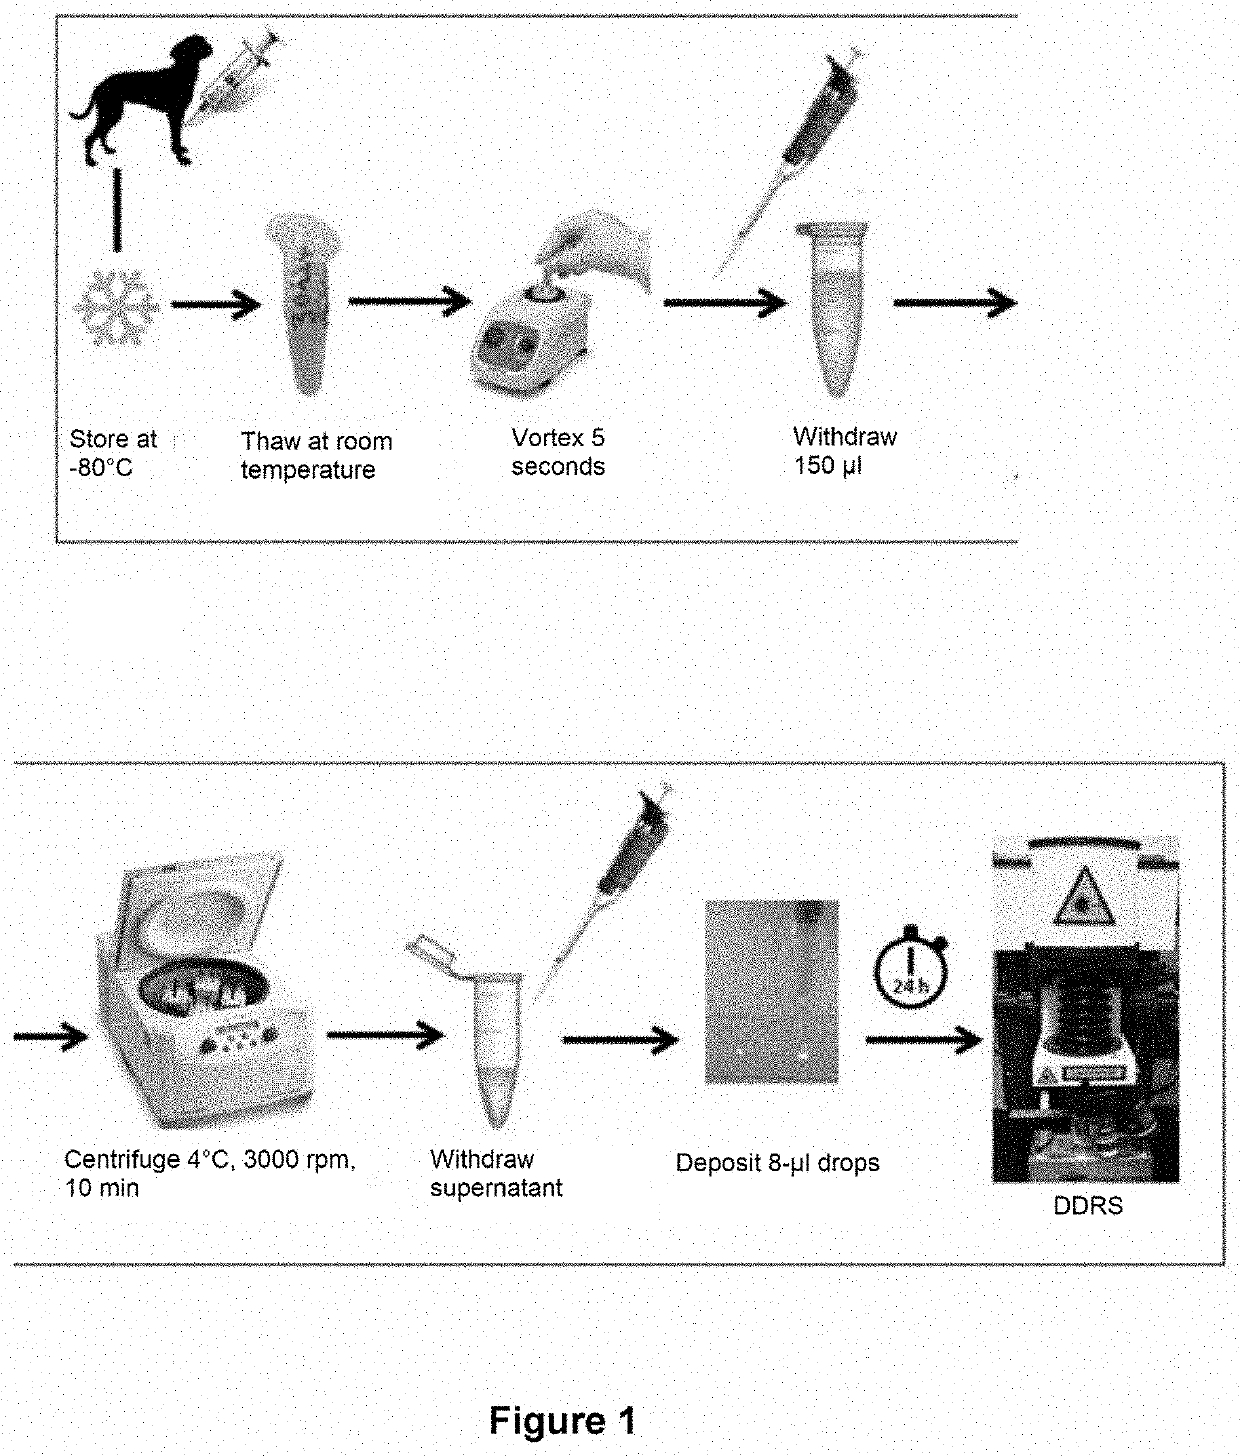
[0331]SF drops were deposited onto standard glass slides and 2D images of the dried drops were captured (FIG. 3).
[0332]Drop area was significantly larger (p=0.026) in the sick OA group (n=6) with a mean area (standard deviation) of 38.37 mm2 (4.80 mm2) than in the healthy group (n=6) with a mean (standard deviation) of 31.30 mm2 (2.85 mm2) (FIG. 4).
[0333]These microscope images revealed the presence of a black bead between the outer periphery and the crystalline center only visible on drops from the healthy group while a bead is clearly visible on the drops from the OA group.
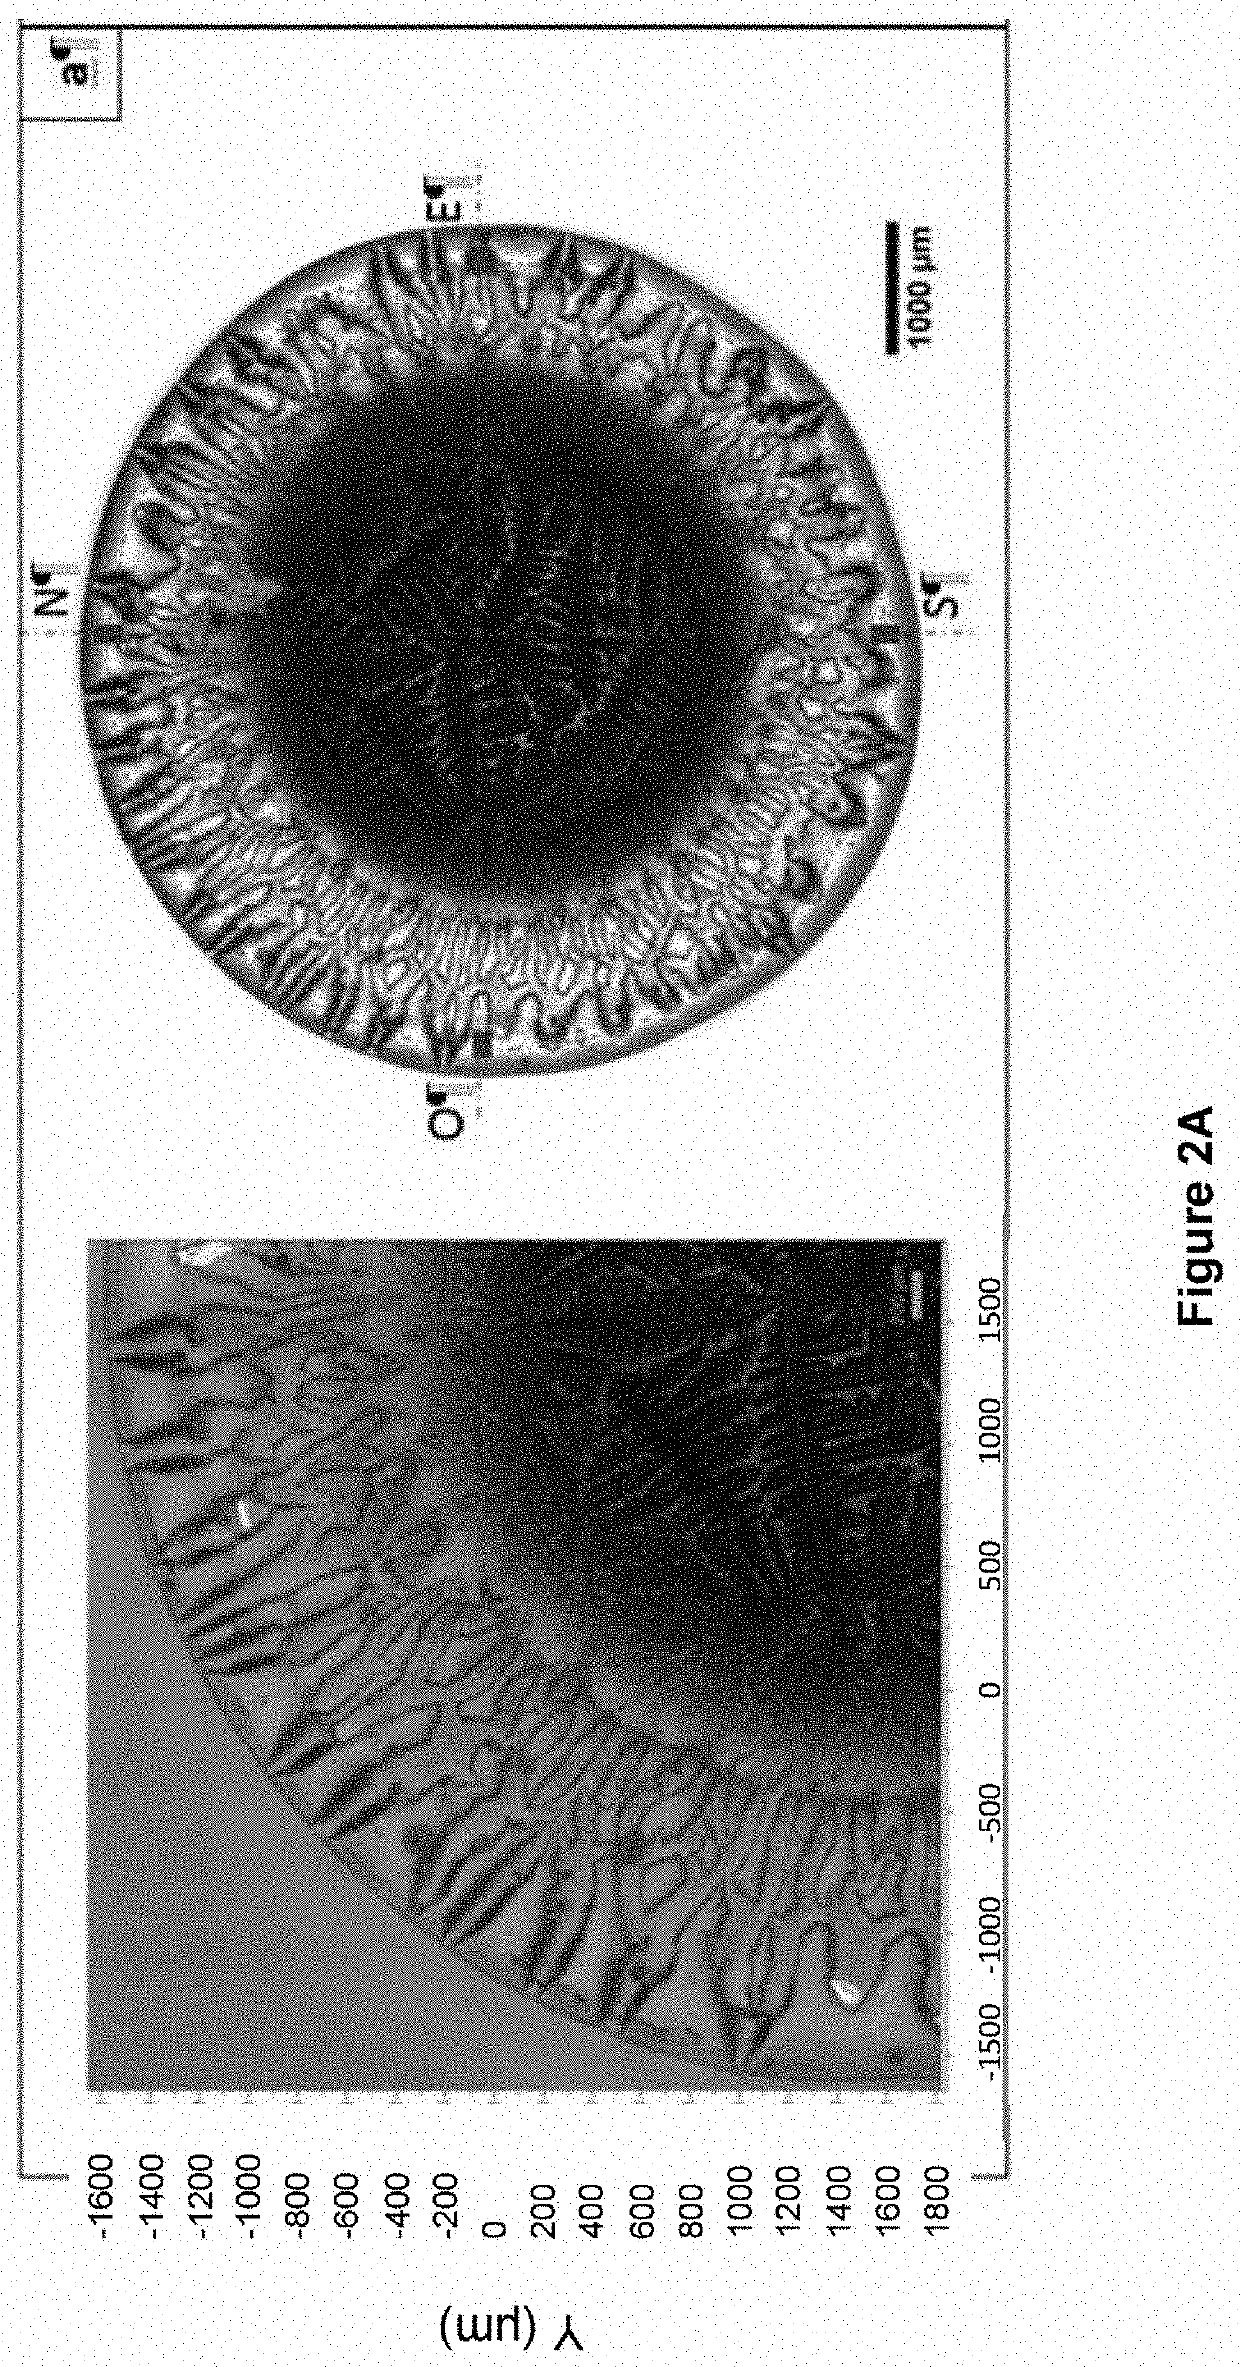
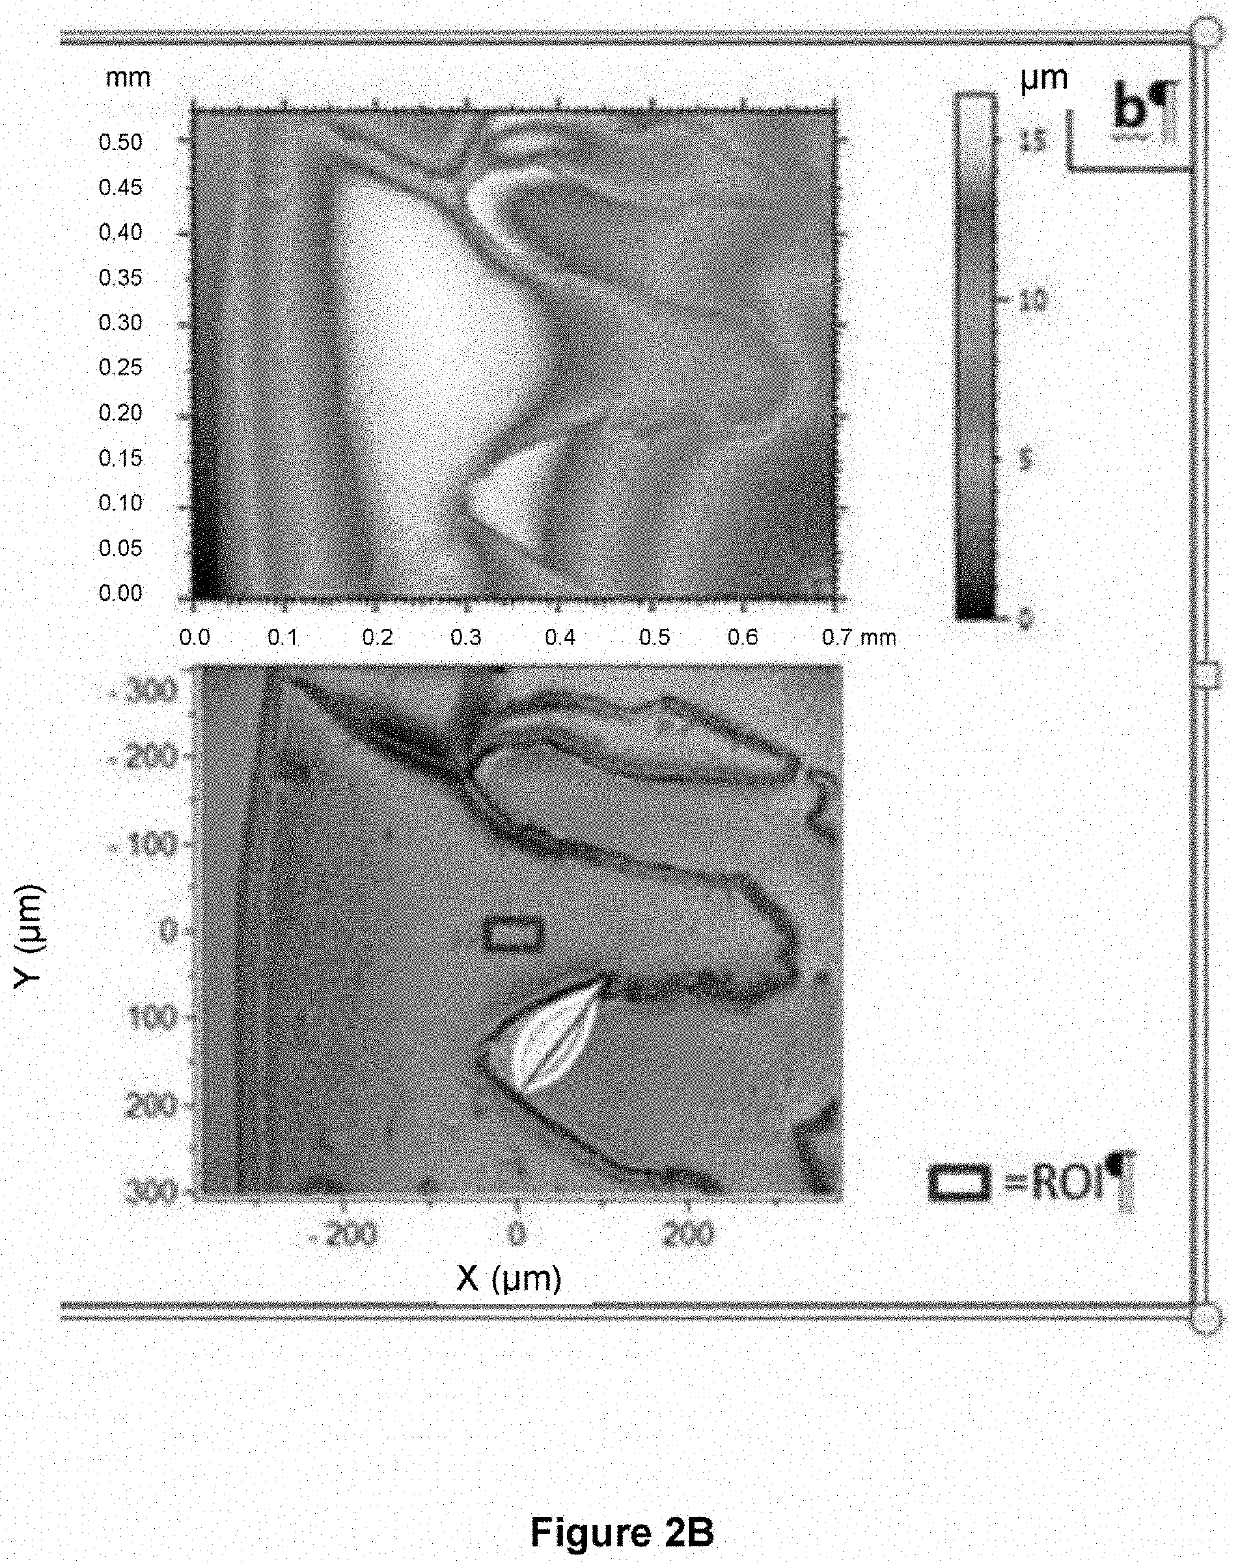
[0334]The 3D interferometric images (FIG. 3) confirmed that the peripheral bead height is significantly higher (p=0.002) in the OA group (n=6) with a mean height (standard deviation) of 30.09 μm (5.80 μm), almost three times higher than that of the healthy group (n=6) with a mean height (standard deviation) of 11.81 μm (1.71 μm) (FIG. 4).
example 2
btained by Raman Spectral Analysis
[0335]No significant difference was observed between the different spectra of healthy SF as evidenced by the small standard deviation. The mean of the 6 spectra of healthy SF was then used to model the spectral signature of healthy SF (FIG. 5A).
[0336]Raman bands were identified and assigned from a literature review on synovial fluid, proteins, amino acids, blood and serum (Table 2).
[0337]To compare healthy and OA spectra, the main bands were identified, deconvoluted and the related ratios calculated. Thus, 21 peaks were selected, identified in Table 2, resulting in the calculation of 210 ratios (only half of the ratio matrix was used, considering that it was not necessary to calculate a ratio and its inverse).
TABLE 2Raman bands of dried SF drops Raman Raman peaks band used ~(cm−1) Assigned molecule (n = 21)828 Tyrosine doublet 852 Tyrosine doublet ✓880 δ(C—C) Tryptophan 896 Hyaluronic acid ✓945 Hyaluronic acid ✓960 ν(PO43−) of phosphate bone ✓970 Fi...
example 3
of Human Synovial Fluid Drops
[0356]In this study, human SF samples were provided “ready-to-use” by the University Hospital of Geneva (HUG). These were SF collected in vivo from patients of radiographic grades 2 and 4. These samples were provided with a certain number of patient data (age, BMI) and biomarkers such as leptin, interleukin-6 (IL6) assays and WOMAC pain and function scores.
[0357]These SF samples were processed as presented above for dog SF samples, i.e. drop deposition, 2D and 3D images of dried drops and Raman spectra.
[0358]Statistical Analyses
[0359]All statistical tests were performed in MATLAB® with the “Statistics and Machine Learning Toolbox”. Pearson correlation tests were performed on all ratios to determine the existence of correlations between the 210 ratios and (i) biomarkers and (ii) morphological features of the drops (bead height and drop area).
[0360]HUG SF / IL6 Assay Correlation
[0361]Correlation tests showed a linear correlation of more than 50% between thre...
PUM
| Property | Measurement | Unit |
|---|---|---|
| height | aaaaa | aaaaa |
| height | aaaaa | aaaaa |
| water contact angle | aaaaa | aaaaa |
Abstract
Description
Claims
Application Information
 - R&D
- Intellectual Property
- Life Sciences
- Materials
- Tech Scout
- Unparalleled Data Quality
- Higher Quality Content
- 60% Fewer Hallucinations
Browse by: Latest US Patents, China's latest patents, Technical Efficacy Thesaurus, Application Domain, Technology Topic, Popular Technical Reports.
© 2025 PatSnap. All rights reserved.Legal|Privacy policy|Modern Slavery Act Transparency Statement|Sitemap|About US| Contact US: help@patsnap.com


