
Method for predicting organ transplant rejection using next-generation sequencing

a technology of organ transplant and next-generation sequencing, applied in the field of noninvasive prediction of organ transplant rejection, can solve the problems of high cost, variability between tissue biopsy physicians, and current methods for diagnosing organ transplant rejection, and achieve the effects of rapid data analysis, low cost and high accuracy

Inactive Publication Date: 2019-07-04
EONE DIAGNOMICS GENOME CENT
View PDF0 Cites 1 Cited by
  • Summary
  • Abstract
  • Description
  • Claims
  • Application Information

AI Technical Summary

Benefits of technology

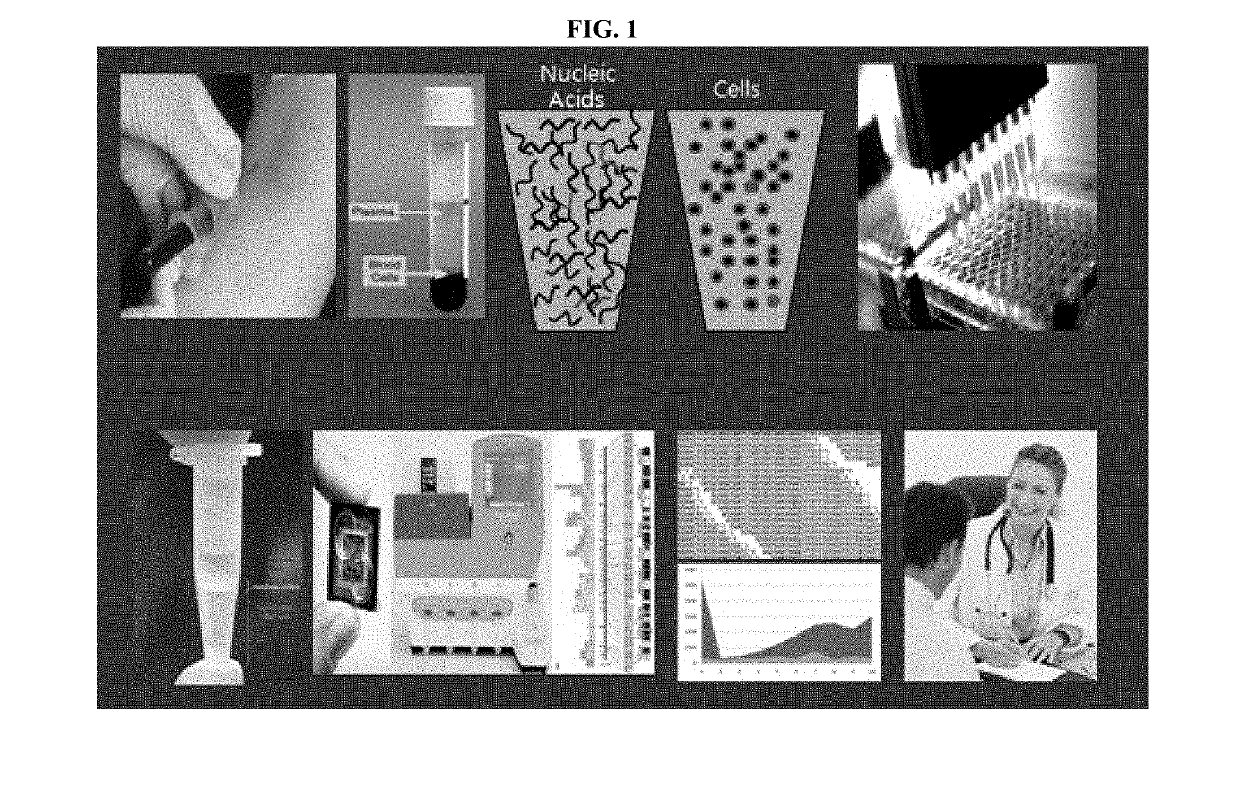
The present invention is a method to predict organ transplant rejection using next-generation sequencing (NGS) or digital base amplification. This method can use small amounts of sample and is quickly, inexpensively, and applicable worldwide. Additionally, it can detect the likelihood of sequencing errors, which is important for non-invasive prediction of organ transplant rejection.

Problems solved by technology

However, methods for diagnosing organ transplant rejection, which are currently used, have many disadvantages.
For example, gold standard for diagnosing heart transplant rejection is examining tissue at each time point with surgery for heart biopsy, however, this methods shows many problems including high costs, variability between tissue biopsy physicians, and severe patient discomfort (F. Saraiva et al., Transplant.
However, these methods also pose limitations as they tend to produce high false positive results due to the complex cross-reactivity of various immune responses, and are based on tissue-specific gene expression signals.
The next-generation sequencing technique can produce huge amount of data within a short span of time, unlike the existing methods.
Thus, this technique is both time and cost effective for individual genome sequencing.
However, this method has limitations; it requires considerable amount of time and cost as it analyzes whole genome data.

Method used


Image

  • Method for predicting organ transplant rejection using next-generation sequencing
  • Method for predicting organ transplant rejection using next-generation sequencing
  • Method for predicting organ transplant rejection using next-generation sequencing

Examples


example 1

n of Organ Transplant Rejection in Artificially Generated Organ Transplant Recipients

[0088]1.1: Pretreatment for Preparation and Analysis of Artificial DNA Samples from Organ Transplant Recipients

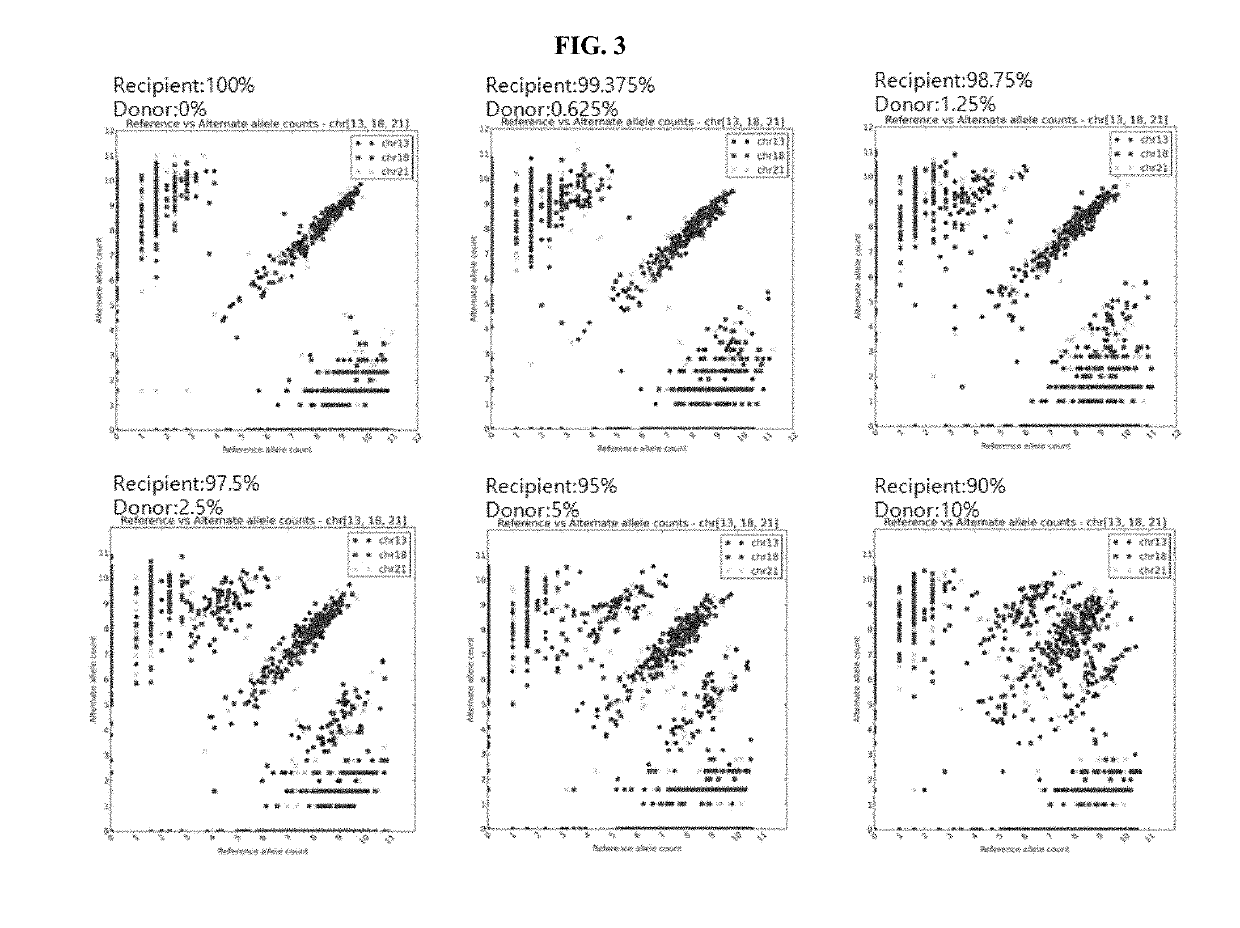
[0089]Male DNA (donor) was mixed with female DNA (recipient) such that the percentage of the male DNA in the female DNA would be 0%, 0.625%, 1.25%, 2.5%, 5% or 10%, thereby preparing artificial organ transplant patient genomic DNA samples.

[0090]To perform a TruSeq Custom Amplicon (TSCA) assay (Illumina, USA) using 100 ng of each gDNA, Custom Amplicon was prepared. A heat block was adjusted to 95° C., and 5 μl of each of DNA and CAT (Custom Amplicon Oligo Tube) was added to a 1.7-ml tube. As control reagents, 5 μl of each of ACD1 and ACP1 was also prepared. 40 μl of OHS1 (Oligo Hybridization for Sequencing Reagent 1) was added to each tube and mixed well using a pipette, and each tube was maintained at 95° C. for 1 min, and subjected to oligo hybridization at 40° C. for 80 min subsequently. ...


PUM

PropertyMeasurementUnit
Timeaaaaaaaaaa
Timeaaaaaaaaaa
Timeaaaaaaaaaa

Abstract

A non-invasive method for organ transplant rejection prediction is described, involving measurement of the ratio between donor-specific nucleic acid sequences and recipient-specific nucleic acid sequences in a biological sample obtained from an organ transplant recipient. In specific implementations, the method includes analyzing a biological sample (e.g., blood) obtained from an organ transplant recipient to measure the ratio between donor-derived marker sequences and recipient-derived marker sequences, having three or more markers selected from the markers listed in Tables 1 to 10, and thereby predicting organ transplant rejection based on the ratio. Using next-generation sequencing (NGS) or digital base amplification in the disclosed method enables its application to minute amounts of a sample. The method is rapid, inexpensive, enables rapid data analysis, is applicable irrespective of organ type and race(s) of the donor and recipient, and can detect the probability of sequencing error.

Description

CROSS-REFERENCE TO RELATED APPLICATIONS[0001]This application is a U.S. national phase under the provisions of 35 U.S.C. § 371 of International Patent Application No. PCT / KR2015 / 005905 filed Jun. 11, 2015, which in turn claims priority of Korean Patent Application No. 10-2015-0052649 filed Apr. 14, 2015. The disclosures of all such applications are hereby incorporated herein by reference in their respective entireties, for all purposes.TECHNICAL FIELD[0002]The present invention relates to a method of non-invasively predicting organ transplant rejection by measuring the ratio between donor-specific nucleic acid sequences and recipient-specific nucleic acid sequences in a biological sample obtained from an organ transplant recipient, and more particularly to a method of predicting organ transplant rejection based on the results of measuring the ratio between donor-derived marker sequences and recipient-derived marker sequences by analyzing a biological sample (e.g., blood) obtained fr...

Claims


Application Information

Patent Timeline
IPC IPC(8): C12Q1/6869C12Q1/6883C12Q1/6881G01N33/49G16B30/00
CPCC12Q1/6883G01N2800/245C12Q2600/156C12Q2600/106C12Q2600/16C12Q1/6881G01N33/49C12Q1/6869G16B99/00G16B30/00C12Q1/6827C12Q1/6876C12Q2537/143C12Q1/68
Inventor LEE, MIN SEOBKWON, SUN JAE
Owner EONE DIAGNOMICS GENOME CENT
Learn More