
Mass spectrometer

a mass spectrometer and mass spectrometer technology, applied in the field of mass spectrometers, can solve the problems of reducing the efficiency of the analysis task, reducing the size of the useful mass spectral on which there are sufficient ion intensities, and reducing the size of another display area, so as to improve the efficiency of the data analysis task and reduce the error rate

Active Publication Date: 2019-01-24
SHIMADZU CORP
View PDF12 Cites 0 Cited by
  • Summary
  • Abstract
  • Description
  • Claims
  • Application Information

AI Technical Summary

Benefits of technology

The mass spectrometer described in this patent allows users to quickly analyze data by displaying only important spectra on the screen, while excluding unnecessary ones. This makes it easier for operators to identify and quantify components, and reduces the likelihood of errors when reading the data. Overall, this improves the efficiency and accuracy of mass spectrometry analysis.

Problems solved by technology

This constitutes a factor that lowers the efficiency of the analyzing task.
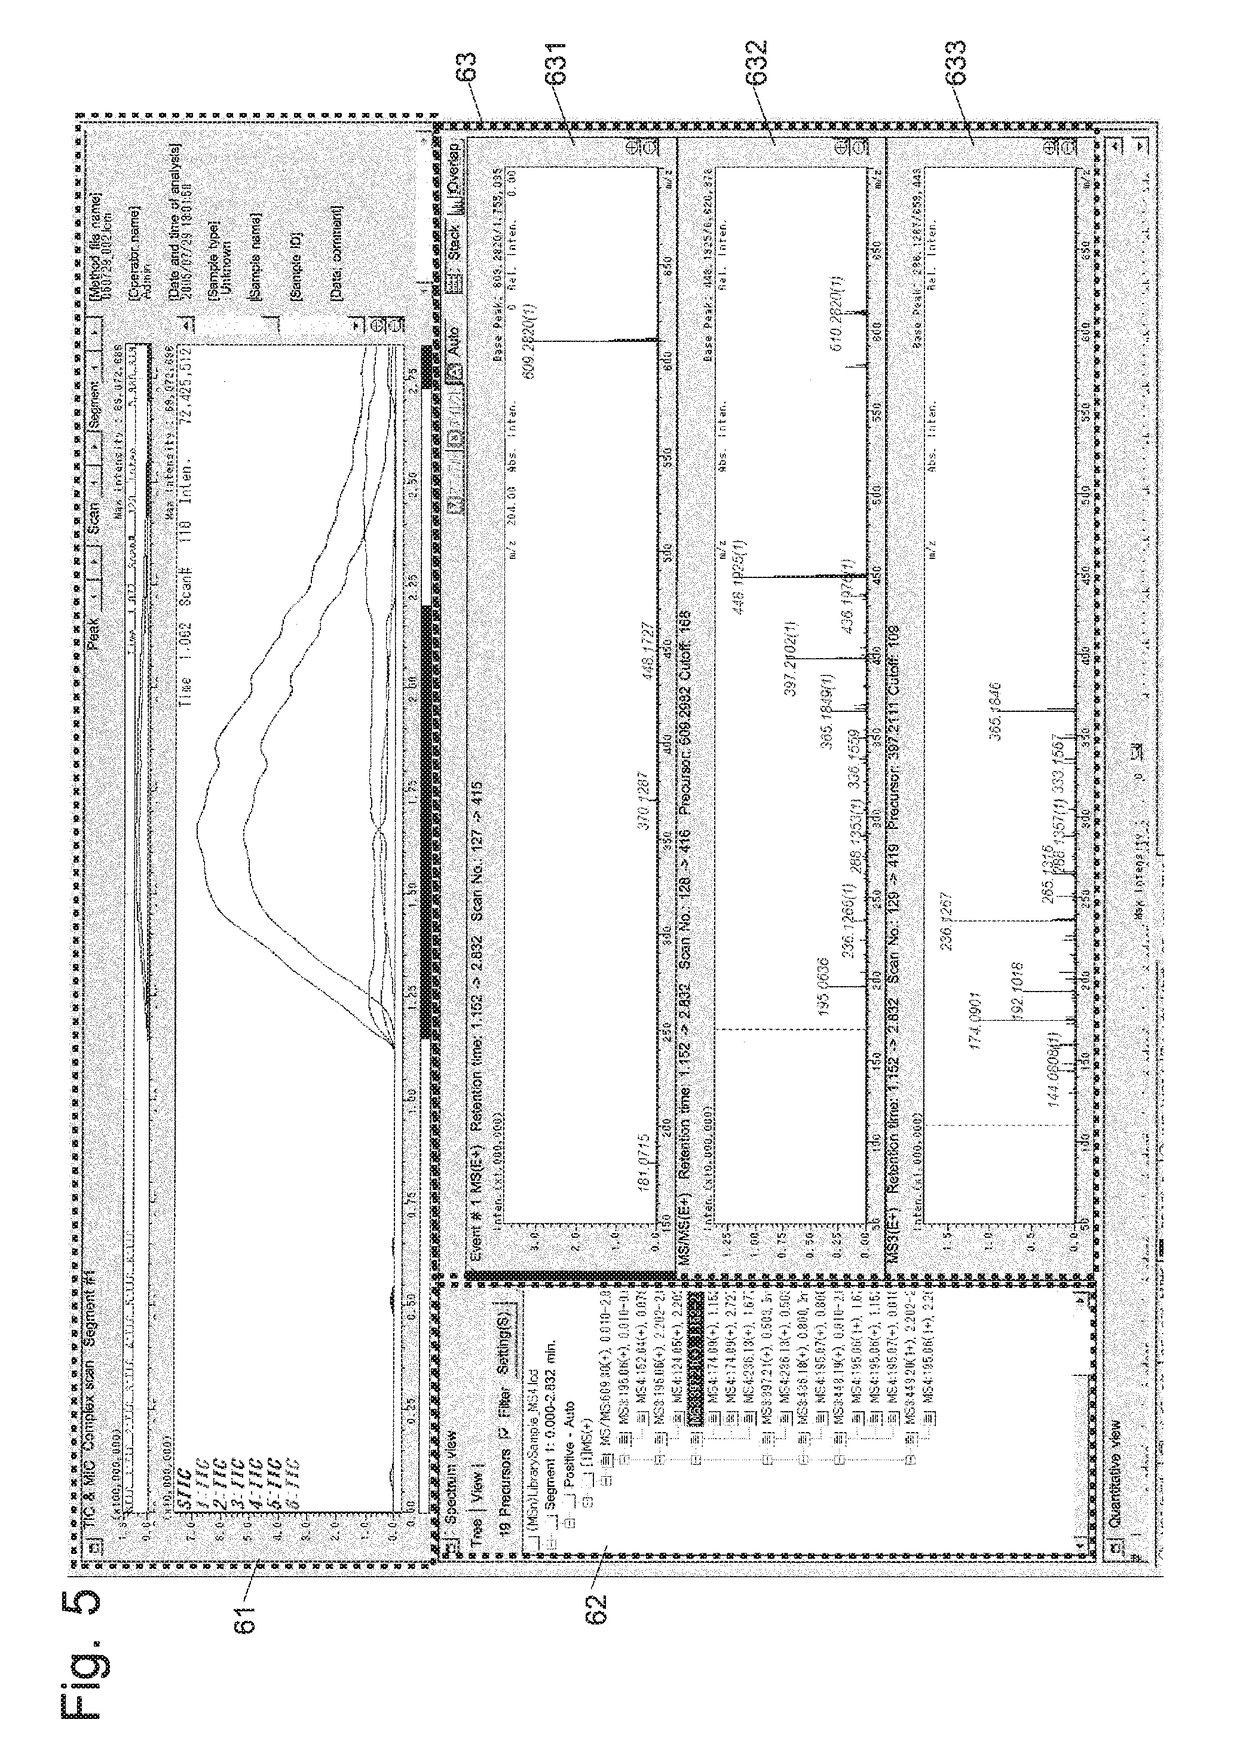
Furthermore, since there is only a limited space for the spectrum display area on the screen of the display unit, the display of a useless mass spectrum causes a decrease in the display size of the useful mass spectra on which sufficient ion intensities have been achieved, or a decrease in the size of another display area shown on the same display area (in the example of FIG. 6, the chromatogram display area 61 or spectrum tree display area 62).
Consequently, the mass-to-charge-ratio values on the mass spectra or other items of information becomes difficult to read, or details of the chromatogram curve become difficult to recognize.
These factors also lower the efficiency of the analyzing task.

Method used


Image

  • Mass spectrometer
  • Mass spectrometer
  • Mass spectrometer

Examples


Embodiment Construction

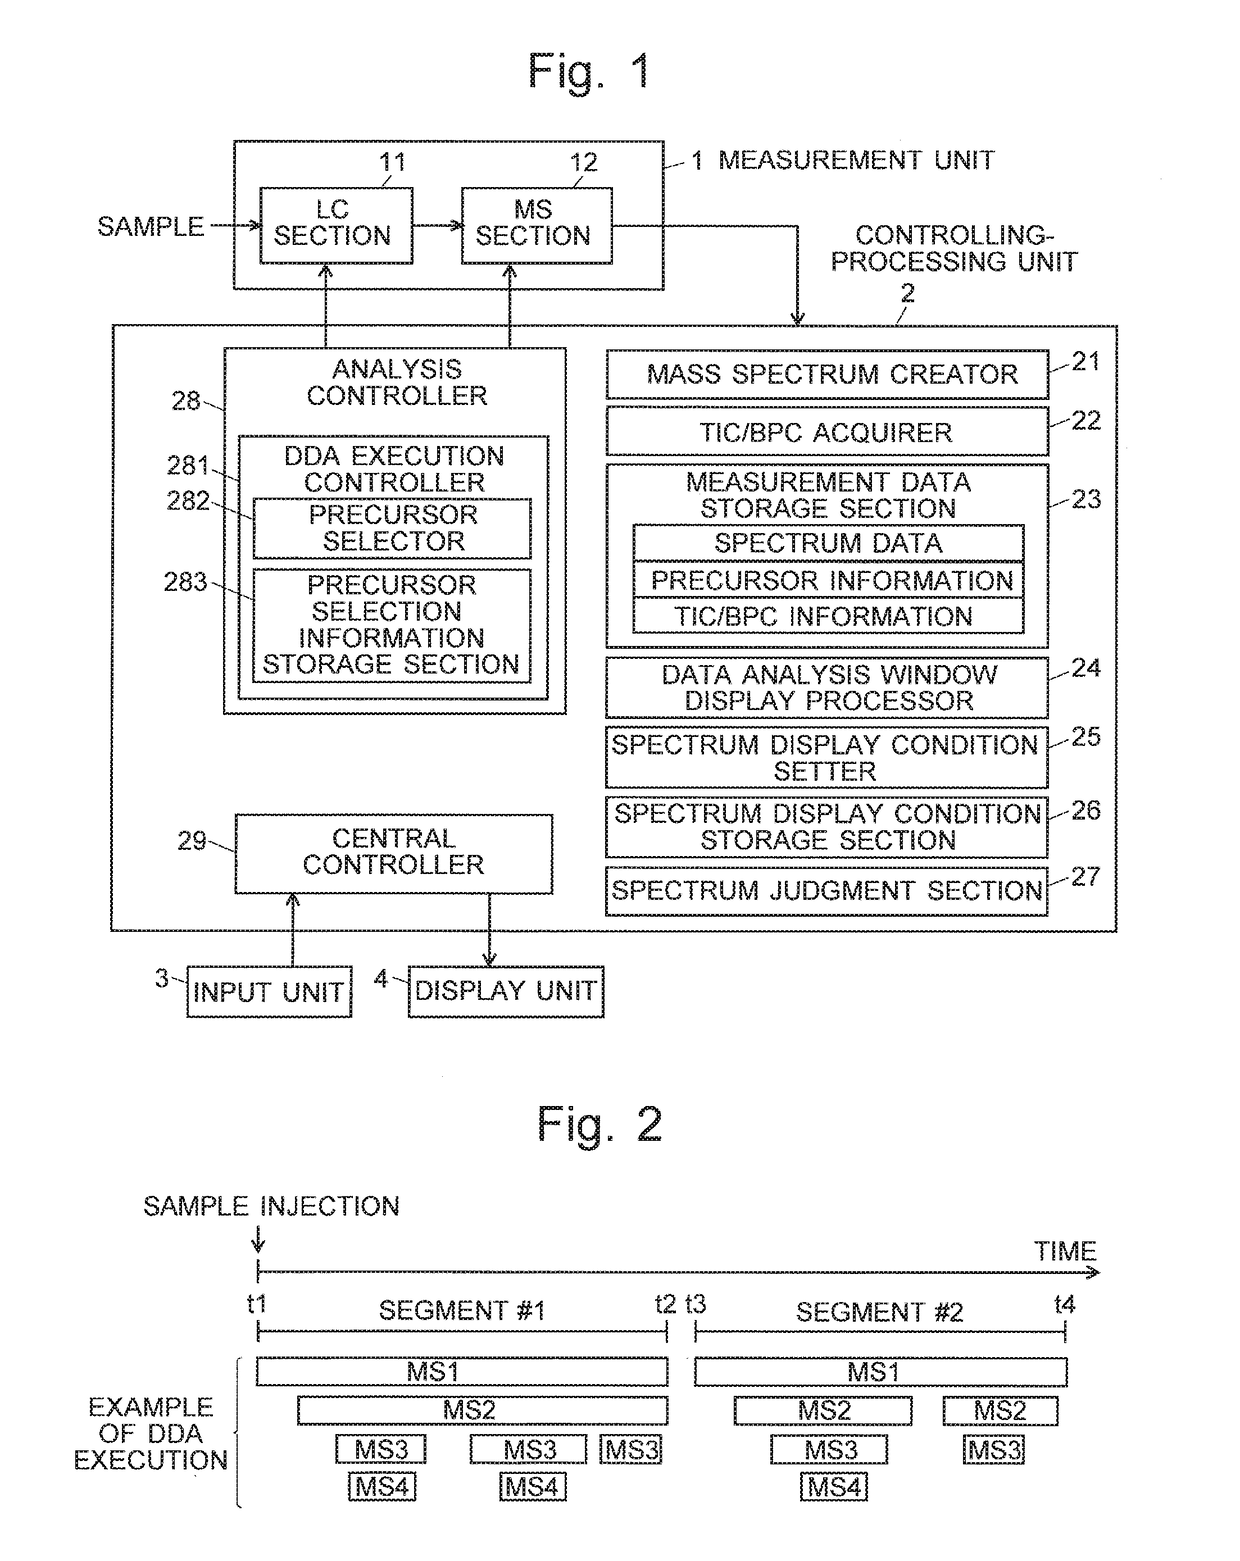
[0035]One embodiment of an LC-MS system using a mass spectrometer according to the present invention is hereinafter described with reference to the attached drawings. FIG. 1 is a schematic configuration diagram of the LC-MS system according to the present embodiment.

[0036]As shown in FIG. 1, the LC-MS system according to the present embodiment includes a measurement unit 1, controlling-processing unit 2, input unit 3 and display unit 4. The measurement unit 1 includes a liquid chromatograph (LC section) 11 in which a plurality of components contained in a liquid sample are temporally separated from each other, and a mass analyzer (MS section) 12 in which the separated components are further separated according to their mass-to-charge ratios m / z and detected. For example, the MS section 12 is a mass spectrometer which is provided with an ion source employing an atmospheric pressure ionization method, such as the electrospray ionization, and is capable of an MSn analysis, where n is a...


PUM

PropertyMeasurementUnit
mass spectrometeraaaaaaaaaa
massaaaaaaaaaa
triple quadrupole mass spectrometeraaaaaaaaaa

Abstract

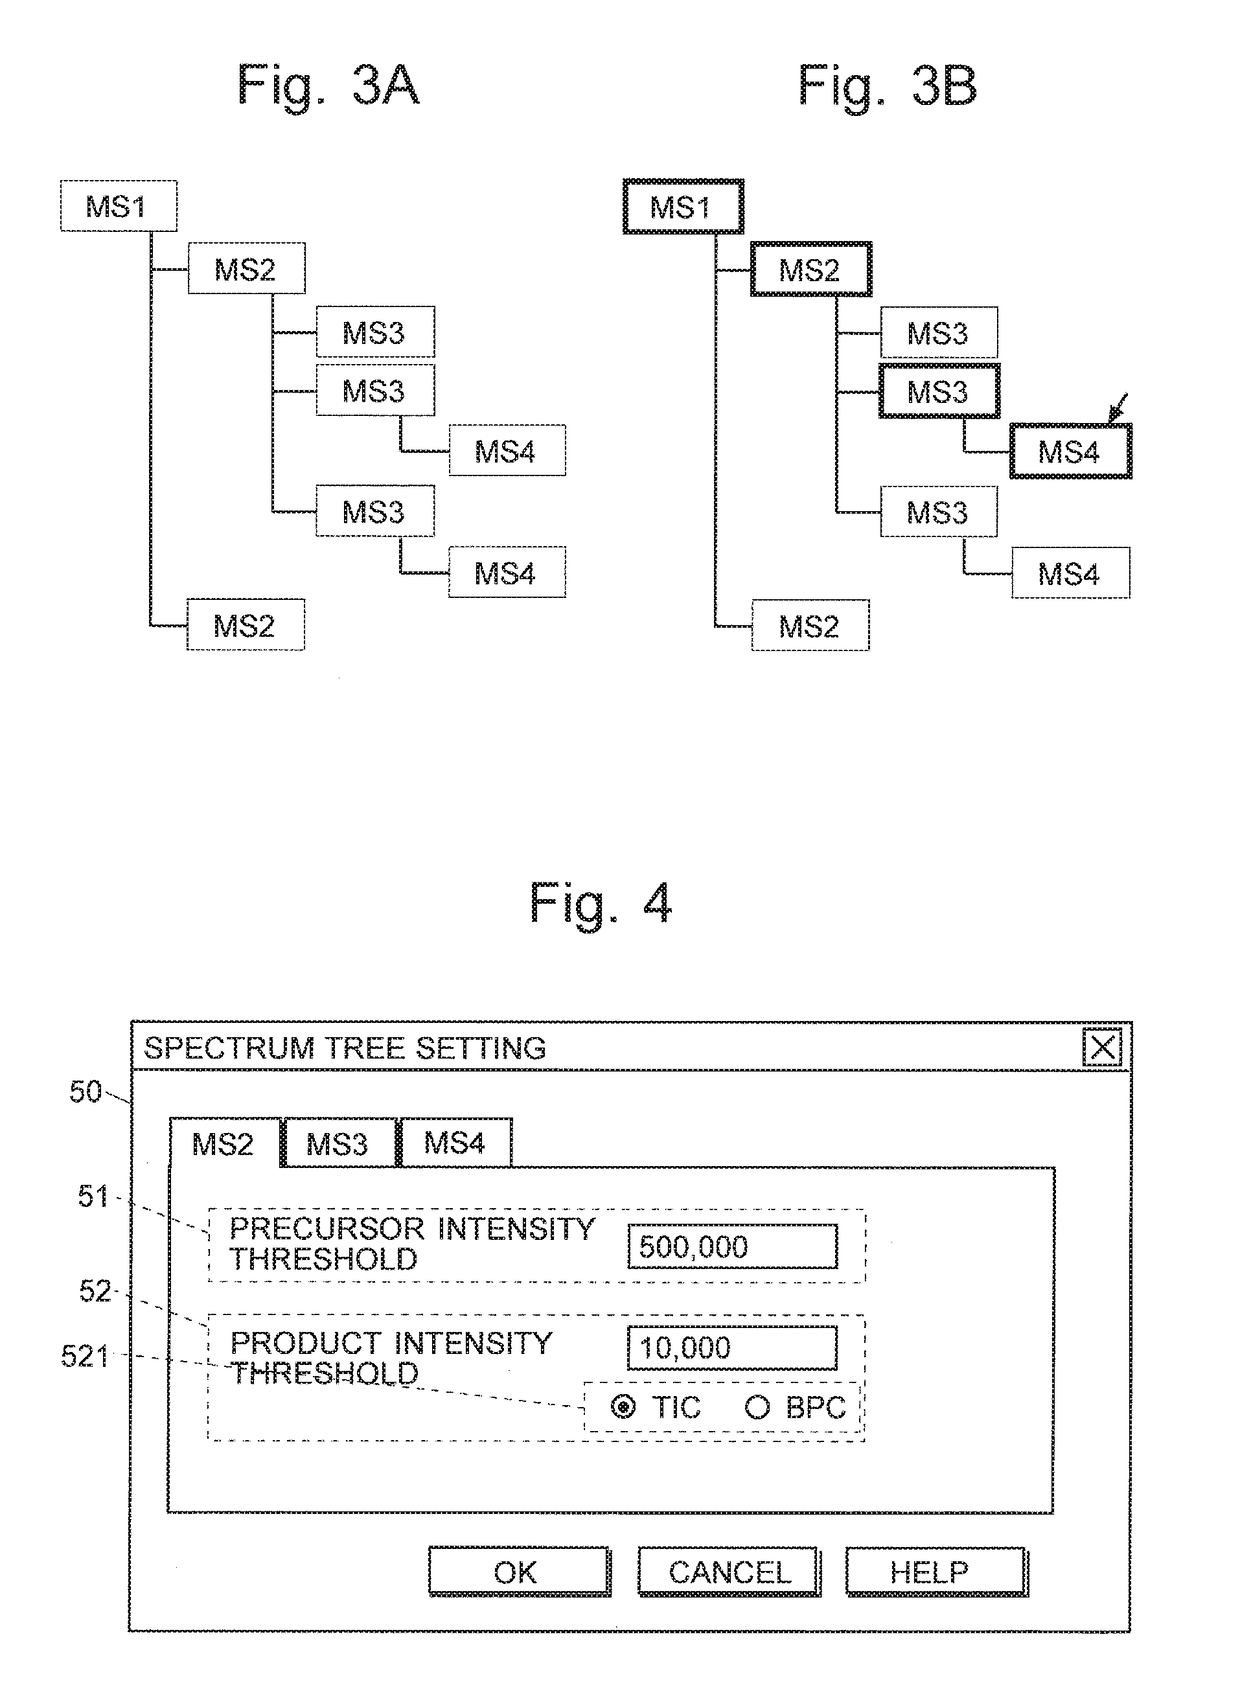
Under the control of a DDA (data dependent acquisition) execution controller (281), LC / MSn analysis data are acquired with a measurement unit (1) and stored in a measurement data storage section (23). In the case where the MSn analysis is automatically performed, a precursor ion intensity, TIC value and BPC value are also stored and related to the measurement data. In an analysis of the data, a spectrum display condition setter (25) displays, on a display unit (4), a setting window for allowing an analysis operator to enter a precursor ion intensity threshold as well as a product ion intensity threshold which is either the TIC or BPC value, and stores the entered values as a judgment condition in a spectrum display condition storage section (26). When an appropriate retention time is specified on a chromatogram displayed on the screen of the display unit (4), and if MSn spectrum data has already been acquired at that retention time, a spectrum judgment section (27) determines whether or not the precursor ion intensity and other relevant data related to the MSn spectrum data satisfy the judgment condition and selectively displays, on the screen of the display unit (4), only MSn spectra that satisfy the judgment condition. By this operation, useless MSn spectra with low ion intensities are excluded from the display.

Description

TECHNICAL FIELD[0001]The present invention relates to a mass spectrometer capable of an MSn analysis (where n is an integer equal to or greater than two), and more specifically, to a mass spectrometer suitable for a chromatograph mass spectrometer in which a mass spectrometer is used as the detector for a liquid chromatograph (LC) or gas chromatograph (GC).BACKGROUND ART[0002]In a triple quadrupole mass spectrometer, ion trap mass spectrometer or ion trap time-of-flight mass spectrometer, an MS / MS (=MS2) spectrum can be created by selecting, as a precursor ion, an ion having a specific mass-to-charge ratio m / z from various ions originating from a component to be analyzed, dissociating the precursor ion by collision induced dissociation (CID), and performing a mass spectrometric analysis on the generated product ions. In the case of the ion trap mass spectrometer or ion trap time-of-flight mass spectrometer, an MSn spectrum with n being equal to or greater than three can also be crea...

Claims


Application Information

Patent Timeline
Patent Type & Authority Applications(United States)
IPC IPC(8): G01N27/62H01J49/00G01N30/72H01J49/04
CPCG01N27/62H01J49/004G01N30/7206G01N30/7233H01J49/04H01J49/0036
Inventor YASUDA, HIROYUKI
Owner SHIMADZU CORP
Learn More