Methods of prognosis and diagnosis of ovarian cancer
a prognosis and diagnosis technology, applied in the field of ovarian cancer prognosis and diagnosis, can solve the problem that the number of slides available from each sample does not permit staining, and achieve the effect of improving survival rates
- Summary
- Abstract
- Description
- Claims
- Application Information
AI Technical Summary
Benefits of technology
Problems solved by technology
Method used
Image
Examples
example 1
New Tumor Types Revealed in Ovarian Cancer by High-Dimensional Mass Cytometric Profiling
INTRODUCTION
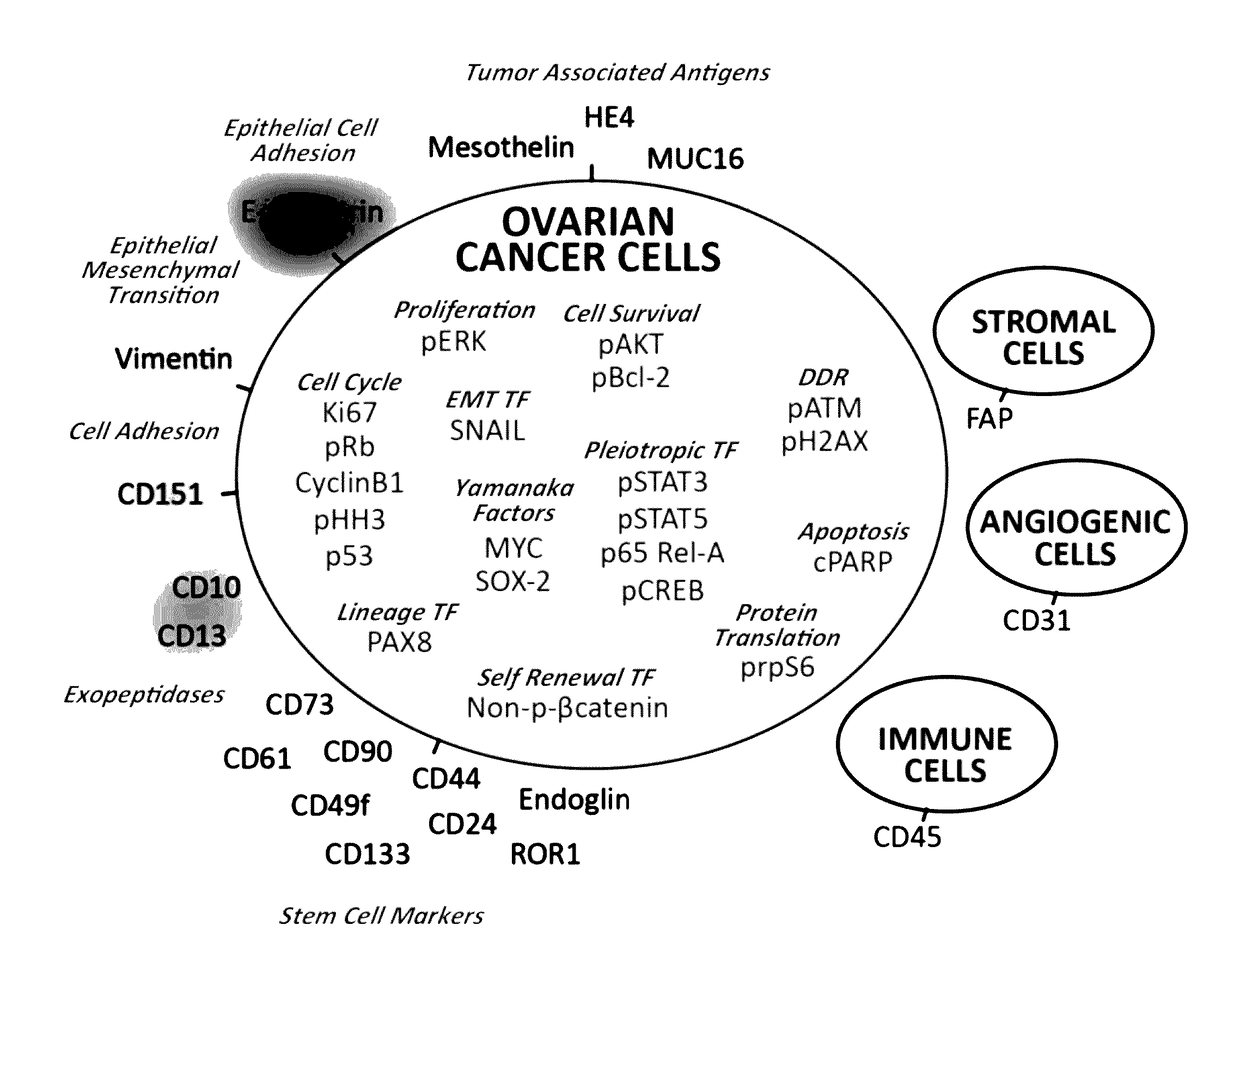
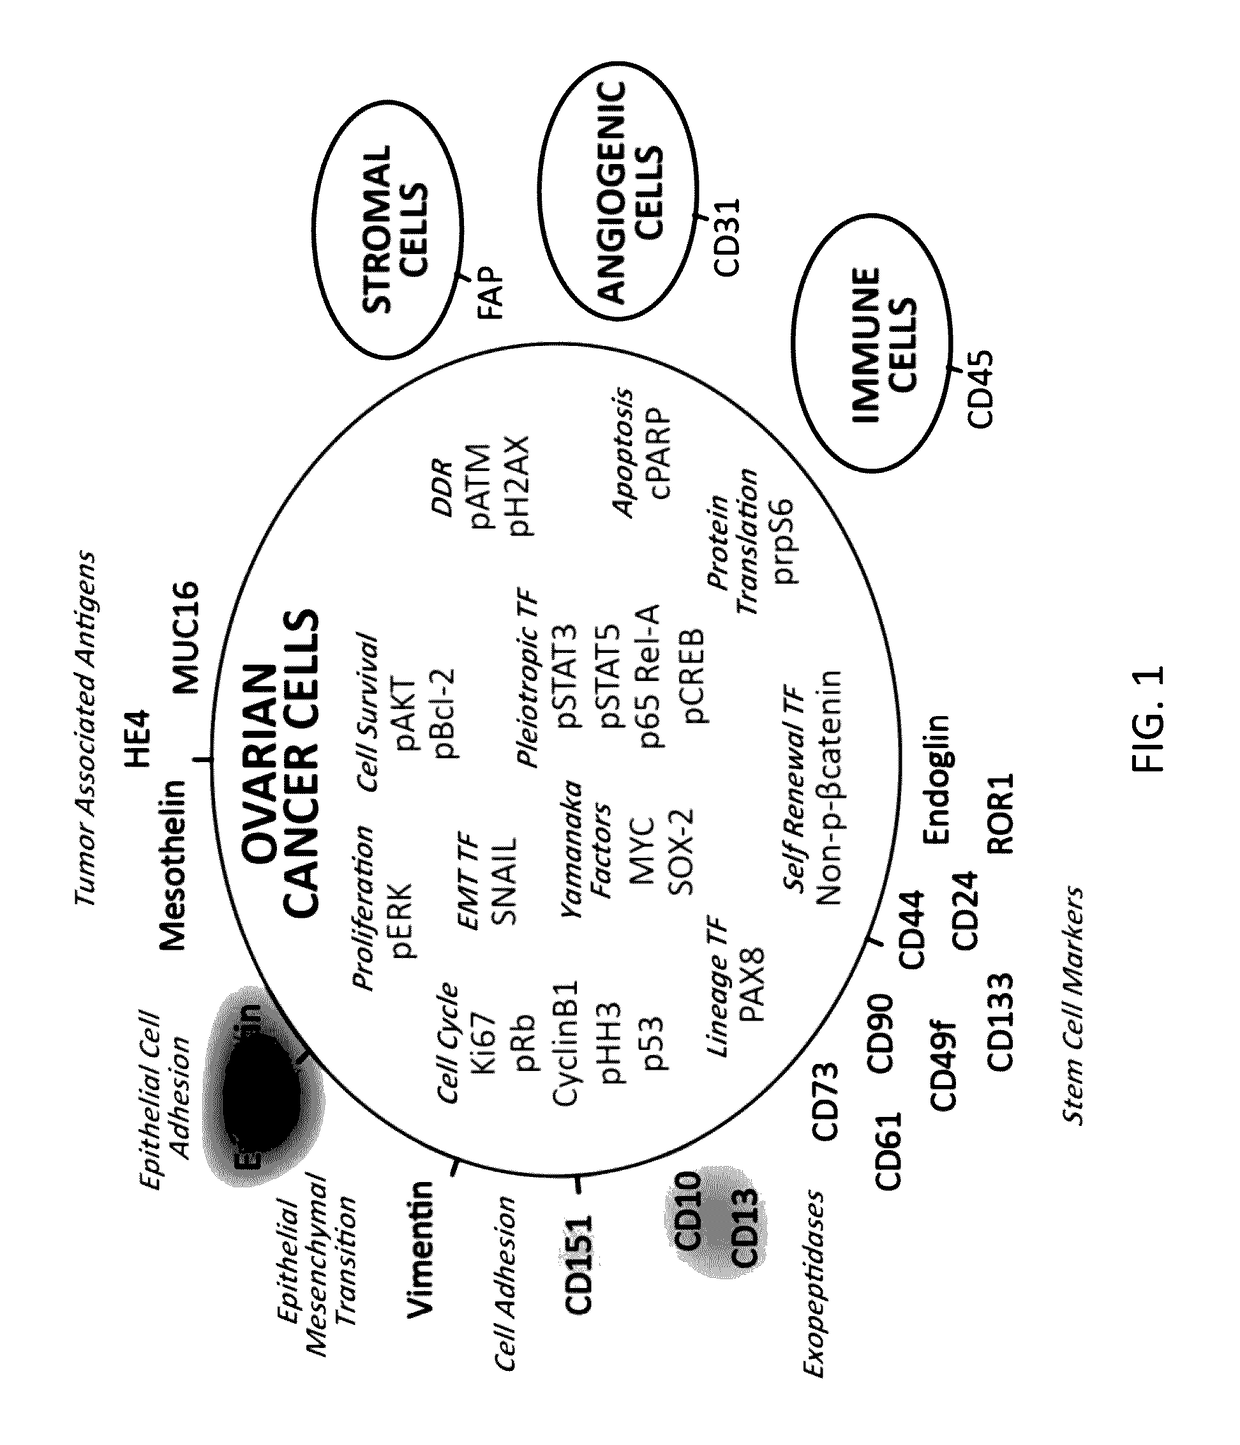
[0091]High-grade serous ovarian cancer (HG-SOC) has been treated clinically as a single disease with most patients receiving the same standard-of-care therapies (Liu & Matulonis (2014) Clin Cancer Res 20:5150-5156), even though genetic, molecular and protein expression studies indicate that HG-SOC tumors display a high degree of inter- and intra-tumor heterogeneity (Integrated genomic analyses of ovarian carcinoma. Cancer Genome Atlas Research Network (2011) Nature 474:609-615; Bowtell et al. (2015) Nat. Rev. Cancer 15:668-679; Patch et al. (2015) Nature 521:489-494). This is underscored by the fact there is a paucity of predictive and prognostic mechanistic markers that truly reflect HG-SOC pathophysiology. To gain deeper insight into HG-SOC heterogeneity we studied primary ovarian tumors using mass cytometry, a high-dimensional single cell technology that facilitates the identificat...
example 2
Identification of a Single Cell Subset in Primary Ovarian Cancer as a Predictor of Relapse
Introduction
[0122]Here we report a specific tumor cell subset that is predictive of time from diagnosis to relapse for ovarian cancer. The identity of these cells was enabled by single-cell high dimensional mass cytometry as described in Example 1. These data can be adapted to a three-color flow cytometry, immunohistochemistry or immunofluorescence test.
Results
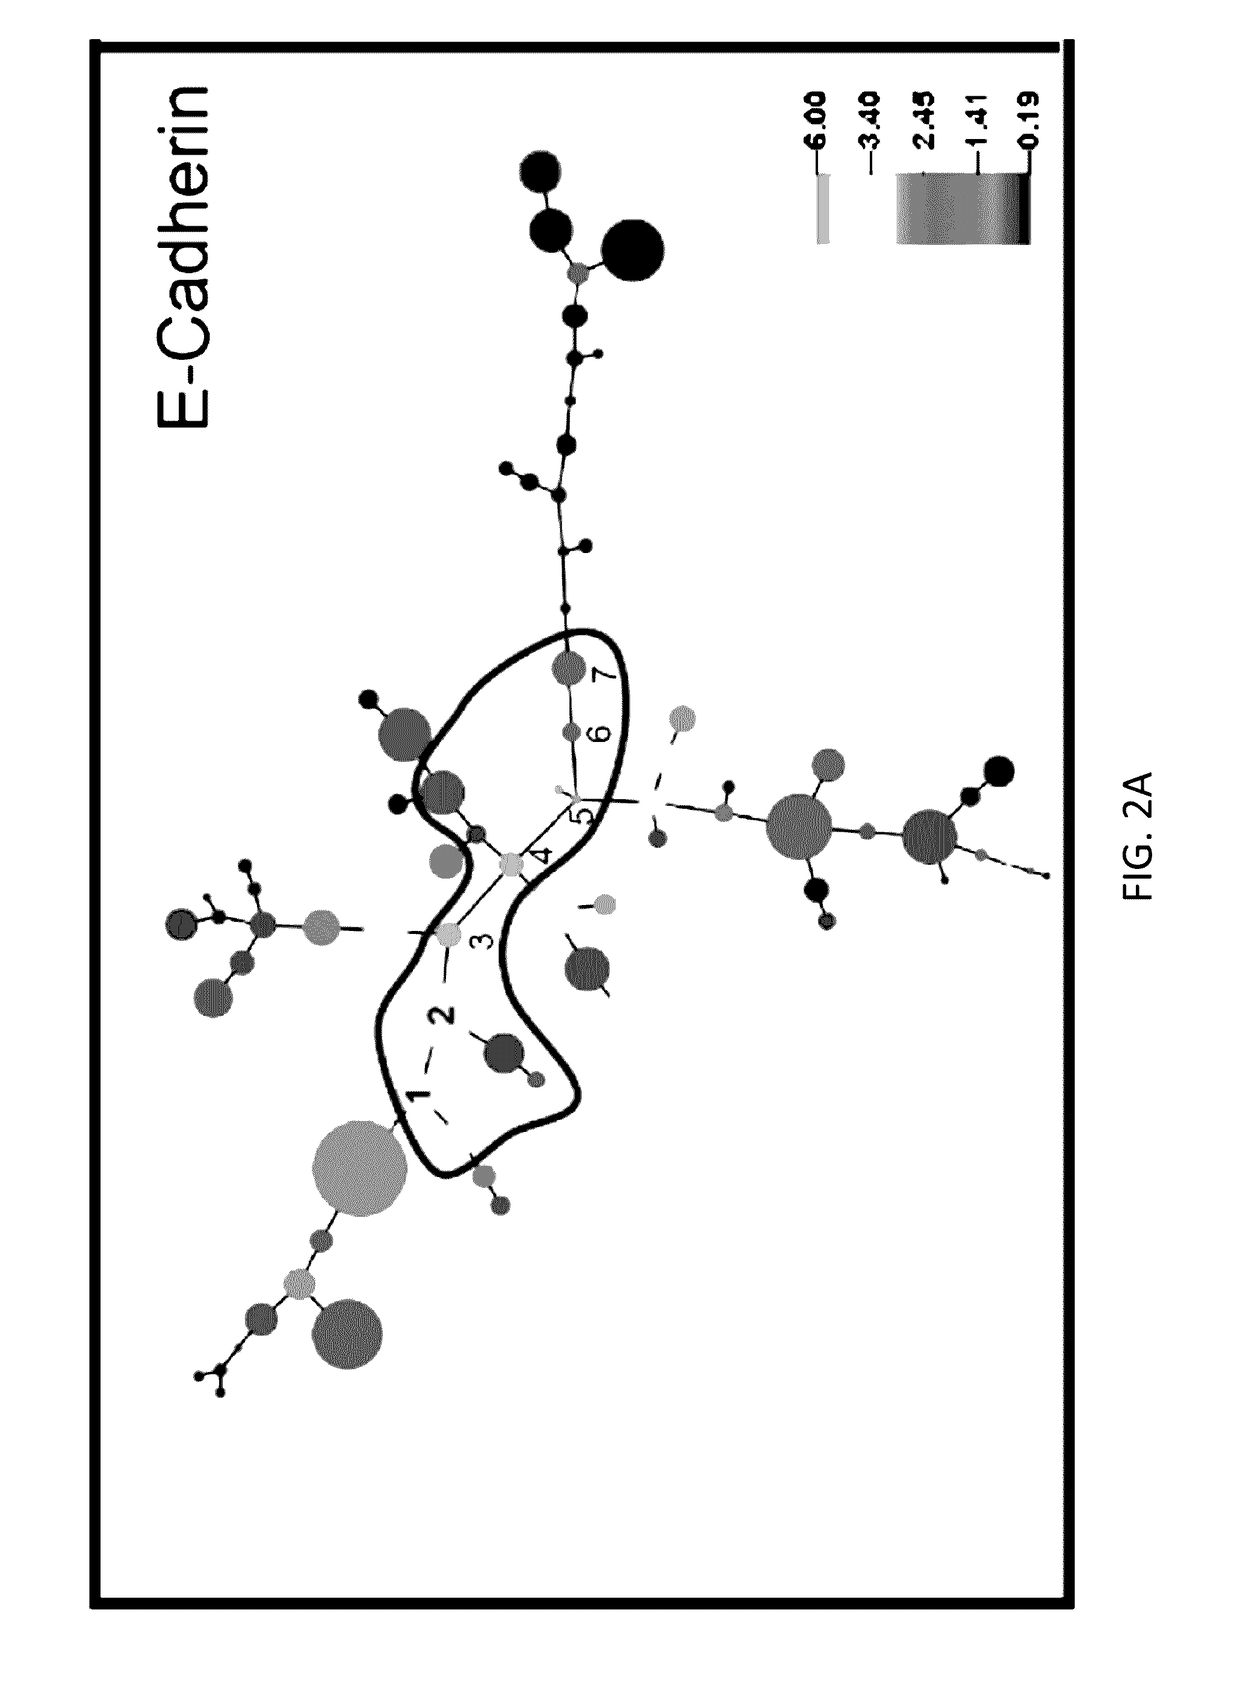
[0123]Single-cell analysis of diagnostic chemotherapy-primary HG-SOC specimens produced the following observations: Samples were analyzed using a clustering algorithm that grouped cells together with similarity of their maker co-expression patterns in high dimensions. Data from points 2 to 11 is from the clustering analysis and from points 12 to X is based on hand-gating, the gold standard for analysis of flow cytometry data. The bulk of cells in each tumor expressed E-cadherin, a hallmark of the epithelial phenotype. A small number of ce...
PUM
| Property | Measurement | Unit |
|---|---|---|
| time | aaaaa | aaaaa |
| time | aaaaa | aaaaa |
| frequency | aaaaa | aaaaa |
Abstract
Description
Claims
Application Information
 - R&D
- Intellectual Property
- Life Sciences
- Materials
- Tech Scout
- Unparalleled Data Quality
- Higher Quality Content
- 60% Fewer Hallucinations
Browse by: Latest US Patents, China's latest patents, Technical Efficacy Thesaurus, Application Domain, Technology Topic, Popular Technical Reports.
© 2025 PatSnap. All rights reserved.Legal|Privacy policy|Modern Slavery Act Transparency Statement|Sitemap|About US| Contact US: help@patsnap.com


