
Quantitative assessment of biological impact using overlap methods

a biological network and overlap technology, applied in the field of quantitative assessment of biological impact using overlap methods, to achieve the effects of increasing the specificity of hyps, reducing cross-network redundancy, and increasing the abundance of activation

Inactive Publication Date: 2016-11-03
GENSTRUCT
View PDF1 Cites 5 Cited by
  • Summary
  • Abstract
  • Description
  • Claims
  • Application Information

AI Technical Summary

Benefits of technology

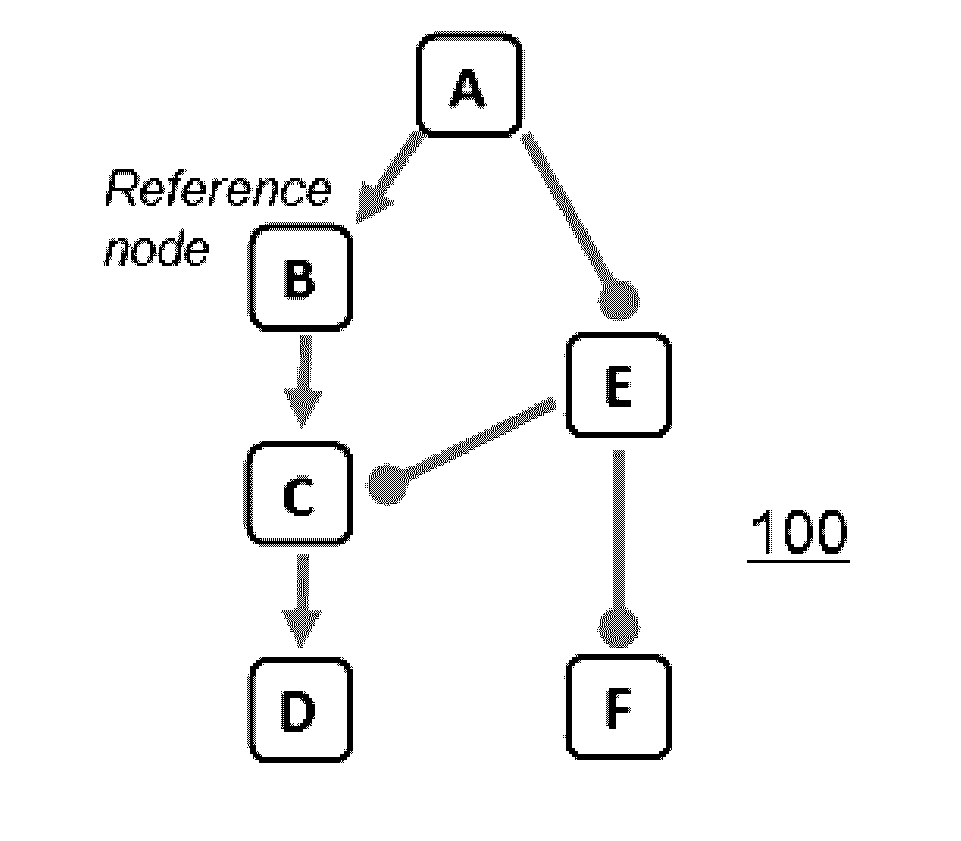
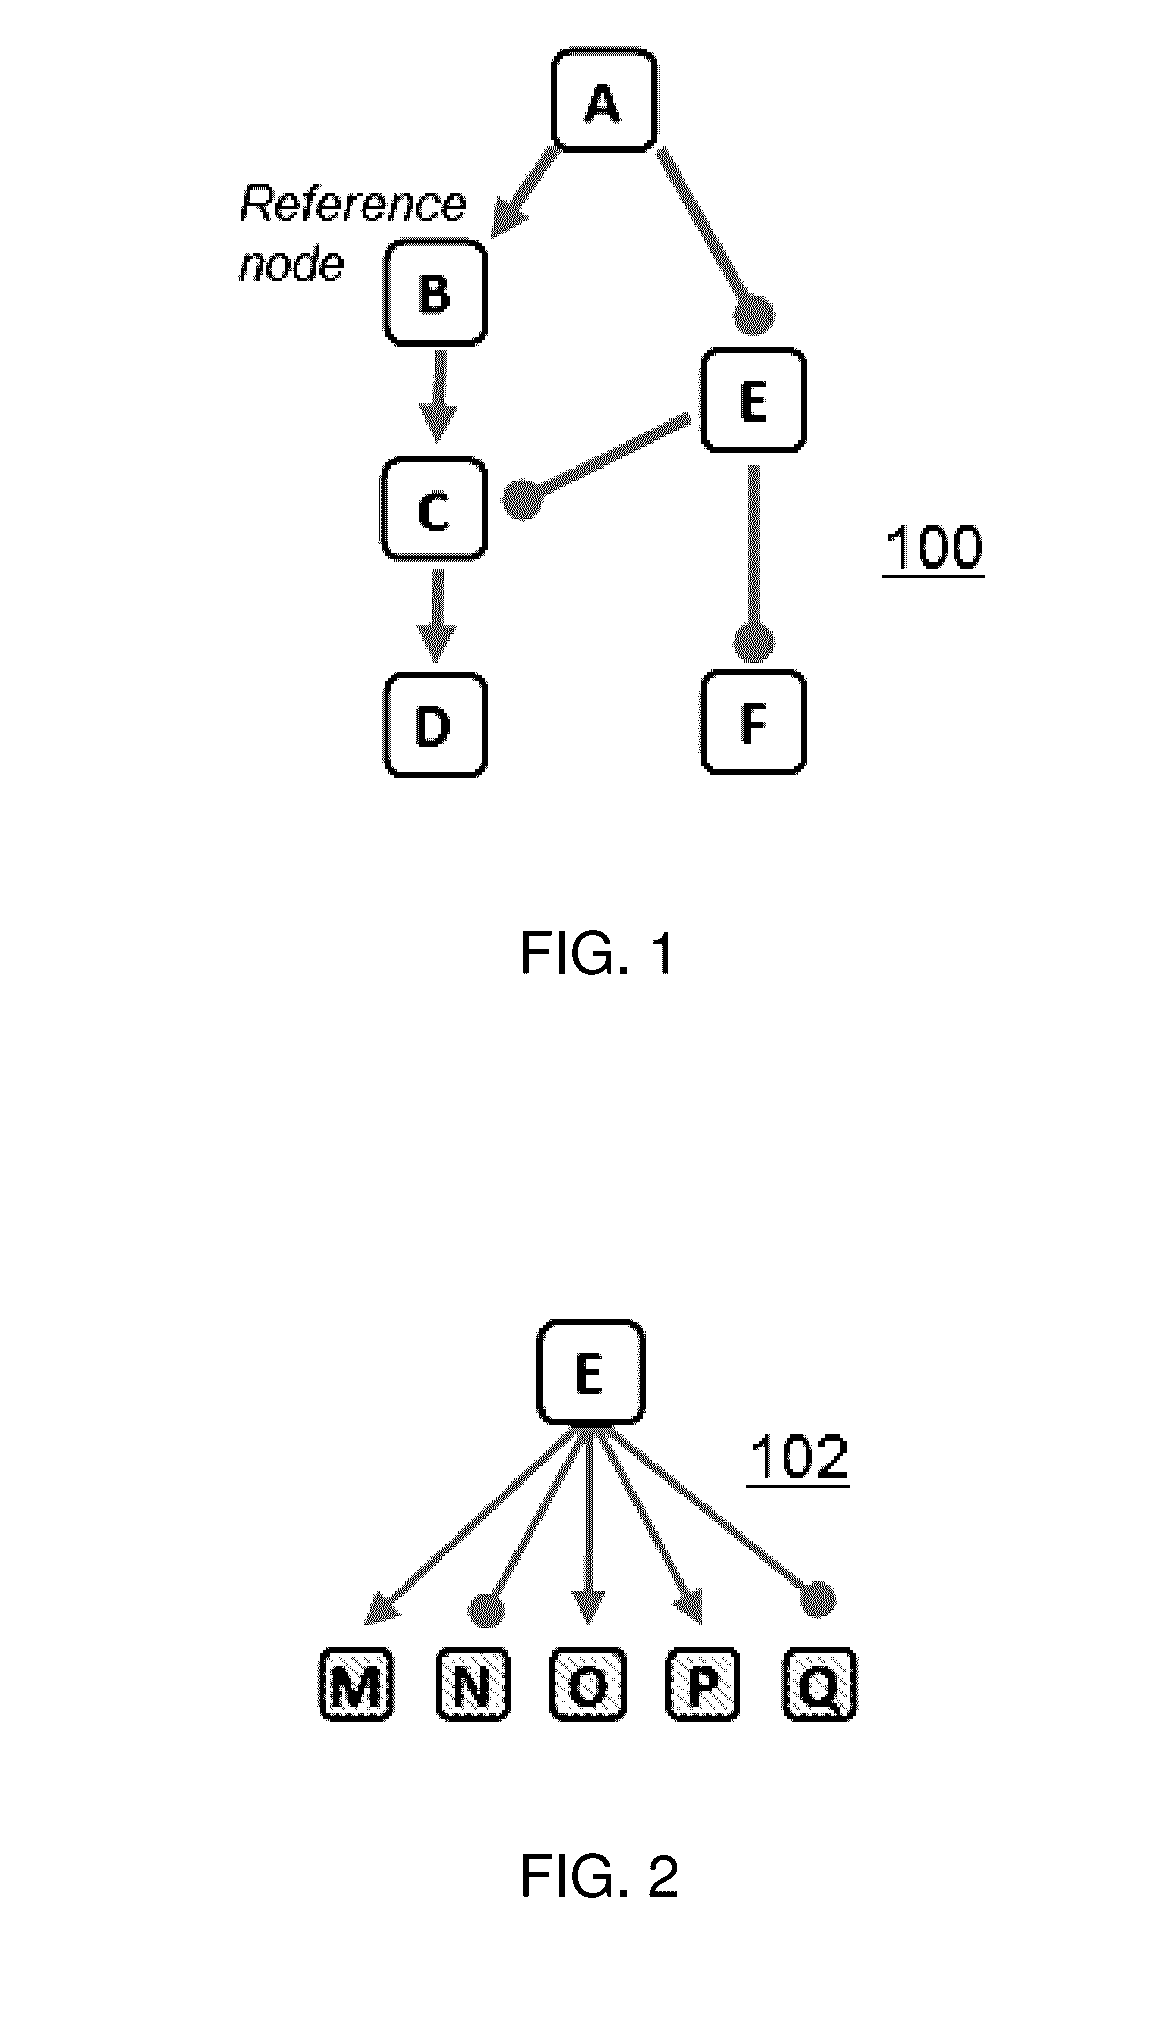
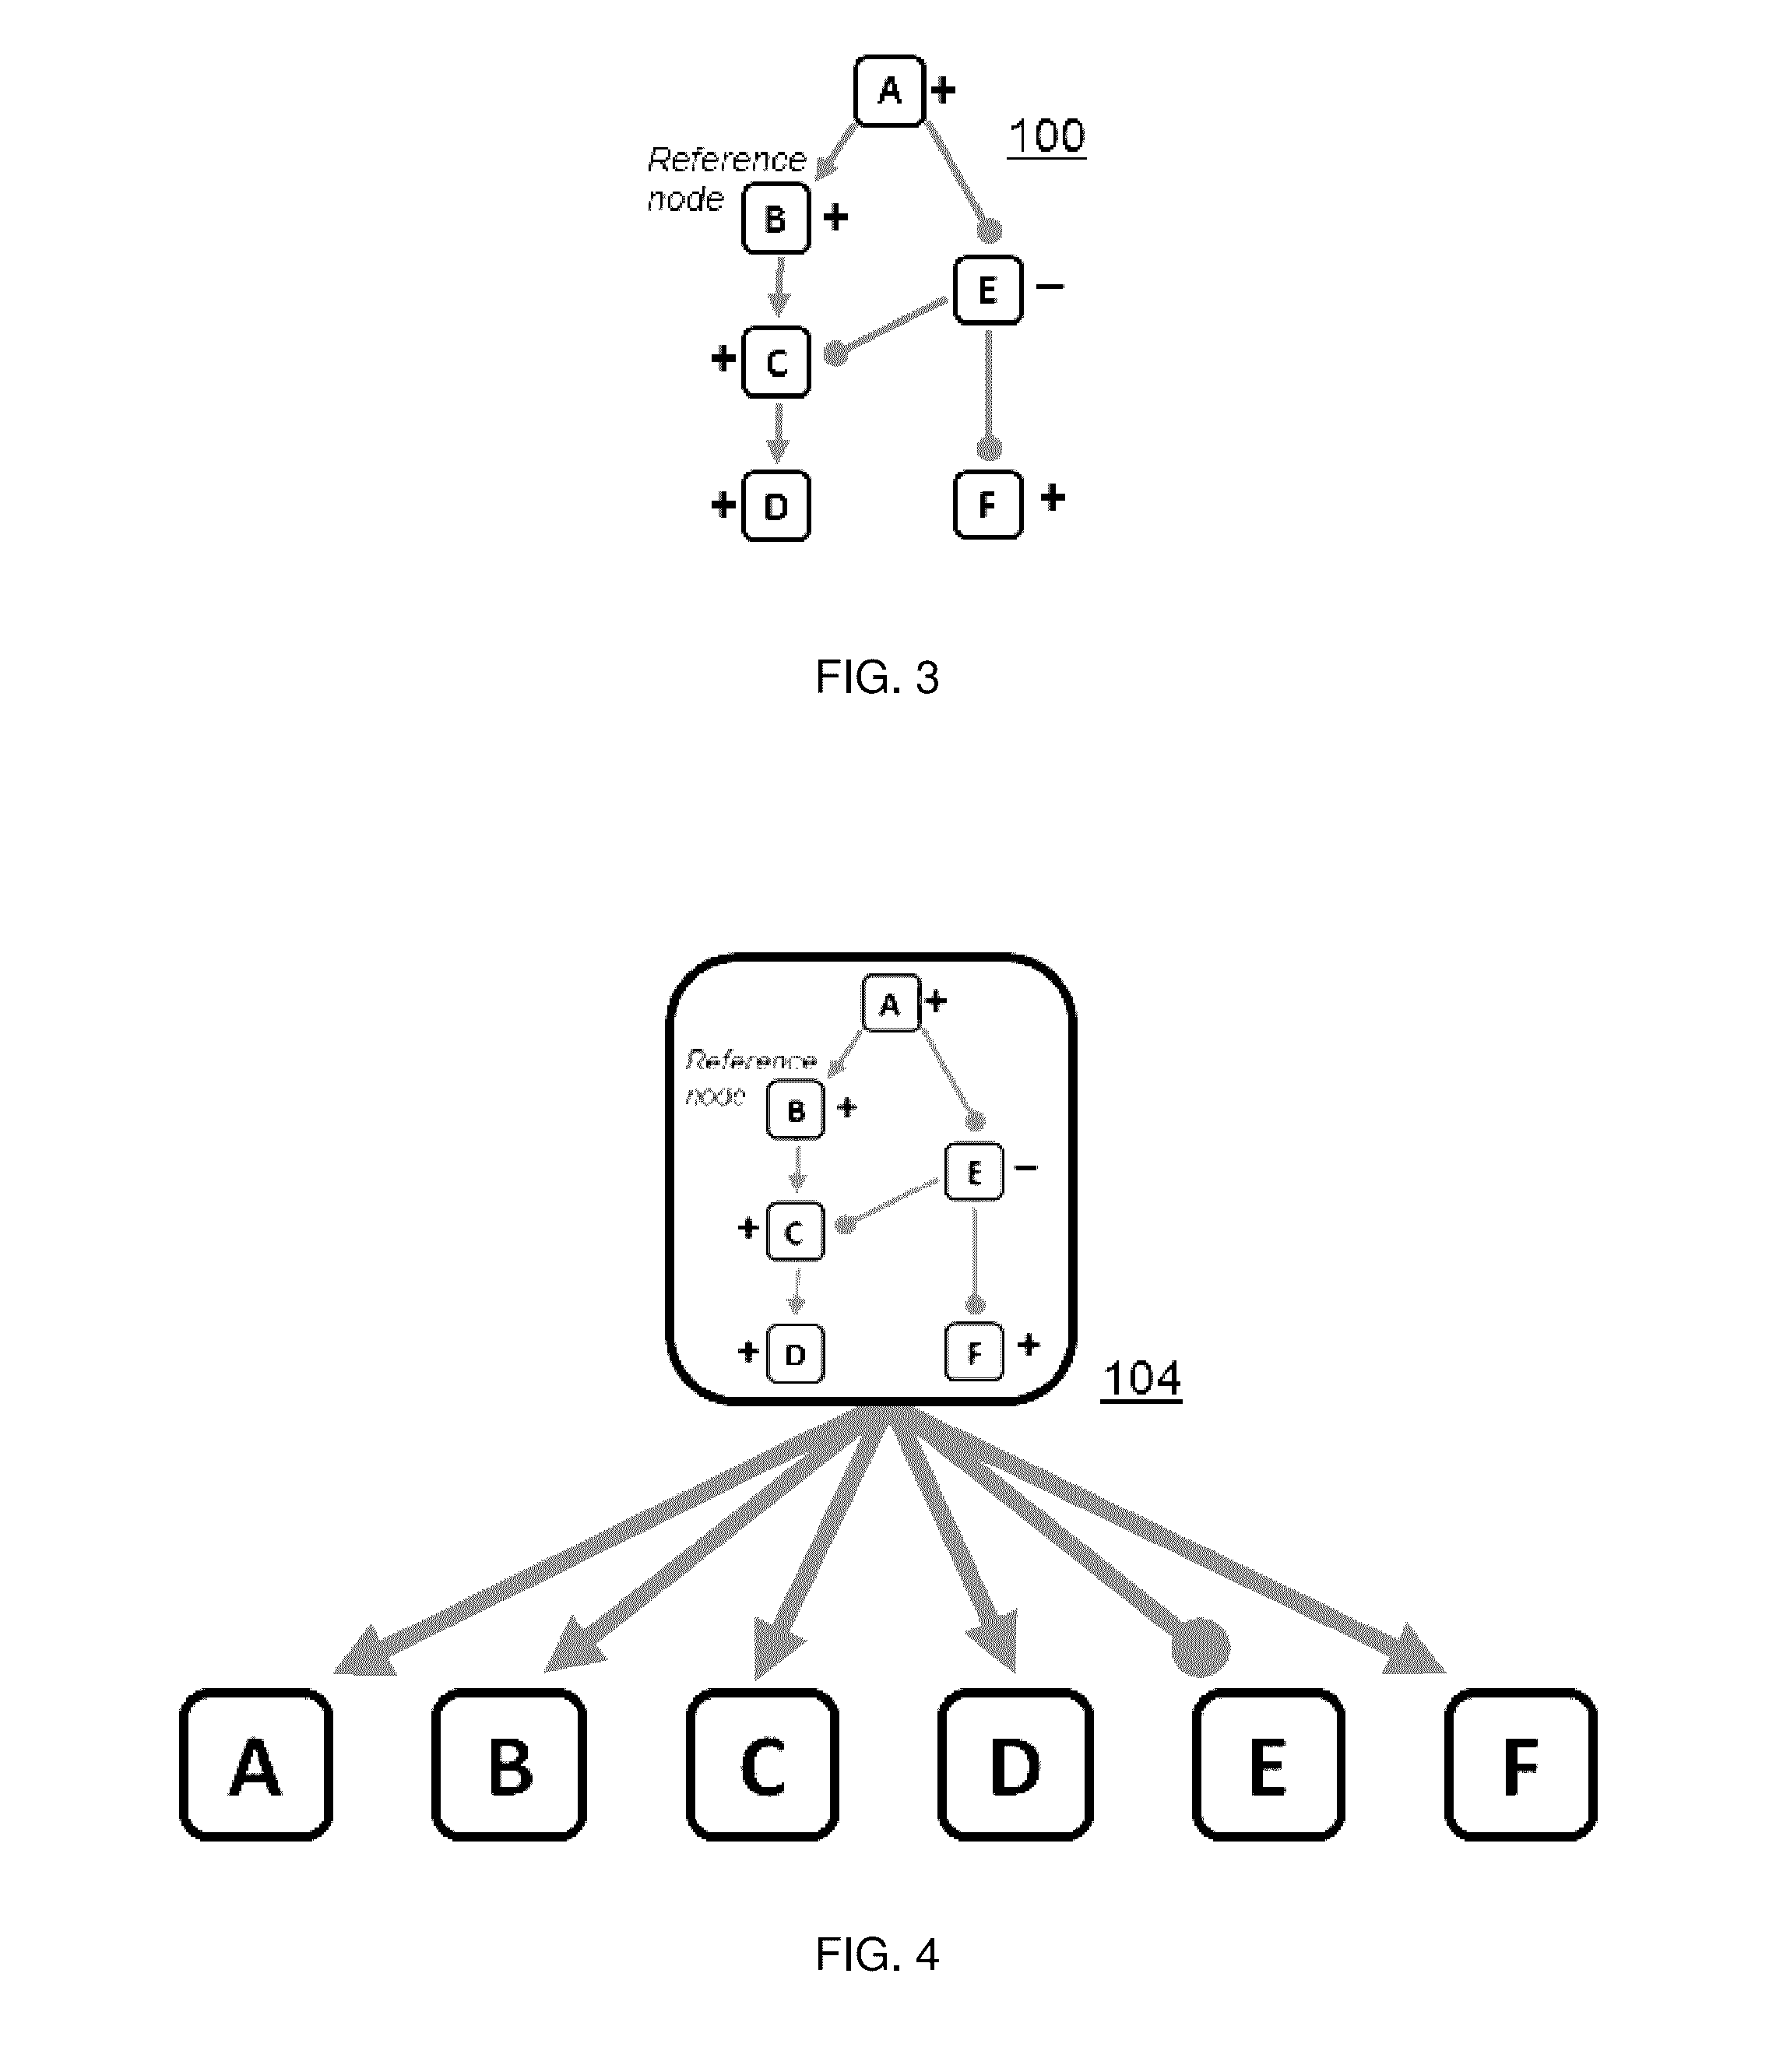
[0009]A “HYP” is a particular type of network where one “source” node is connected to a set of measurable downstream nodes via causal edges. Typically, a HYP is a specific type of network model comprised of a set of causal relationships connecting a node representing a particular biological activity (e.g., the increase in abundance of activation of a particular kinase, or a more complex network model describing a growth factor signaling pathway) to measurable downstream entities (e.g., gene expression values) that it positively or negatively regulates. According to one aspect of this disclosure, scores for HYPS are computed across multiple networks by accounting for an overlap between these HYPs in a manner that reduces cross-network redundancy and increases the specificity of the HYPs for the network in which they are found. Preferably, this process provides weights for each gene in each HYP across all the networks.
[0010]According to another aspect of this disclosure, a meta-HYP is created for networks by accounting for the occurrence of HYPS that are found in multiple networks in a manner that reduces the redundancy across networks and that increases the specificity of the network meta-HYPs. Preferably, this process provides additional weighting factors for each node in the network meta-HYP.

Problems solved by technology

Furthermore, while it may not be possible to easily measure some of the nodes in a network, it may be possible to obtain a score for some of these nodes that have an associated signature of measurements.

Method used


Image

  • Quantitative assessment of biological impact using overlap methods
  • Quantitative assessment of biological impact using overlap methods
  • Quantitative assessment of biological impact using overlap methods

Examples


Embodiment Construction

[0021]As used herein, the following terms have the following definitions:

[0022]A “knowledge base” is a directed network, preferably of experimentally-observed casual relationships among biological entities and processes;

[0023]A “node” is a measurable entity or process;

[0024]A “measurement node” is a measured entity or process;

[0025]A “reference node” represents a potential perturbation to a node;

[0026]A “signature” is a collection of measurable node entities and their expected directions of change with respect to a reference node;

[0027]A “differential data set” is a data set that has data associated with a first condition, and data associated with a second condition distinct from the first condition;

[0028]A “fold change” is a number describing how much a quantity changes going from an initial to a final value, and is specifically computed by dividing the final value by the initial value;

[0029]A “signed graph” (i.e., a graph with a signed edge) is a representational structure that, i...


PUM


Abstract

Scores for particular network models (those having a source node connected to a set of measurable downstream nodes via causal edges) are computed across multiple networks by accounting for an overlap between these models in a manner that reduces cross-network redundancy and increases the specificity of the network models for the network in which they are found. According to another aspect, a meta-network model is created for networks by accounting for the occurrence of network models that are found in multiple networks in a manner that reduces the redundancy across networks and that increases the specificity of the network model score. Preferably, this process provides additional weighting factors for each node in the network model.

Description

TECHNICAL FIELD[0001]This disclosure relates generally to methods and techniques for characterizing the response of biological networks.BACKGROUND OF THE RELATED ART[0002]Networks provide a powerful framework for describing complex systems in many different areas, ranging from natural and social sciences to computer and electrical engineering. Their quantitative analysis is based on the concepts and properties studied in the mathematical field of graph theory. Leveraging this knowledge can help address challenging problems that arise in concrete situations.[0003]Signed graphs are used in a variety of disciplines including systems biology, where a signed edge relating two nodes may represent the positive or negative regulatory relationship between two biological entities within a network. Recent advances in experimental and computational techniques have enabled systems-wide measurement of biological entities such as gene expressions or protein activities, and facilitated their integr...

Claims


Application Information

Patent Timeline
Patent Type & Authority Applications(United States)
IPC IPC(8): G06F19/12G06F17/30G16B5/00
CPCG06F17/3053G06F19/12H04L41/145G06F16/24578G16B5/00
Inventor THOMSON, TY MATTHEWVASILYEV, DMITRYDRUBIN, DAVIDFRUSHOUR, BRIAN
Owner GENSTRUCT
Learn More