
Thyroid cancer biomarker

a biomarker and thyroid cancer technology, applied in the field of thyroid cancer biomarkers, can solve the problems of unneeded operations, difficult clinical classification of thyroid nodules, and difficulty in achieving clinical implementation in clinical settings

Inactive Publication Date: 2015-02-05
CORNELL UNIVERSITY +1
View PDF0 Cites 21 Cited by
  • Summary
  • Abstract
  • Description
  • Claims
  • Application Information

AI Technical Summary

Benefits of technology

The patent describes a system for identifying thyroid nodule malignancy using an algorithm based on the expression of biomarkers and reference genes. The system can produce a single malignancy score and a scalable cut-off threshold for accurate identification of malignant thyroid nodules. The biomarkers include NPC2, S100A11, SDC4, CD53, MET, GCSH, and CH13L1 while the reference genes include TBP, RPL13A, RPS13, HSP90A81, and YWHAZ. The system can also include replacement genes for experimentally validated genes and mathematic models for analysis. Overall, this technology provides a more reliable and accurate tool for identifying malignant thyroid nodules.

Problems solved by technology

There are challenges in clinical classification of thyroid nodules using traditional methods.
These challenges affect clinical decision making and lead to performance of unnecessary operations.
While some researchers have explored the use of novel molecular classification methods to overcome these challenges, these efforts are still far from implementation in clinical settings.
Although indeterminate, suspicious or non-diagnostic FNABs can be-repeated, these are only helpful for a small percentage of patients and require additional costs and invasive procedures.
Other efforts, such as studies using somatic mutations and / or gene rearrangements m malignant thyroid cells, have made limited progress.
However, most of these studies are only focused on simple microarray analysis and validation to identify genes that were differentially expressed between the benign and malignant groups.
Microarray-based assays, however, have some inherent, drawbacks.
They are sensitive to sample quality, which often presents challenges in a clinical setting.
Microarray-based technologies also require increased sample preparation time and complicated data analysis procedures.
However, direct use of microarrays resulted in many challenges in clinical settings, and although some important targets were observed, no consensus on how to translate observations made through microarray experiments into user-friendly clinical tests developed.
An additional drawback to the traditional direct use of microarrays was the standardization between different microarray platforms.
The use of different microarray platforms necessitates additional normalization and conversion work between platforms, making results less consistent and increasing the risk of errors.
Traditionally, the usage of discovery tools for classification limited their potential use for clinical diagnosis.
Marschall Stevens Range in his book “Principles of molecular medicine” states, “[u]nsupervised methods of analysis, including principal component analysis, hierarchical clustering, k-means clustering, and self-organizing maps, can be used as tools for class discovery.” Moreover, “[u]nsupervised approaches to determine differences in gene expression profiles among disease states have limitations that can be circumvented by the use of supervised learning methods.” The methods provided herein use supervised machine learning methods for the classification of malignant thyroid nodules and benign nodules and avoid the problems and limitations of previous methods.

Method used


Image

  • Thyroid cancer biomarker
  • Thyroid cancer biomarker
  • Thyroid cancer biomarker

Examples


example 1

qPCR Method

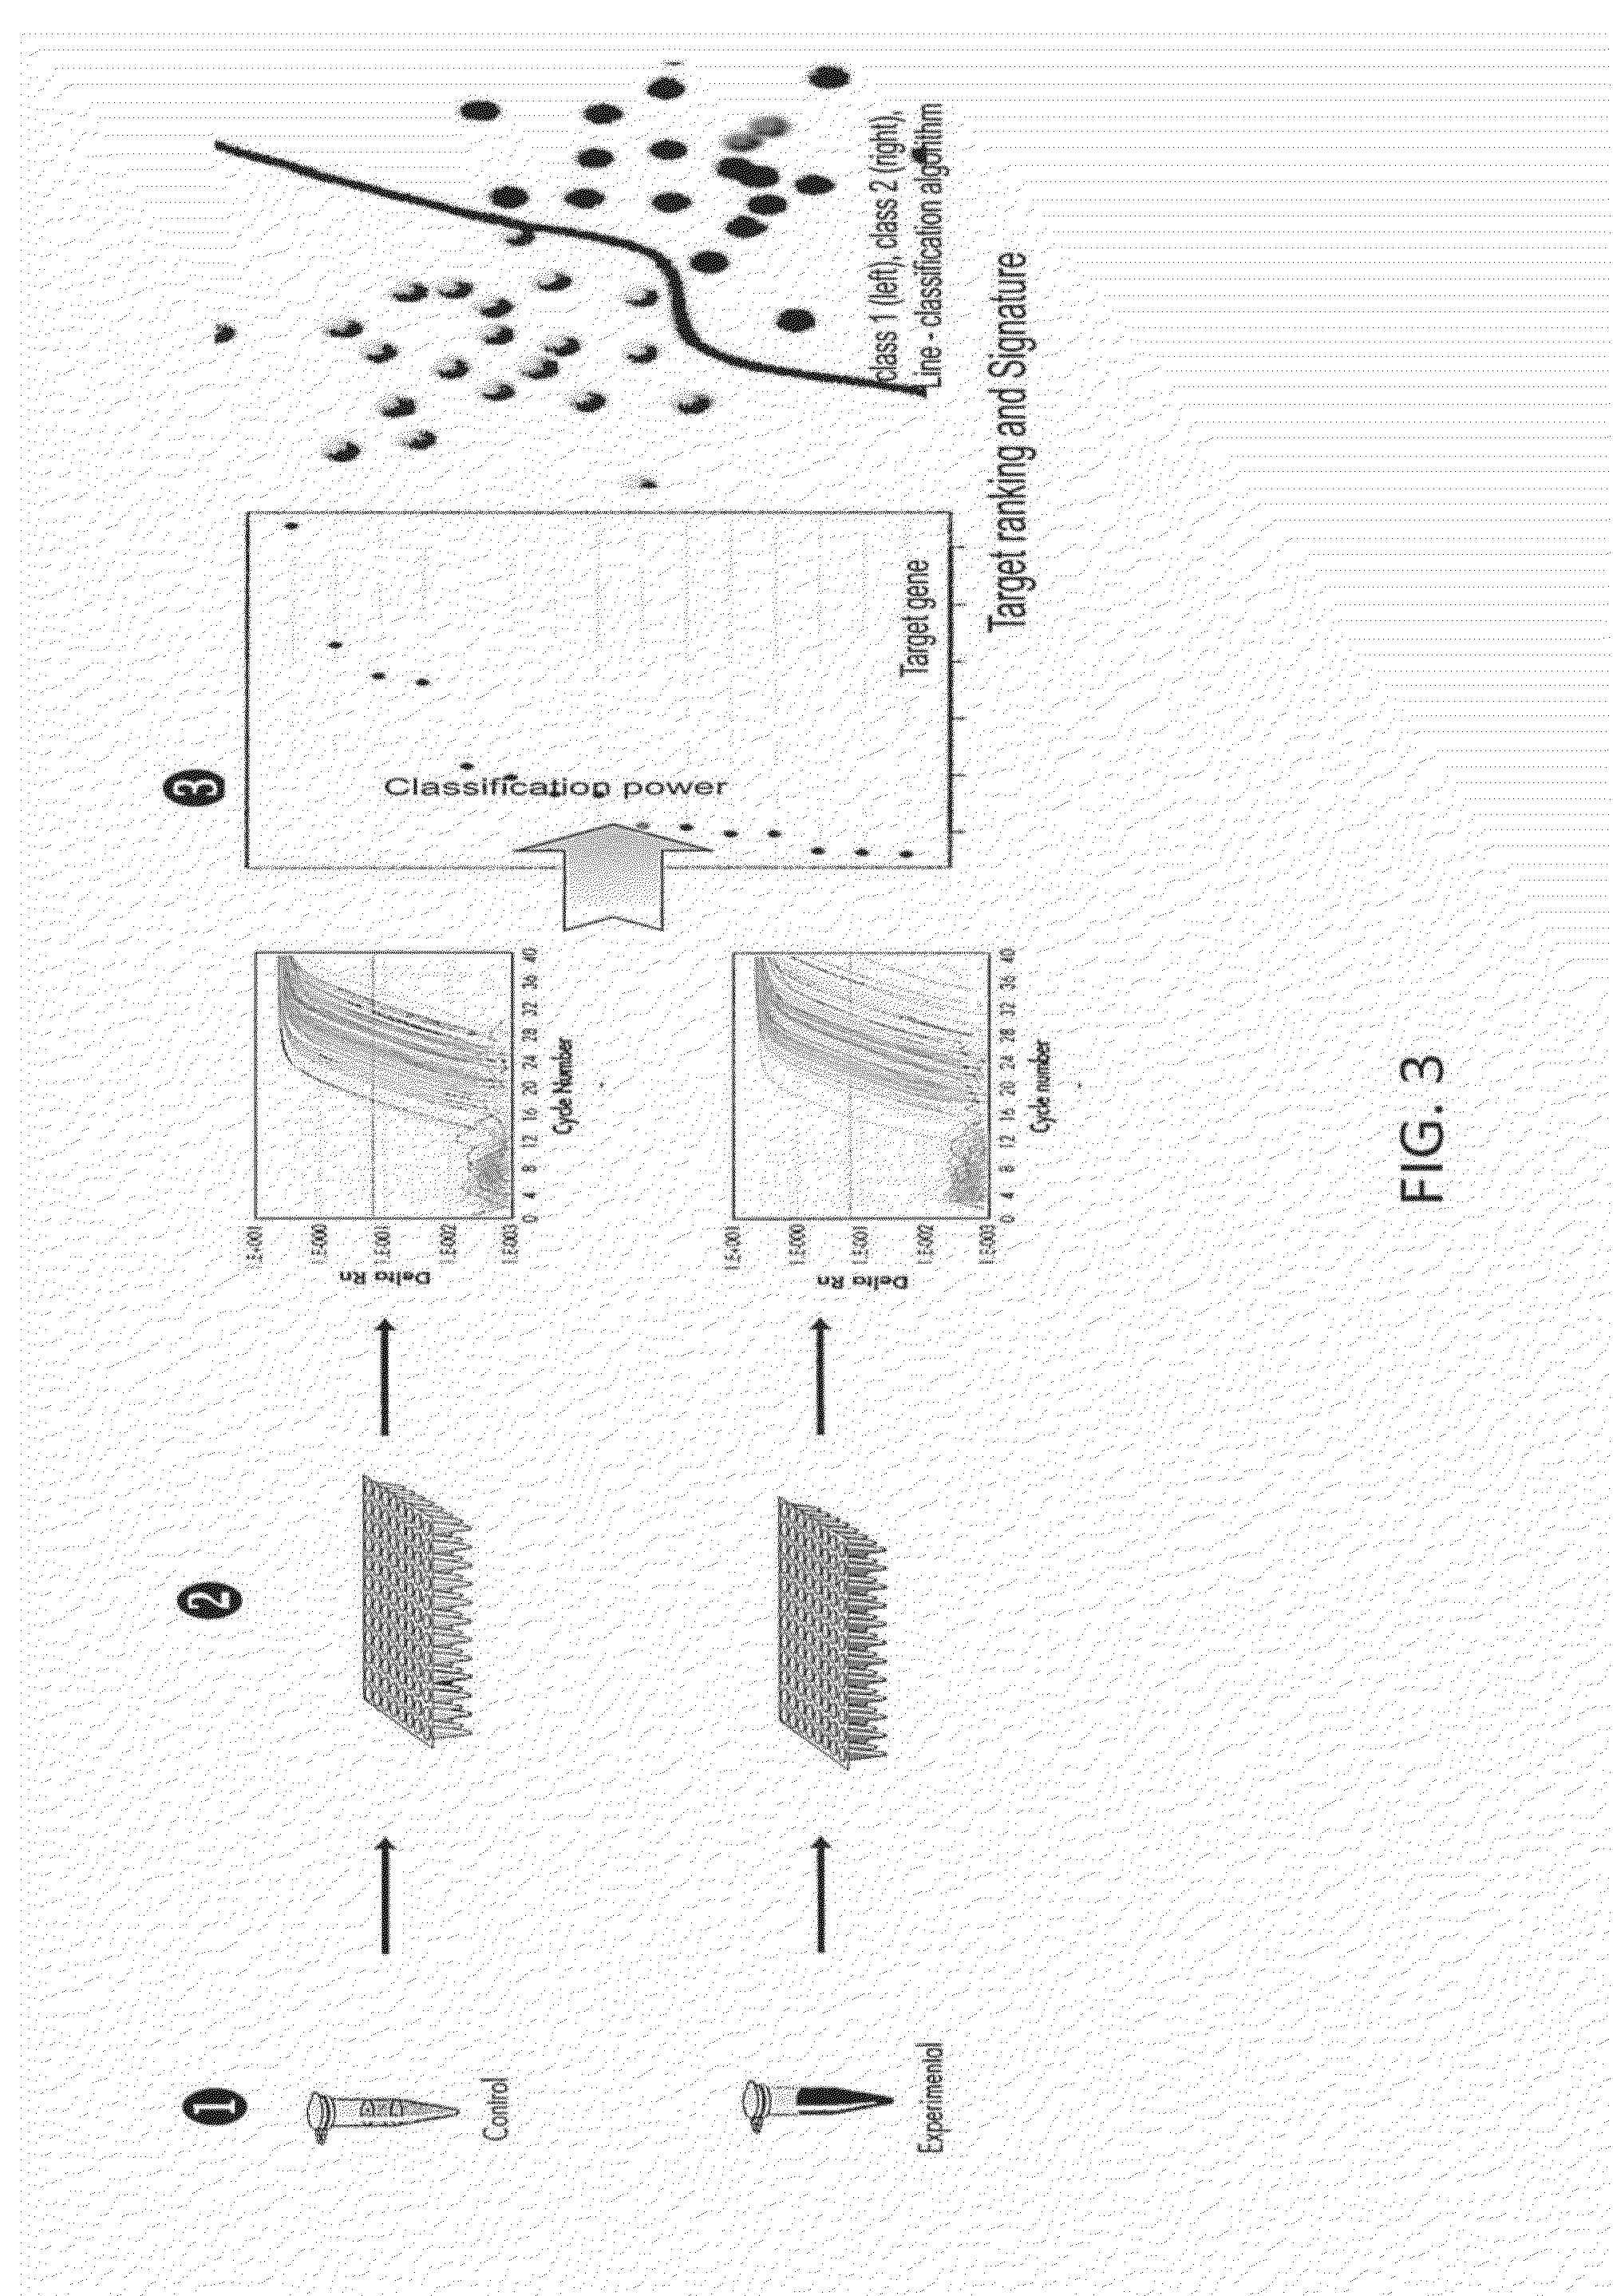
[0095]Total RNA was reverse transcribed to complementary DNA (cDNA) according to the manufacturer's protocol (Qiagen, QuantiTECT reverse transcription kit, Valencia, Calif.). SYBR Green Biomarker Custom PCR arrays was used for gene expression detection. All the primers were synthesized by Integrated DNA Technologies (IDT, Coralville, Iowa). A quality control procedure was followed to ensure specificity and efficiency with a serial dilution of reference universal genomic DNA and cDNA. Amplification specificity was confirmed by agarose gel electrophoresis of the PCR products. Customized 384-well primer plates were printed. For each sample, cDNA equal to 0.8 ng total RNA input was mixed with SYBR Green master mix (QuantiTECT SYBR Green PCR Kit, Qiagen) in a 10 micro litter reaction volume. qPCR amplification was done on ABI 7900HT Real-time PCR System. Amplification was carried out for 40 cycles (at 94° C. for 15 seconds, at 55° C. for 30 seconds, and at 72° C. for 30 second...

example 2

Thyroid Malignancy qPCR Array

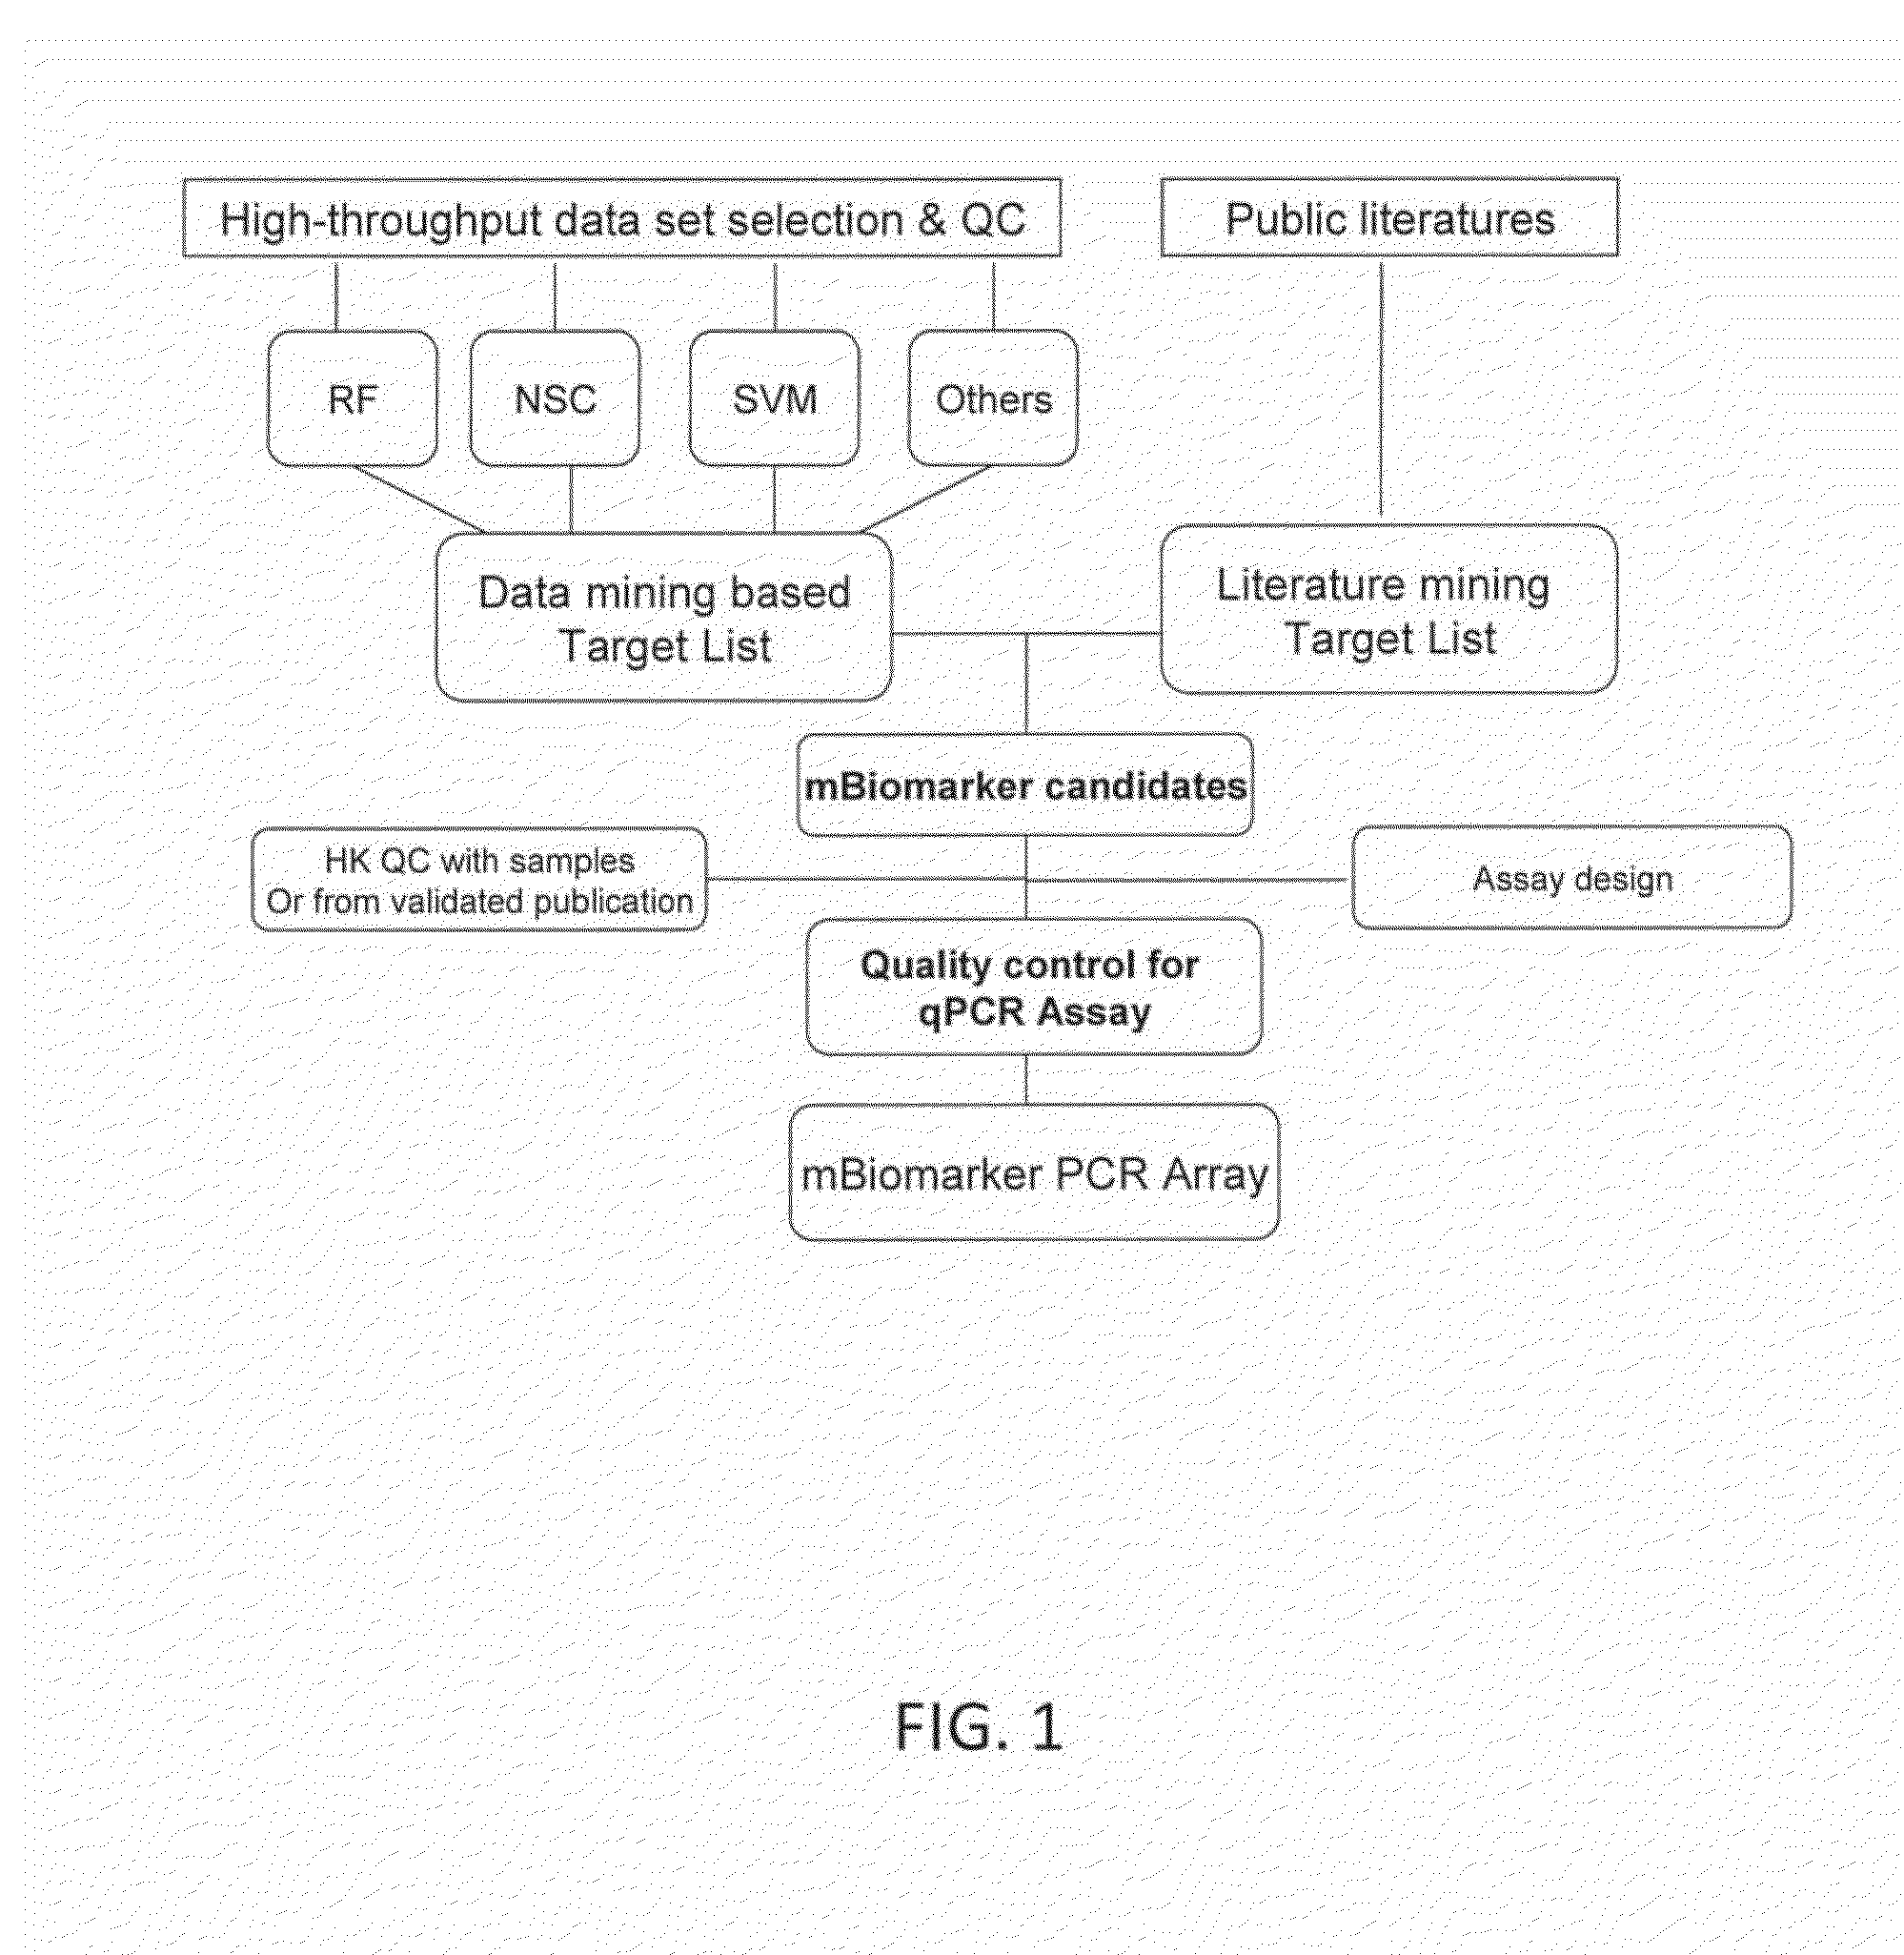
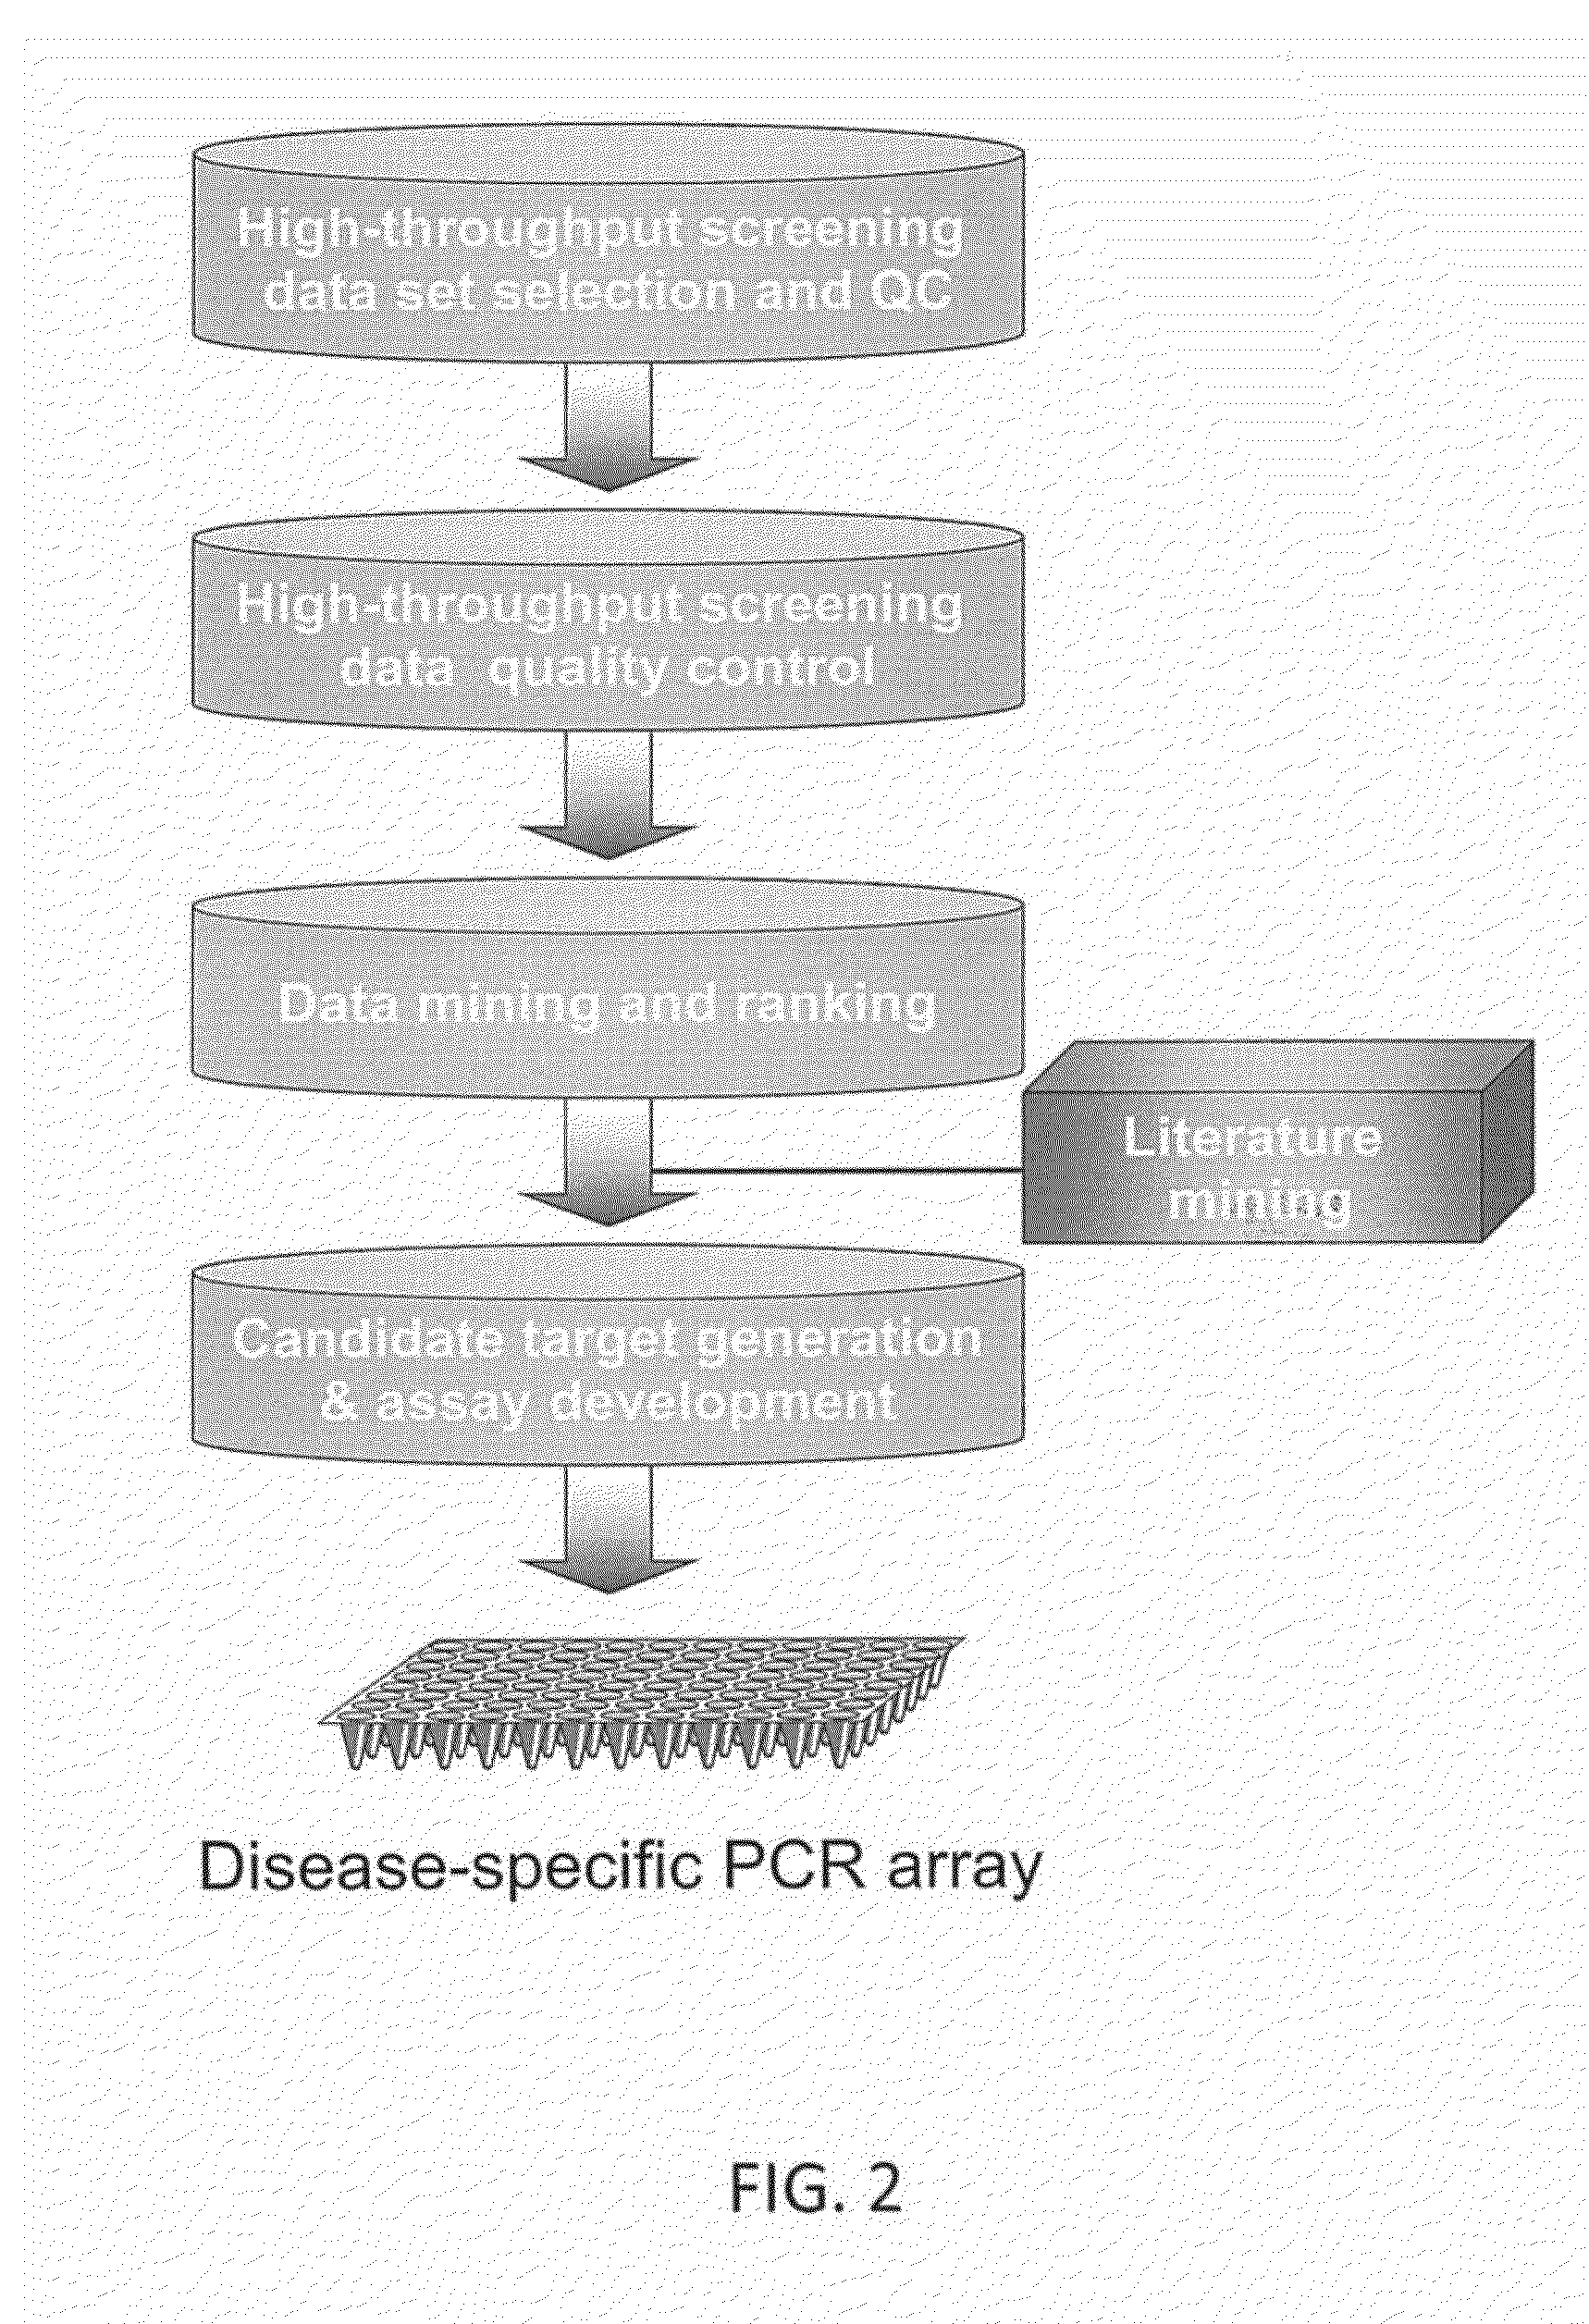
[0096]The published literature was searched and published high-throughput screening (microarray) data from 51 benign and malignant thyroid samples were selected for study. Outlier samples were identified and are shown in FIG. 4A. Outlier samples were removed from the dataset because they impaired sample clustering as shown in FIG. 4B. Sample clustering improved with removal of the outliers as shown in FIG. 4C. Multiple mathematical models including RF, NSC and SVM were used for biomarker candidate selection, and genes selected based on the literature were added for better potential biomarker coverage. FIG. 4D shows the overlap of the top 100 genes across the three representative mathematical models. qPCR assays were then performed on the top-ranked targets and were optimized tor their sensitivity, specificity and efficiency. Target assays meeting the QC standards were used for thyroid malignancy qPCR array. Ten normalization reference gene candidates wer...

example 3

Additional Panel Development

[0100]A 20 reference gene panel was tested (data not shown) with 6 thyroid samples covering normal and different stage of thyroid tumor (OriGene, Rockville, Md.). The top 10 genes were selected based on their expression stability and variation between benign and cancer group. When the final qPCR results were collected with all thyroid samples, reference gene expression was further analyzed. The reference genes with the smallest difference between benign and malignant groups and highest expression stability were picked. Five genes were selected as reference genes; TBP, RPL13A, RPS13, HSP90AB1 and YWHAZ.

[0101]A repetitive gene selection and ranking process was then repeated with random forest (RF). Target genes were pre-filtered with their expression level and the relative expression: range difference. The genes with no or extremely low expression, as well as the gene that have limited difference (<0.5 ΔCt, easily to be reversed by qPCR variation), were rem...


PUM


Abstract

The methods provided herein use microarray data for feature selection and then use selected targets to generate industry standard qPCR arrays with new clinical sample assay data so order to build a classification model. This multi-step method overcomes the disadvantages of traditional biomarker identification.

Description

BACKGROUND OF THE INVENTION[0001]1. Sequence Listing[0002]The instant application contains a Sequence Listing which has been submitted in ASCII format via EFS-Web and is hereby incorporated by reference in its entirety. Said ASCII copy, created on Mar. 5, 2013, is named 0051-0096-WOI_SL.txt and is 5,019 bytes in size.[0003]2. Field of the invention[0004]The methods provided herein use microarray data for feature selection and then use selected targets to generate industry standard quantitative real-time (qPCR) arrays with new clinical sample assay data in order to build a classification model. This multi-step method overcomes the disadvantages of traditional biomarker identification.[0005]3. Background of the Invention[0006]There are challenges in clinical classification of thyroid nodules using traditional methods. These challenges affect clinical decision making and lead to performance of unnecessary operations. While some researchers have explored the use of novel molecular class...

Claims


Application Information

Patent Timeline
IPC IPC(8): C12Q1/68
CPCC12Q1/686C12Q1/6886C12Q2600/16C12Q2600/158
Inventor TIAN, SONGZENG, XIAODICARLO, JOHNYU, JIAYEFAHEY, THOMAS J.DEVGAN, VIKRAMQUELLHORST, GEORGE J.BLANCHARD, RAYMOND K.
Owner CORNELL UNIVERSITY
Learn More