Method of classifying microorganisms using UV irradiation and excitation fluorescence
a technology of excitation fluorescence and microorganisms, which is applied in the direction of fluorescence/phosphorescence, luminescent dosimeters, optical radiation measurement, etc., can solve the problems of life-threatening endospores, and achieve the effect of easy operation and little specialized training
- Summary
- Abstract
- Description
- Claims
- Application Information
AI Technical Summary
Benefits of technology
Problems solved by technology
Method used
Image
Examples
1st embodiment
1st Embodiment
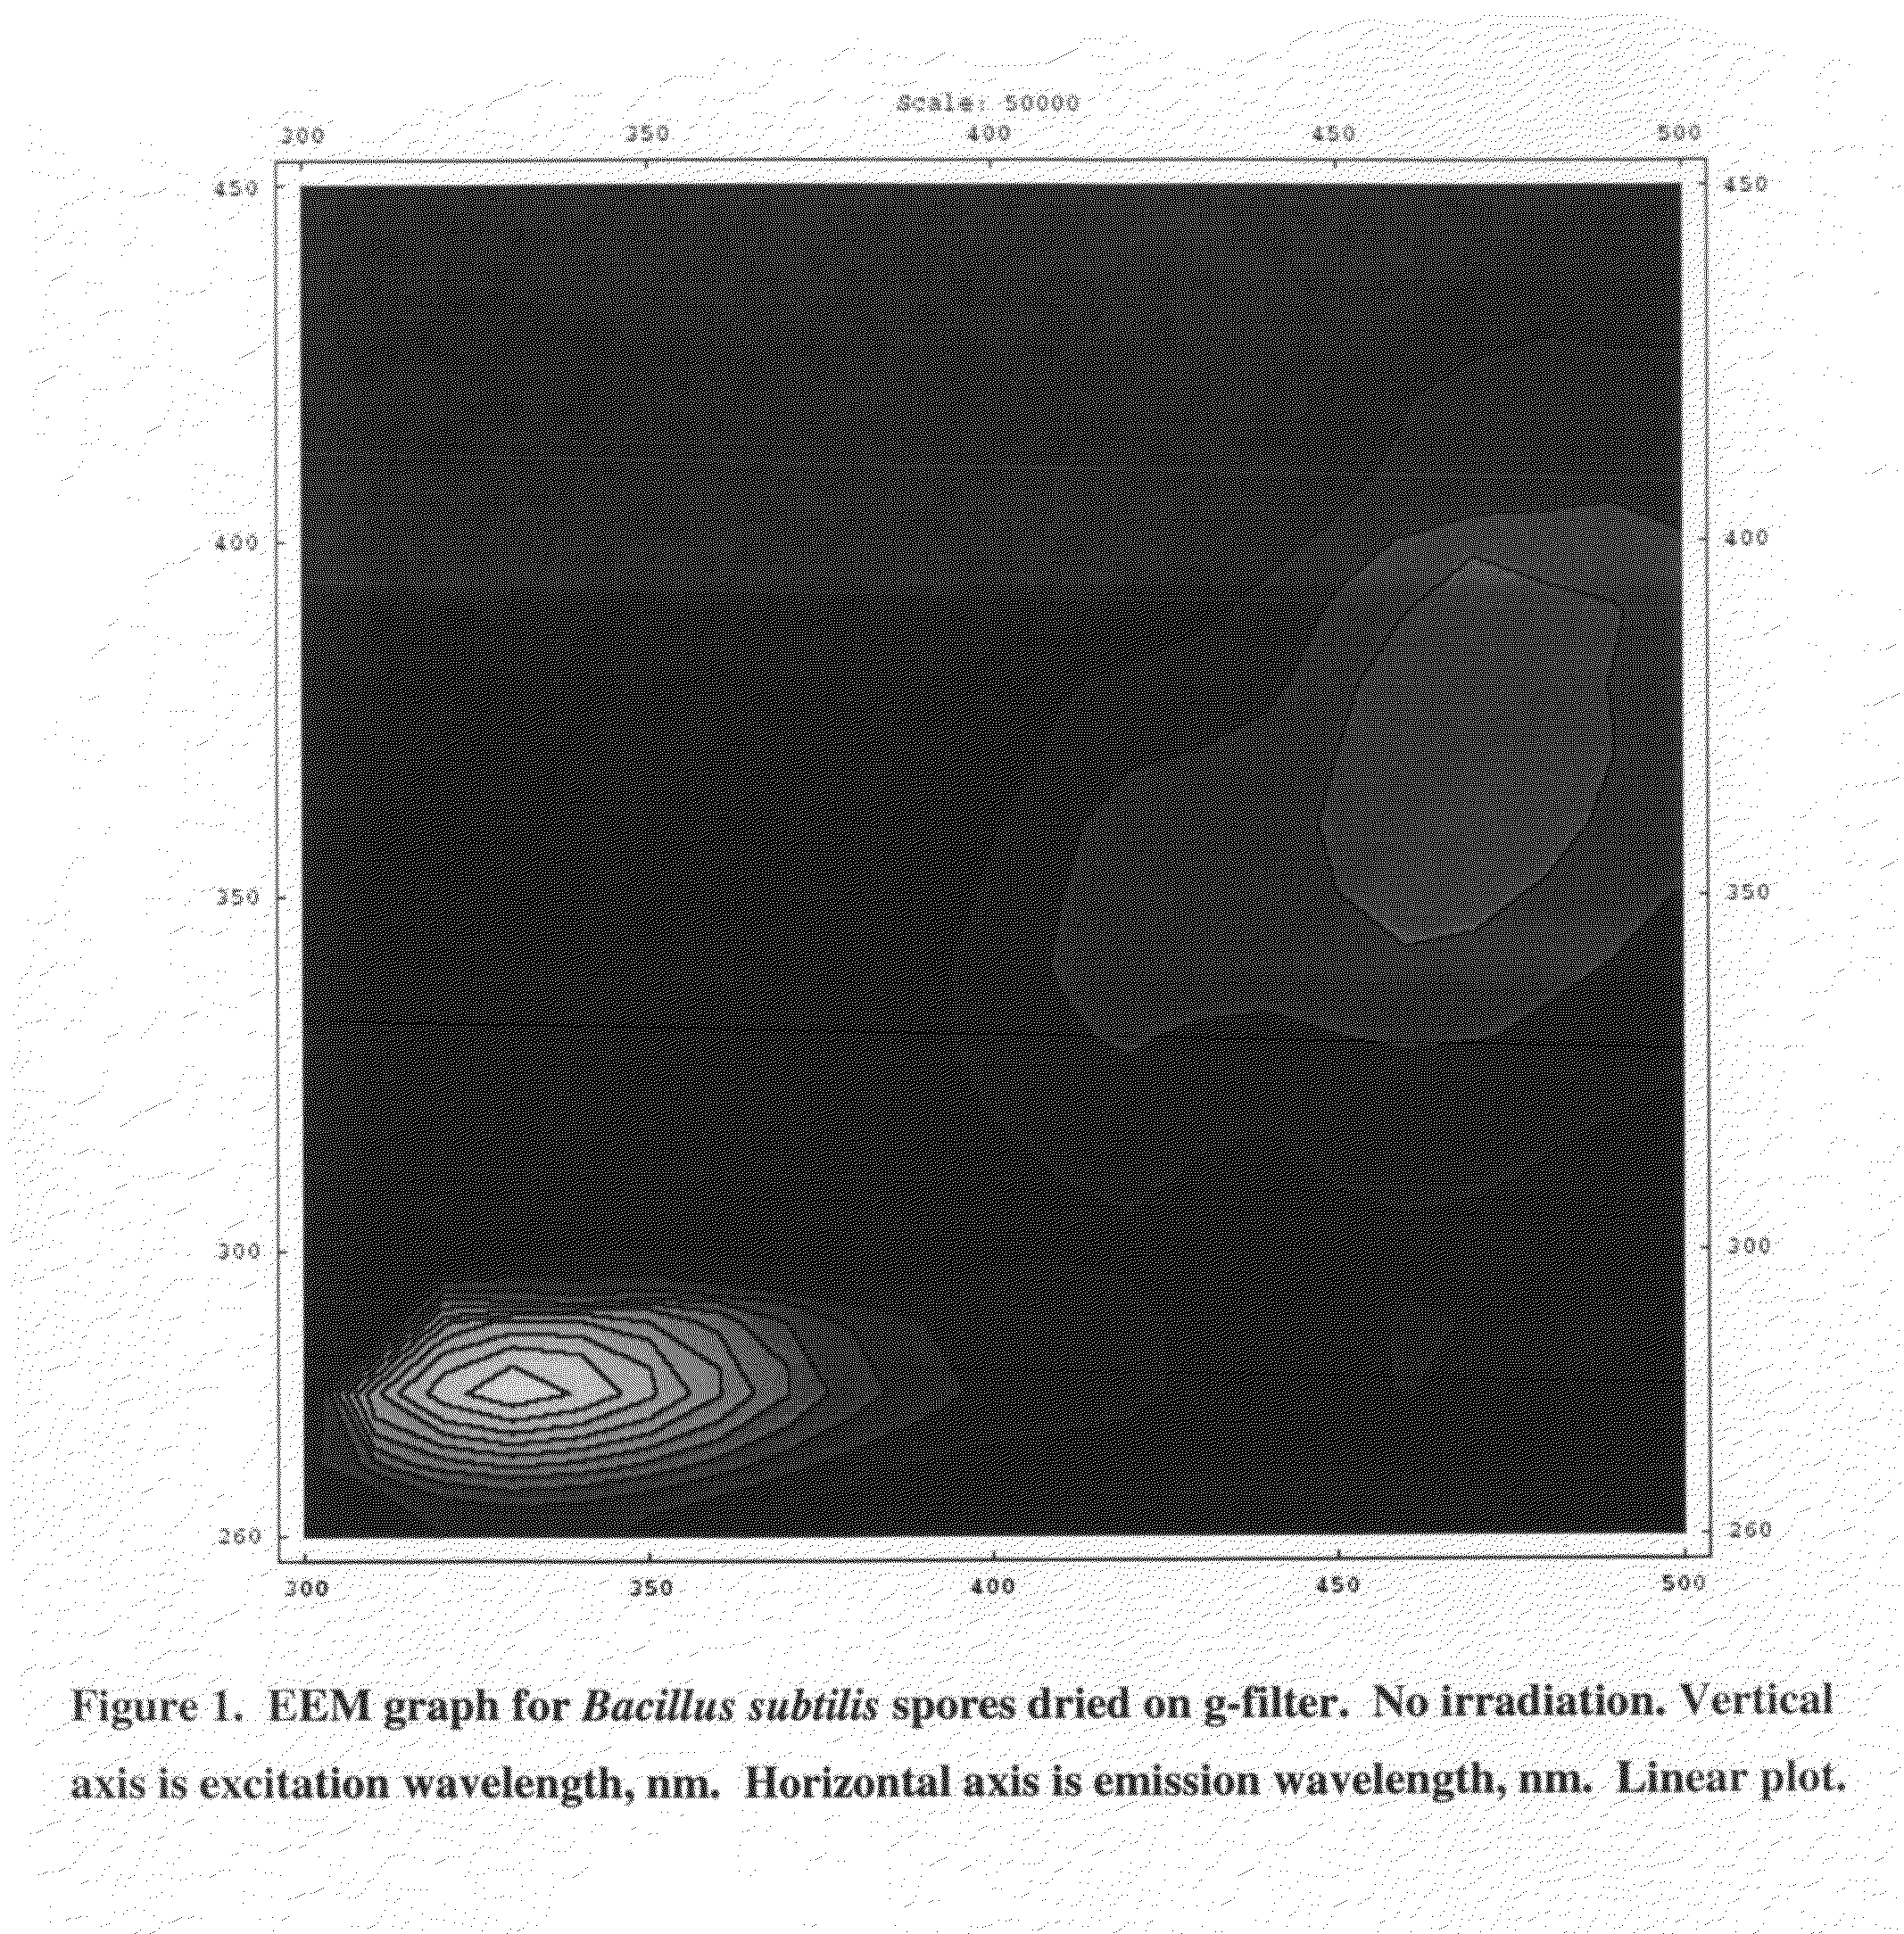
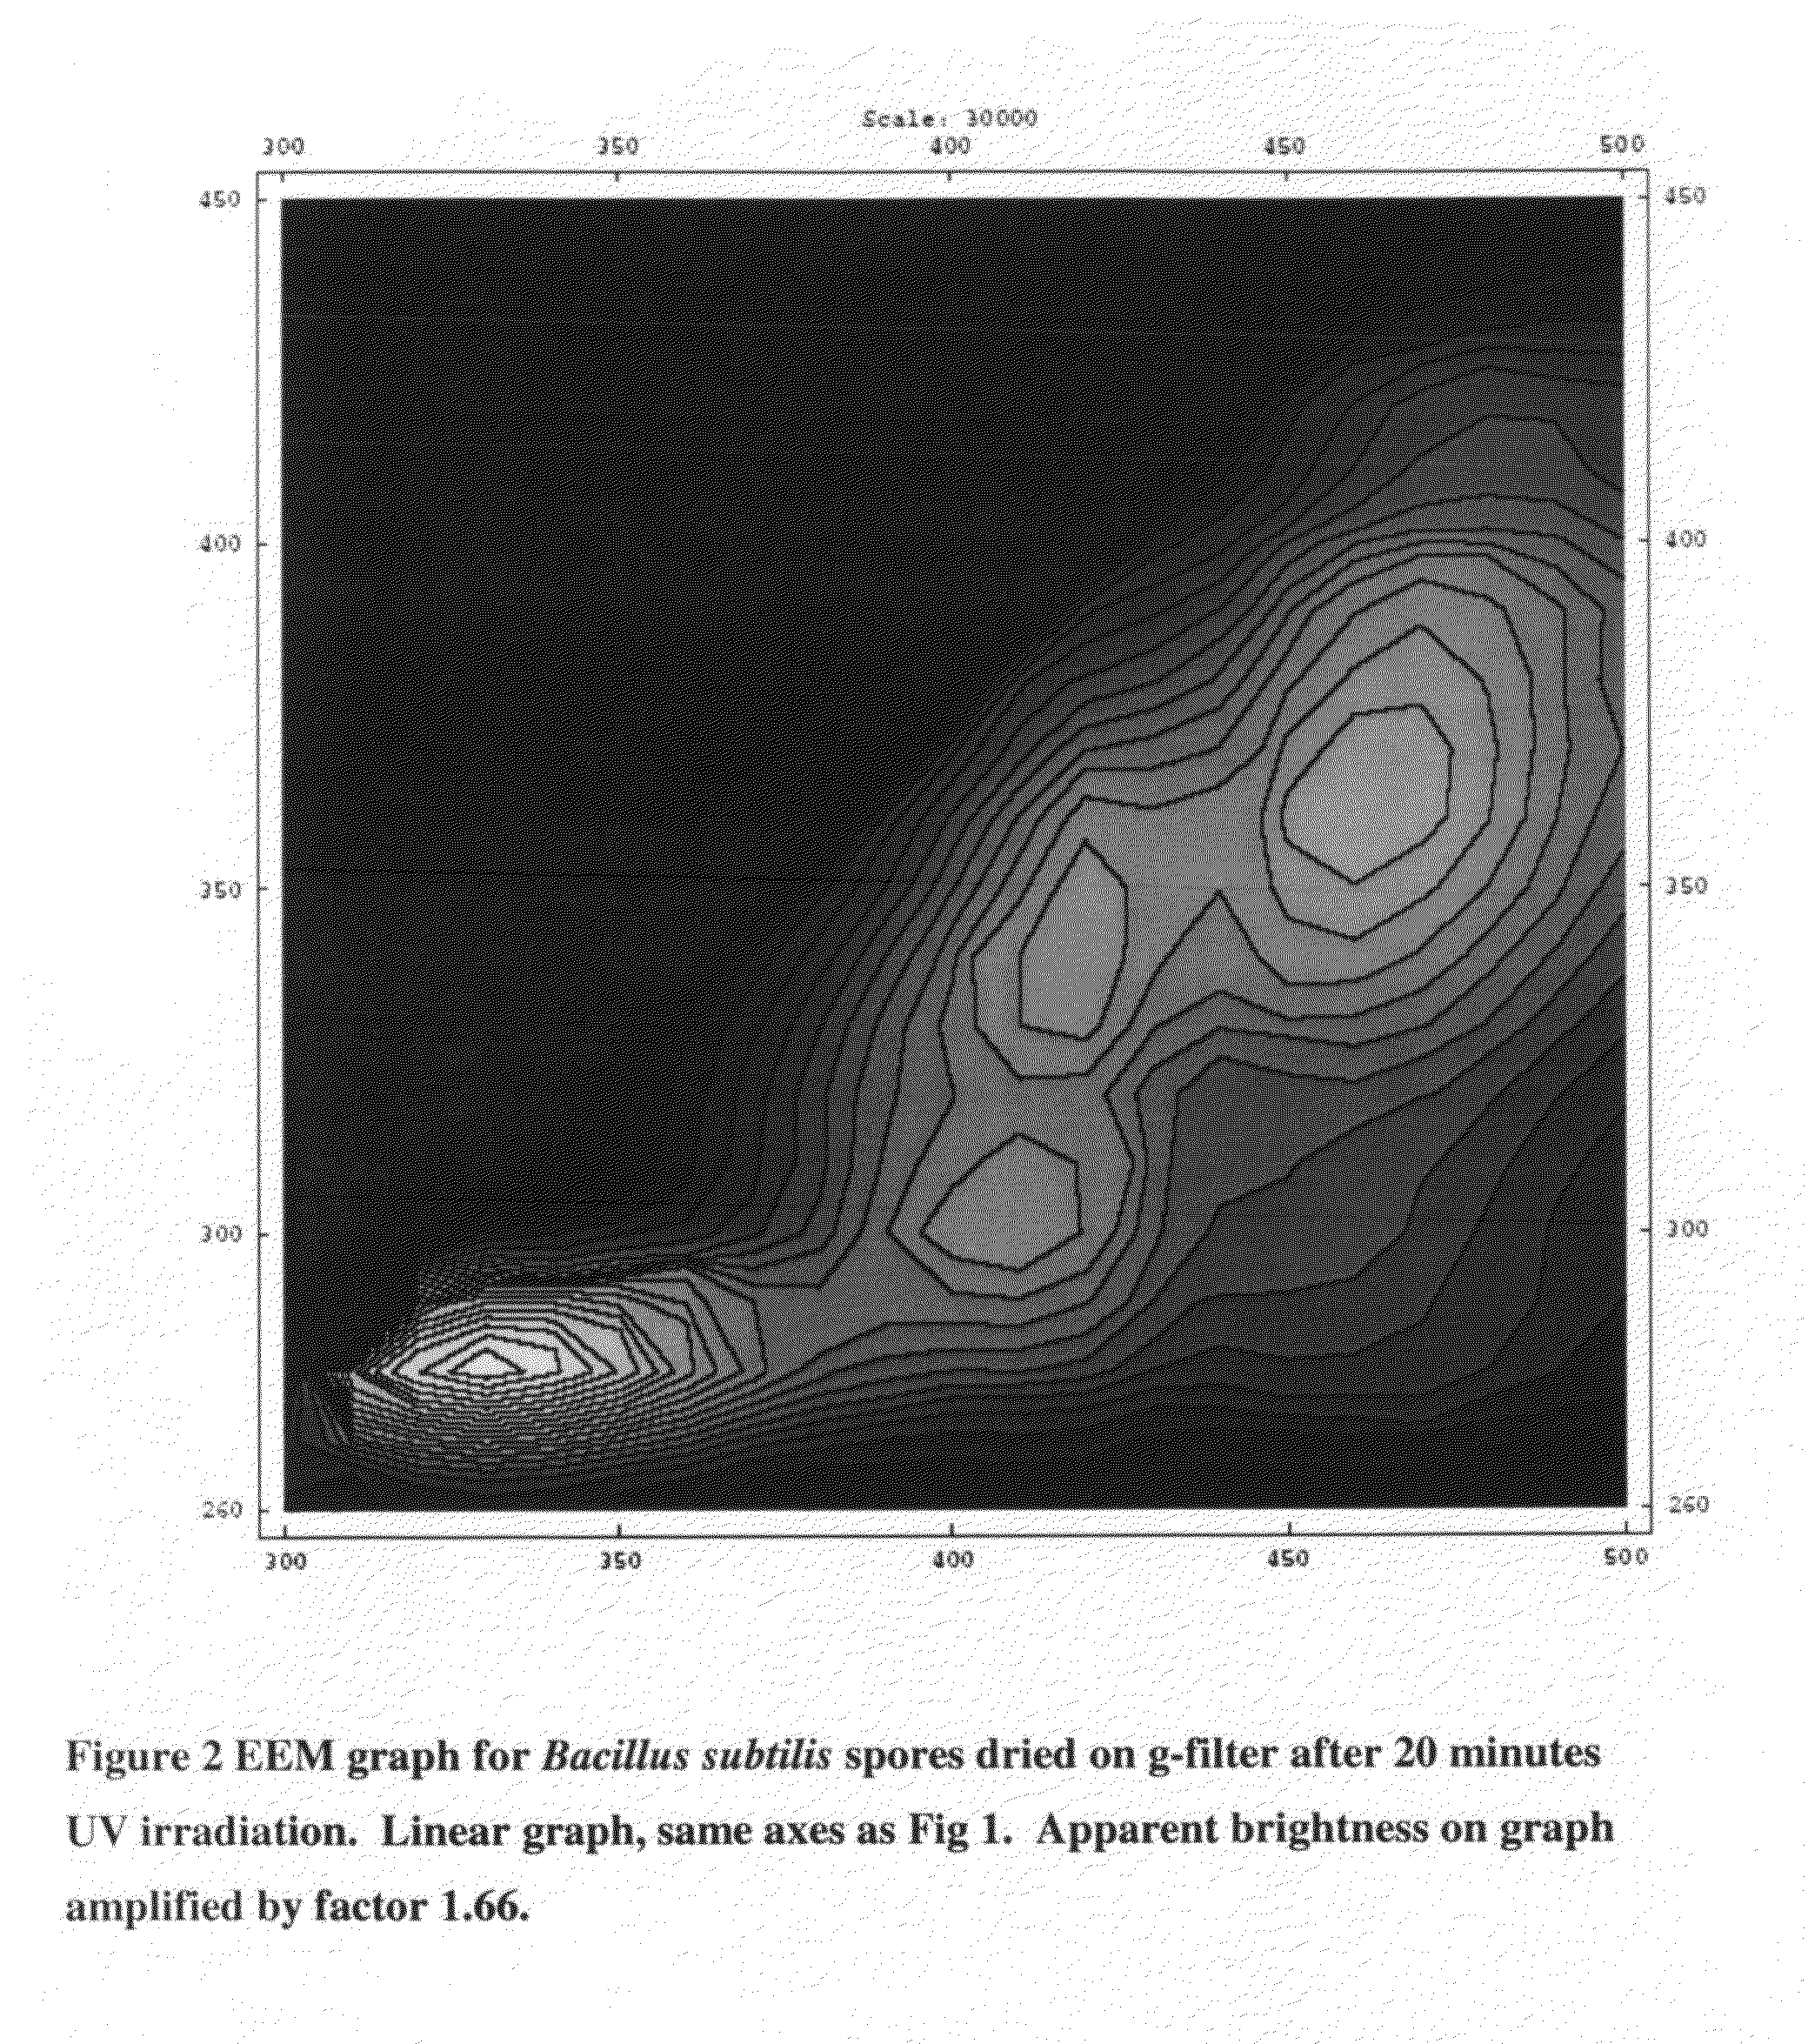
[0069]This is the simplest method, to be used to detect spores where there is a visible powder. Instead of an integrated device there would be a kit. The kit would simply consist of a UV light source (2) to irradiate the suspected surface; an excitation light source [component (1) and (5)], and an emission spectrometer [component (11)] to examine emitted light from the suspected surface and a computer with software to compare the EEM graph to a “type-graph” for bacterial spores or other bacterial particles.
Situation 2
[0070]The microorganisms are either present in the air as an aerosol, or are deposited on surfaces at a very low concentration.
[0071]This is a more sophisticated version of the first embodiment to be used in Situation 2.
2nd embodiment
2nd Embodiment
[0072]An aerosol collector / concentrator [a. components (8) and (9)] or a vacuum pickup, [b. component (12)] would be used continuously. The choice of a. or b. depends on whether an aerosol (a.) or surface dust (b.) is being examined. The concentrator delivers the aerosol sample every 10 minutes into ˜5 ml of water which further concentrates the sample into a small spot by being pulled through a non-fluorescent filter [component (11)], leaving all particles greater than the pore size (<1 micrometer) and discarding the liquid. An EEM spectrum is taken on the filter using components (4) and (10). Sample is irradiated [component (2)] on the filter [component (11)], and an EEM spectrum is taken after irradiation with the EEM graphs stored in the computer memory for comparison later.
[0073]Small (6 to 108 organisms in a 10 mm spot on a filter gives a recognizable EEM pattern. Thus if the air contains 1000 organisms / liter as would be typically expected in a deliberate attack, ...
3rd embodiment
3rd Embodiment
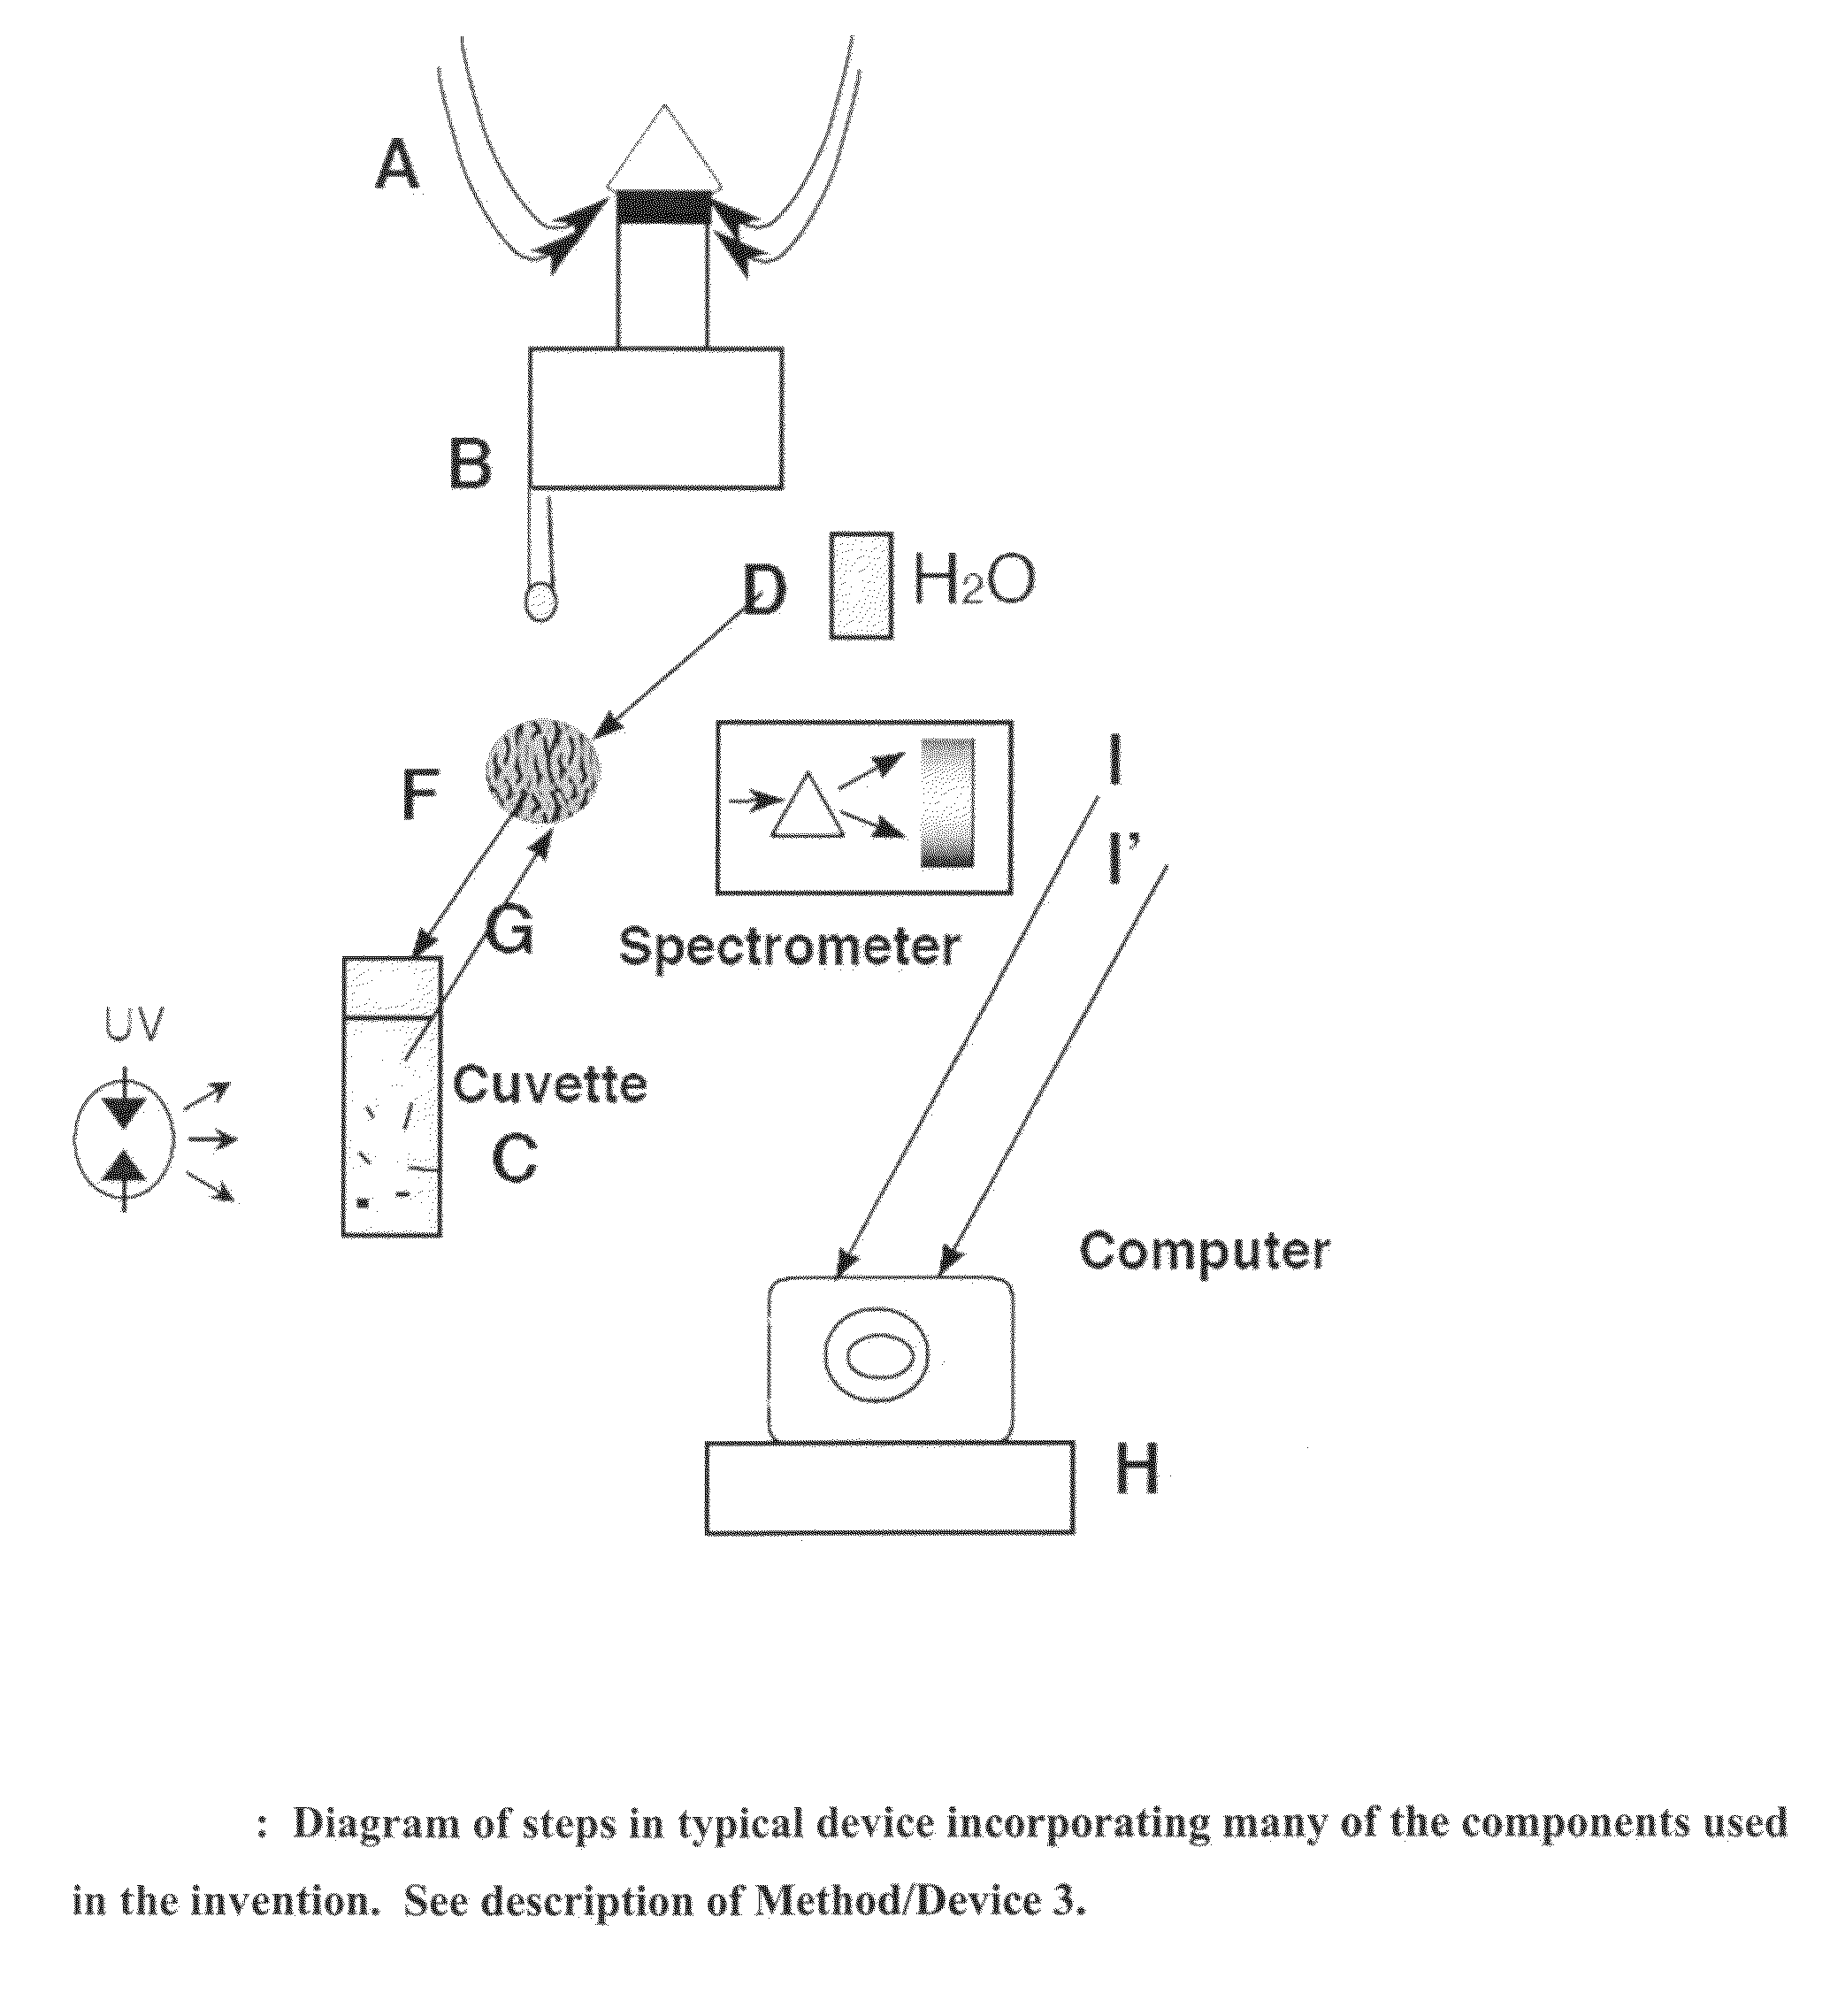
[0074]The diagram for this version is shown in FIG. 13. It is typical of the various devices described. Collection and concentration are as in the second embodiment in an aerosol collector concentrator which concentrates particles in desired size range from a large volume of air (e.g., several hundred liters; see A in FIG. 13) into a small volume of water (e.g. a few ml; see B in FIG. 13). Next the suspended sample is moved to a non-fluorescent filter (F in FIG. 13; component (11)) using component (6) and washed with additional water passing through the sample and filter. EEM spectrum is taken of dried sample on non-fluorescent filter using excitation source, (component (4) not shown) and emission spectrometer (component (10) and spectrometer in FIG. 13). The sample is transferred to small volume of clean water from the filter, and moved into quartz cuvette (C in Fig.; component (3)) for UV irradiation or it may be irradiated on the filter; it is subsequently moved bac...
PUM
| Property | Measurement | Unit |
|---|---|---|
| wavelengths | aaaaa | aaaaa |
| wavelengths | aaaaa | aaaaa |
| size | aaaaa | aaaaa |
Abstract
Description
Claims
Application Information
 - R&D
- Intellectual Property
- Life Sciences
- Materials
- Tech Scout
- Unparalleled Data Quality
- Higher Quality Content
- 60% Fewer Hallucinations
Browse by: Latest US Patents, China's latest patents, Technical Efficacy Thesaurus, Application Domain, Technology Topic, Popular Technical Reports.
© 2025 PatSnap. All rights reserved.Legal|Privacy policy|Modern Slavery Act Transparency Statement|Sitemap|About US| Contact US: help@patsnap.com


