
Methods and systems for intelligent visual function assessments

a visual function and intelligent technology, applied in the field of vision testing, can solve the problems of poor practical sense of measurement, patient's inability to drive at night, and subjects who score well on standard vision testing continue to claim difficulties in vision, etc., to achieve the effect of eliminating testing bias

Active Publication Date: 2012-03-29
ALCON INC +1
View PDF4 Cites 45 Cited by
  • Summary
  • Abstract
  • Description
  • Claims
  • Application Information

AI Technical Summary

Benefits of technology

[0026]The vision testing system of the present invention provides for testing vision performance in a variety of manners. For example, the processor can he configured to adjust the contrast of each visual recognition test by any of (i) fading a background color to match a foreground color, (ii) fading a foreground color to match a. background color, and (iii) fading both a foreground color and a background color to converge at a neutral color. As a result of the more refined and variable tests of vision performance, the vision testing system can determine a vision performance score with greater accuracy and precision. For example, in some embodiments, the vision testing system can he configured to output a vision performance score according to a 100th (0.01) of a logMAR.

Problems solved by technology

For a long time clinicians have noted that subjects who score well on the standard vision tests continue to claim difficulties in vision.
Such a condition can make the patient unable to drive at night—despite nominally “normal” vision.
Vision performance testing presents a number of challenges.
While visual function is currently assessed in clinical and research settings by various measurements (e.g., visual acuity testing and contrast sensitivity testing), these measurements do not always provide an accurate indication of a subject's visual function in a practical sense.
One drawback of these methods is that they typically test only one or two aspects of vision at a time (target size, percent contrast, and perhaps depth perception).
Even if multiple individual visual tests are performed, each test is tailored to a specific aspect of vision, preventing a comprehensive assessment of vision performance from being obtained.
The complexity of the apparatus often makes testing expensive, requiring subjects to travel to a particular location that may be remote from their physician's office.
Additionally, the testing experience often includes tasks requiring more complex cognitive and physical function than simply vision.
Thus this testing scenario does not achieve a pure assessment of visual function.

Method used


Image

  • Methods and systems for intelligent visual function assessments
  • Methods and systems for intelligent visual function assessments
  • Methods and systems for intelligent visual function assessments

Examples


Embodiment Construction

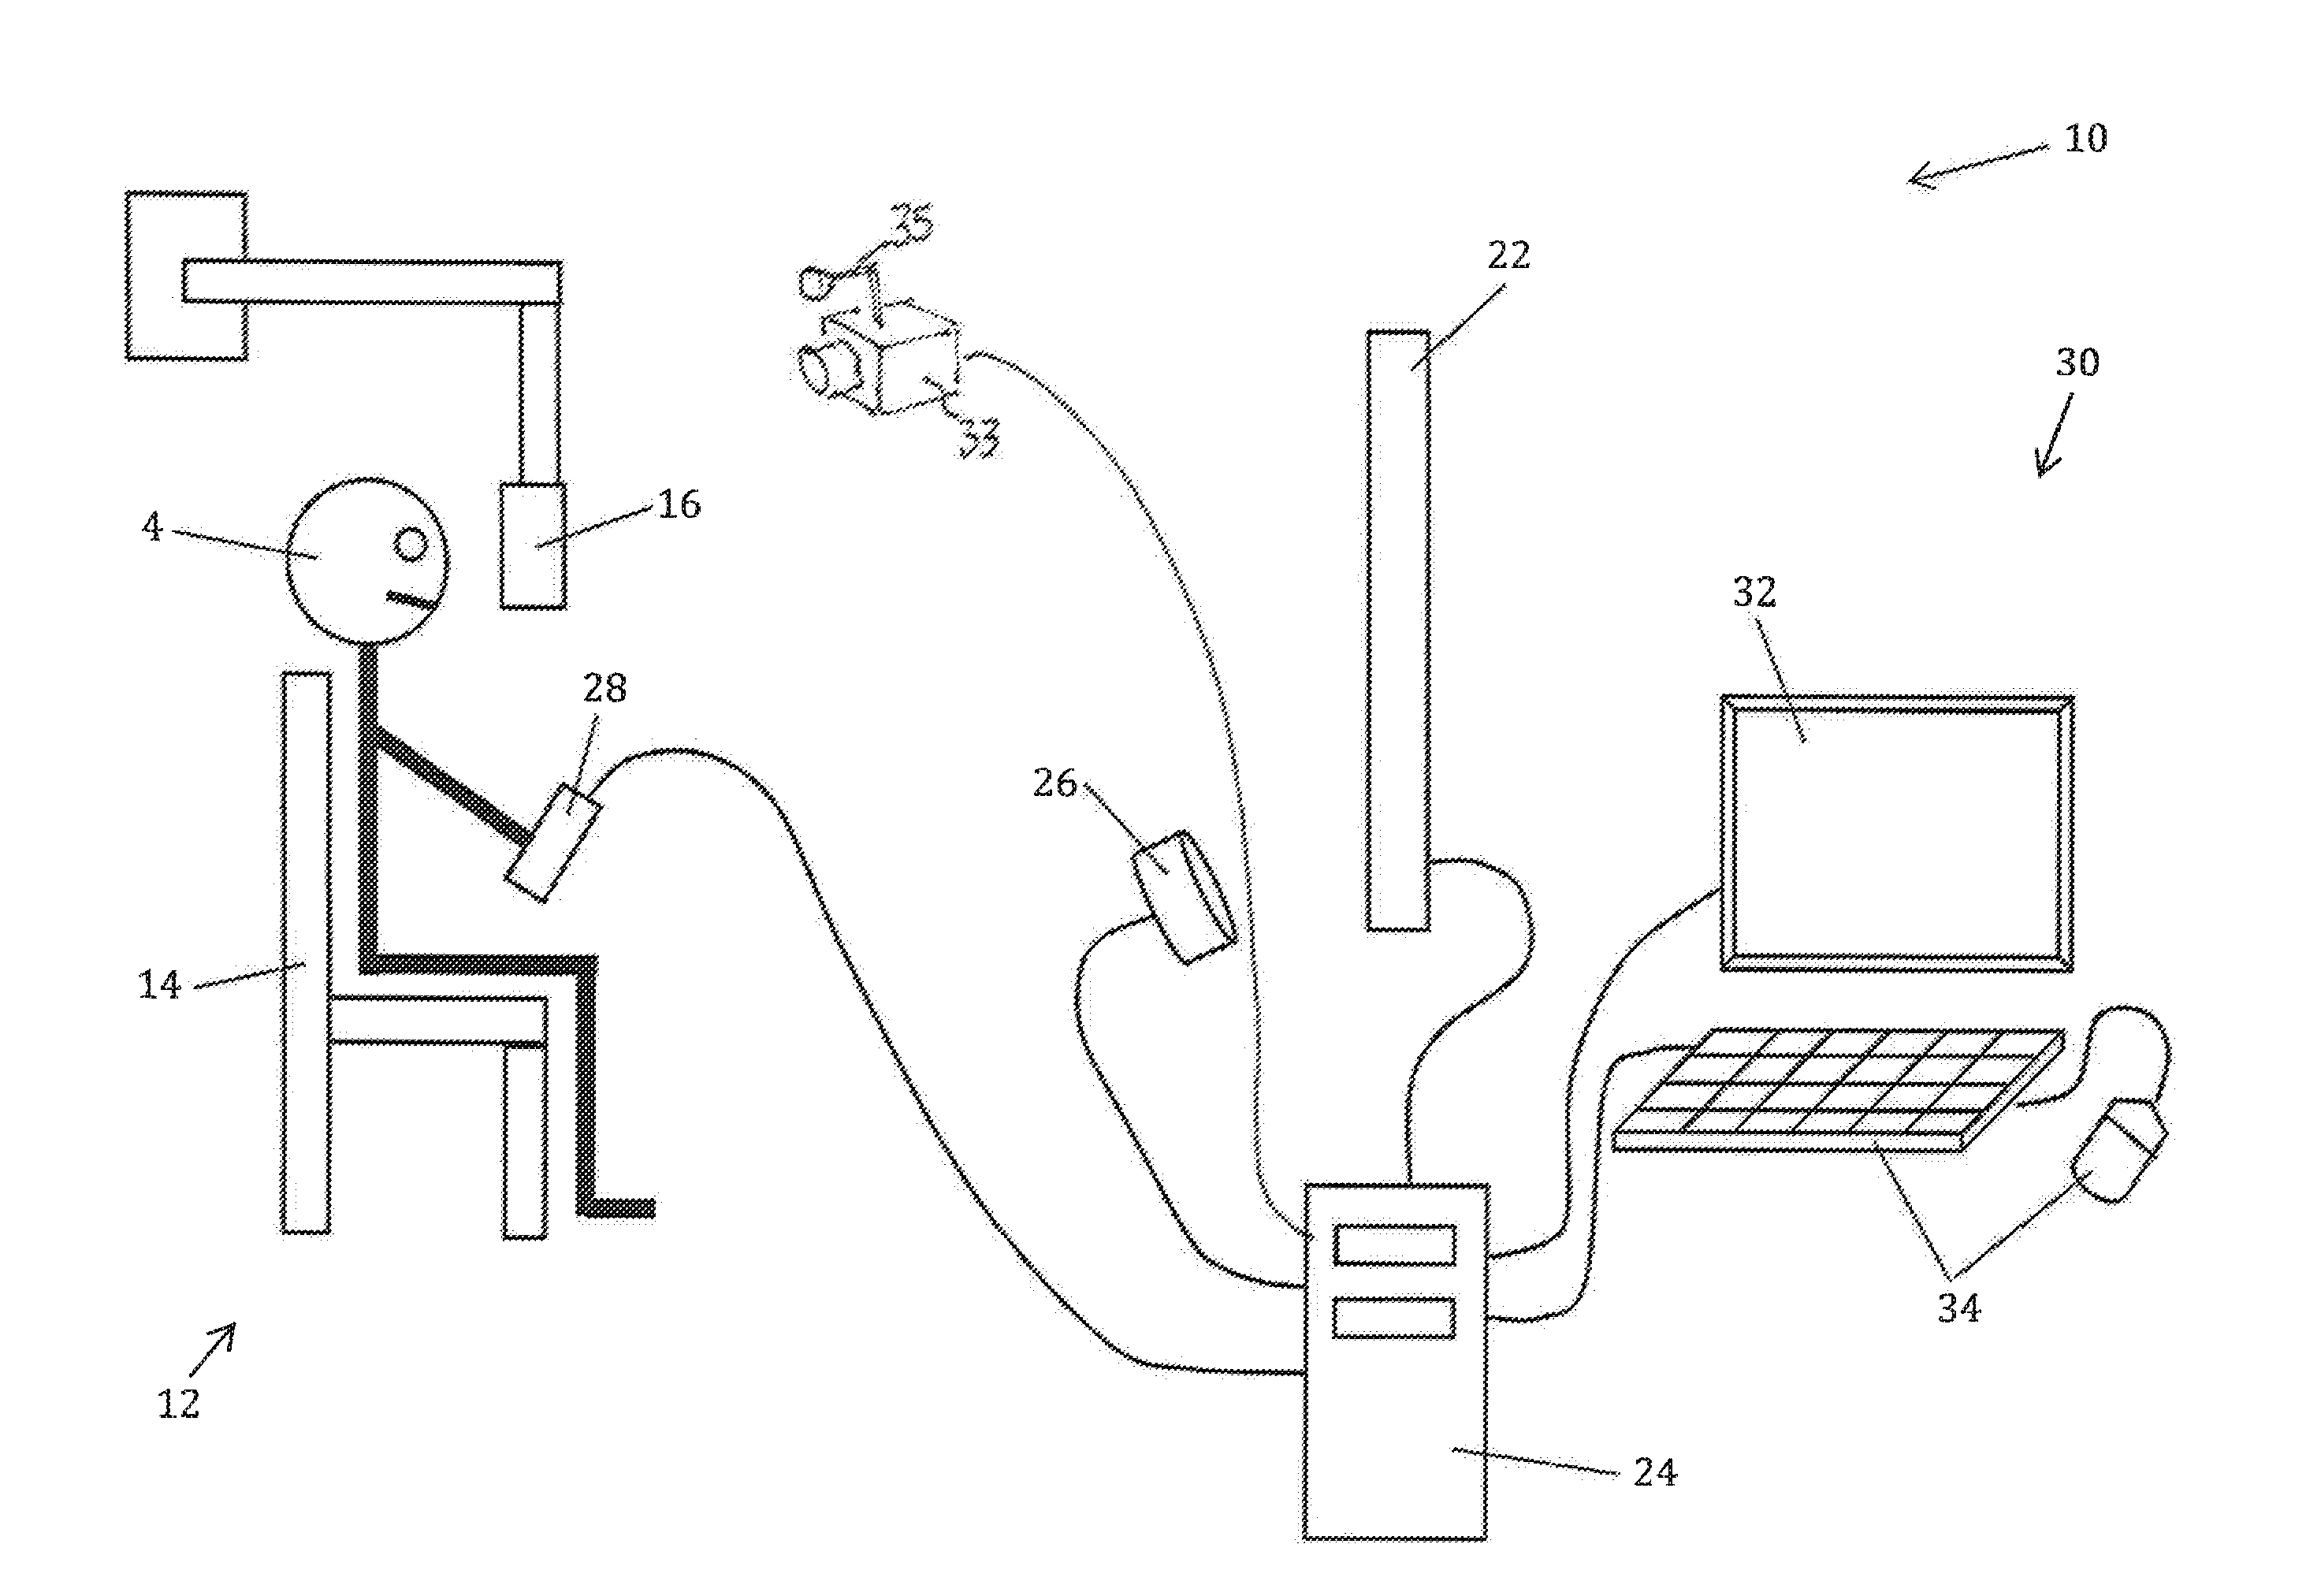
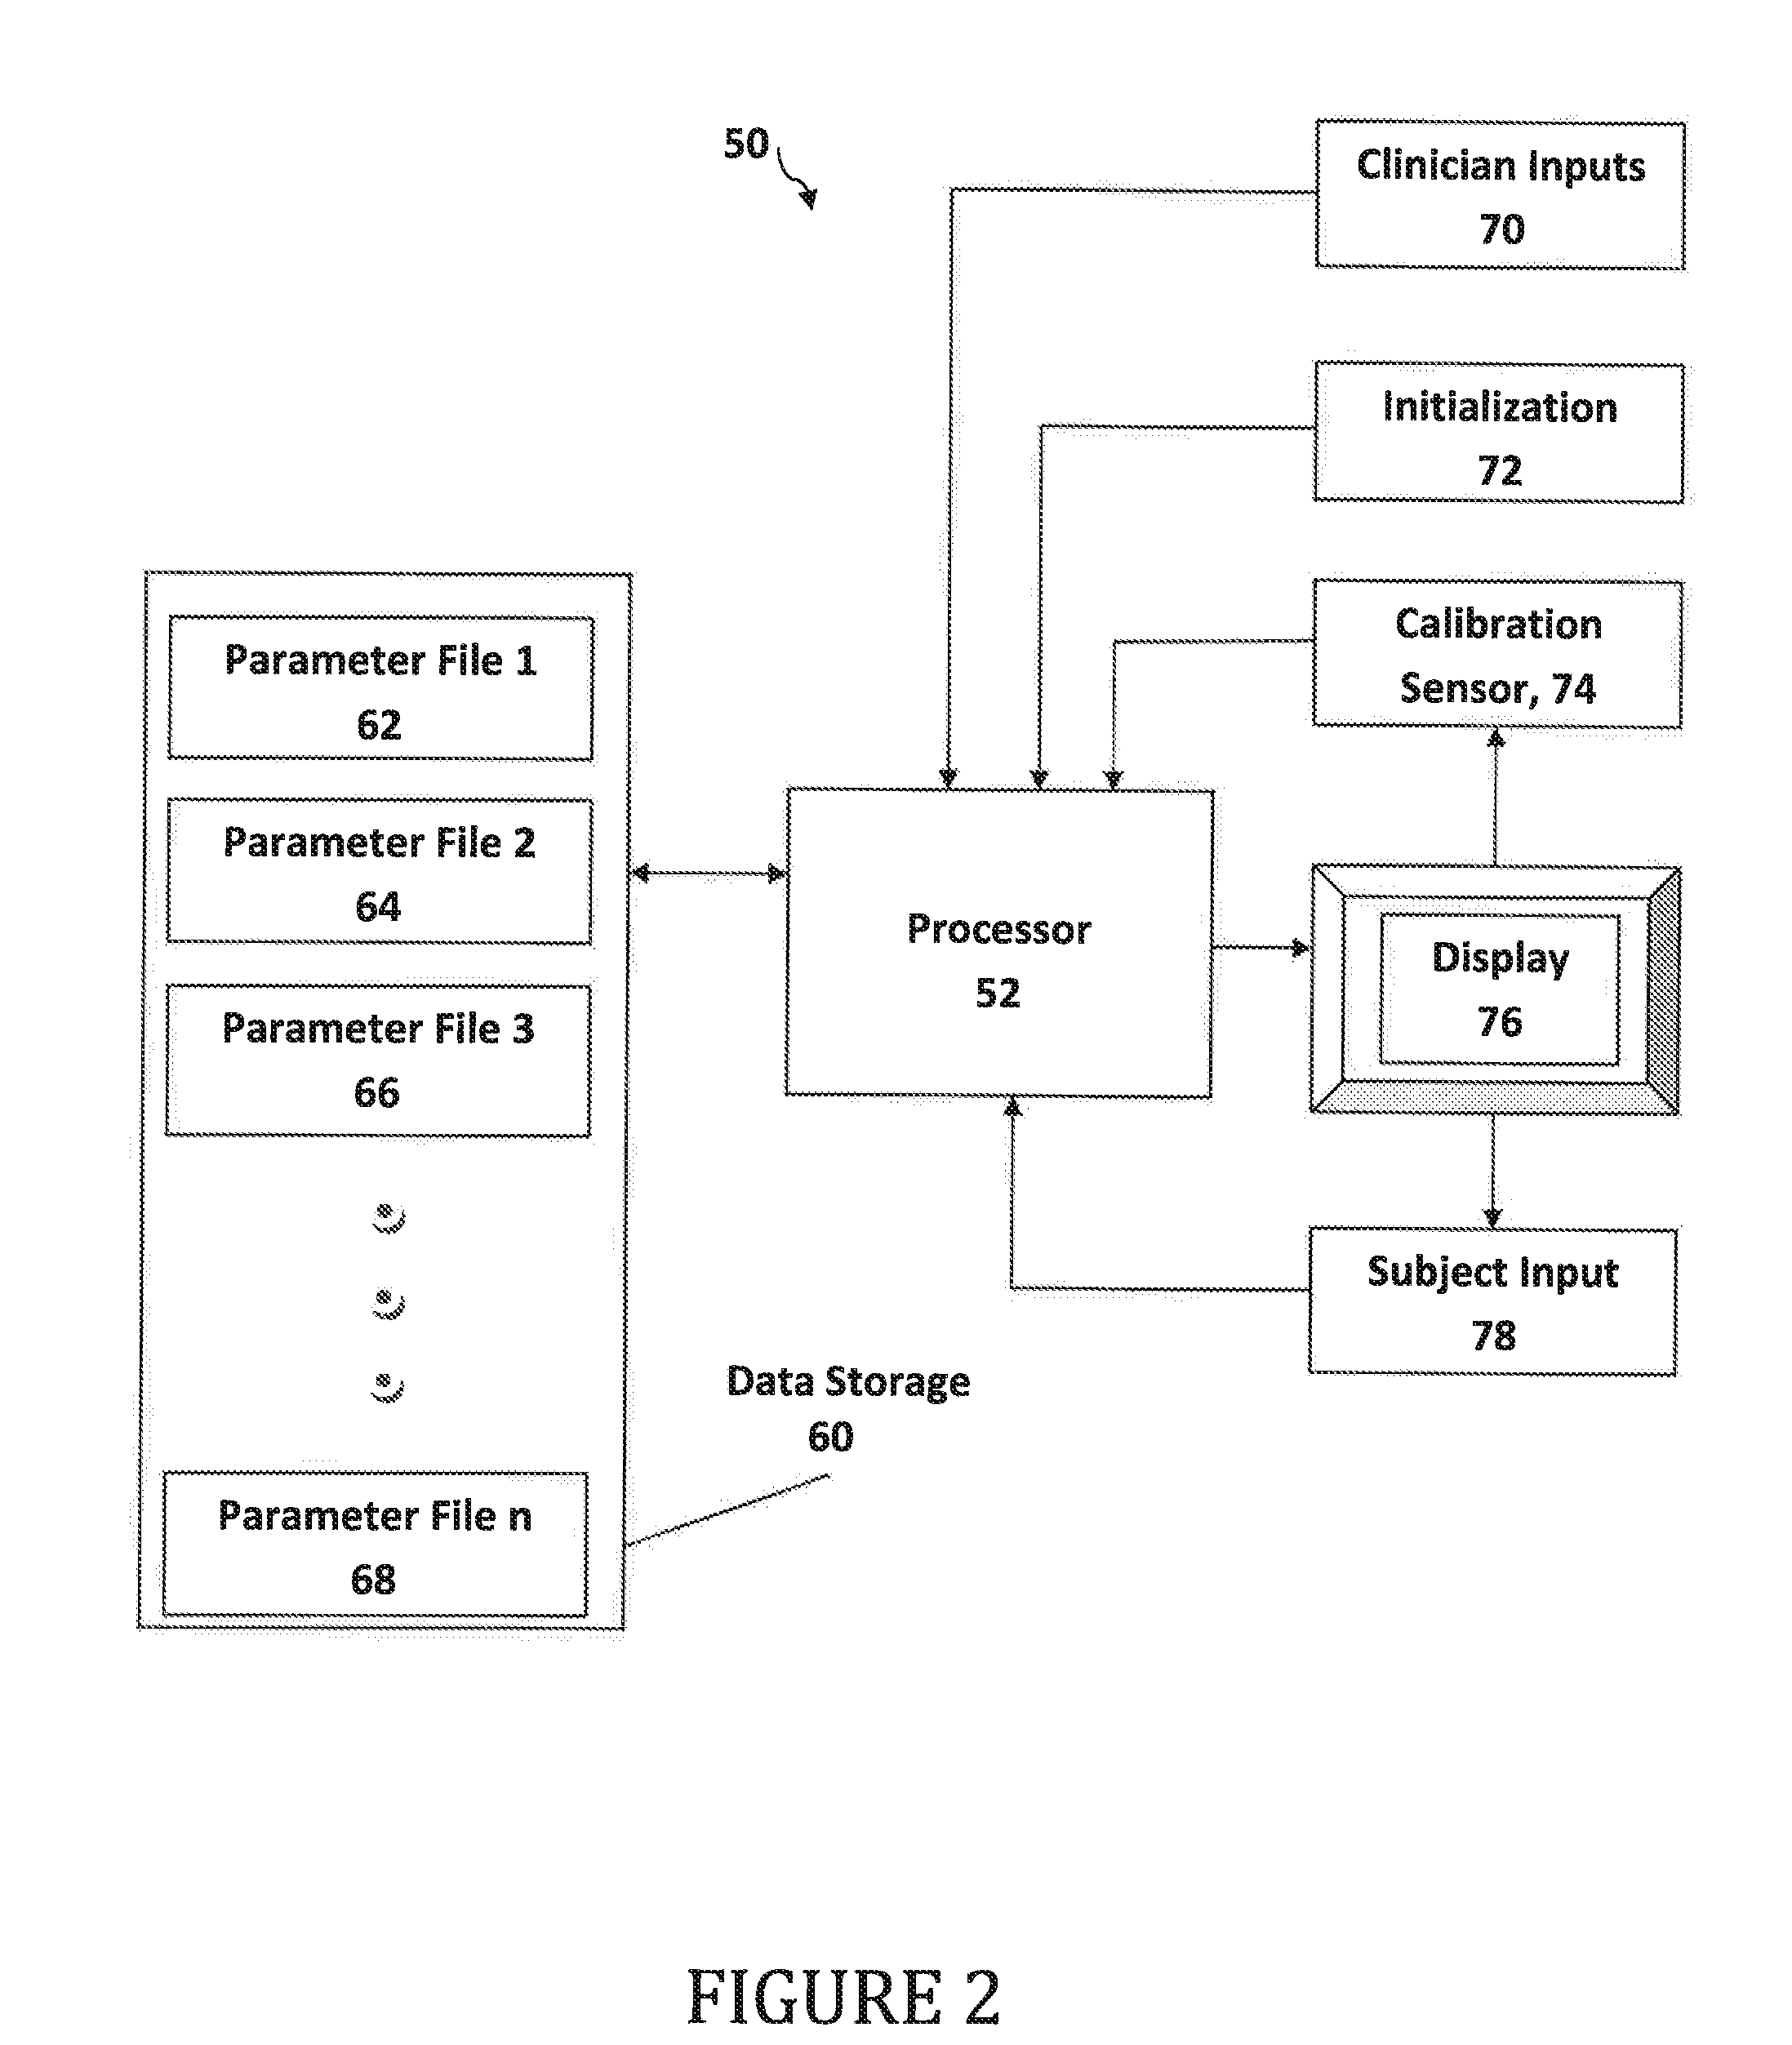
[0041]Various embodiments of the disclosure are illustrated in the FIGURES, and like numerals are generally used to refer to like and corresponding parts of the various drawings. As used herein, the terms “comprises,”“comprising,”“includes,”“including,”“has,”“having,” or any other variation thereof, are intended to cover a non-exclusive inclusion. For example, a process, article, or apparatus that comprises a list of elements is not necessarily limited to only those elements but may include other elements not expressly listed or inherent to such process, article, or apparatus. Further, unless expressly stated to the contrary, “or” refers to an inclusive or and. not to an exclusive “or.”

[0042]Additionally, any examples or illustrations given herein are not to be regarded in any way as restrictions on, limits to, or express definitions of, any term or terms with which they are utilized. Instead, these examples or illustrations are to be regarded as being described with respect to one ...


PUM


Abstract

A system and method of testing vision performance includes displaying a visual recognition test to a subject and receiving from the subject a response to the visual recognition test. After receiving the response to the visual recognition test, a subsequent visual recognition test is selected based on the response received from the subject, the subsequent visual recognition test is displayed, and a response is received from the subject. The subsequent visual recognition tests are repeated until a predetermined criterion is reached. A vision performance score is determined based on the visual recognition tests displayed and the set of responses received from the subject and output from the system.

Description

RELATED APPLICATIONS [0001]This application is a continuation-in-part of U.S. Ser. No. 13 / 033,930, filed Feb. 24, 2011, which claims priority to U.S. provisional application Ser. No. 61 / 309,209, filed on Mar. 1, 2010. This application also claims priority to U.S. provisional application Ser. No. 61 / 452,159, flied on Mar. 14, 2011. The contents of all of these related applications are herein incorporated by reference in their entirety.FIELD OF THE INVENTION [0002]The present invention relates to methods and systems for vision testing.BACKGROUND OF THE INVENTION[0003]Vision is traditionally tested by using a letter chart mounted on the wall 20 feet in front of a subject. The subject is asked to read the chart and assigned a vision score (often as a Snellen fraction such as 20 / 40). Normal vision is denoted as 20 / 20 (or 6 / 6 when metric units are used and the distance is 6 meters). Twenty feet (or 6 meters) is essentially infinity from an optical perspective. The Snellen score compares t...

Claims


Application Information

Patent Timeline
IPC IPC(8): A61B3/02
CPCA61B3/032A61B3/028
Inventor KIRSCHEN, DAVID GARYLABY, DANIEL MOSES
Owner ALCON INC
Learn More