Method and device for determining plant material quality using images containing information about the quantum efficiency and the time response of the photosynthtic system
- Summary
- Abstract
- Description
- Claims
- Application Information
AI Technical Summary
Benefits of technology
Problems solved by technology
Method used
Image
Examples
example 1
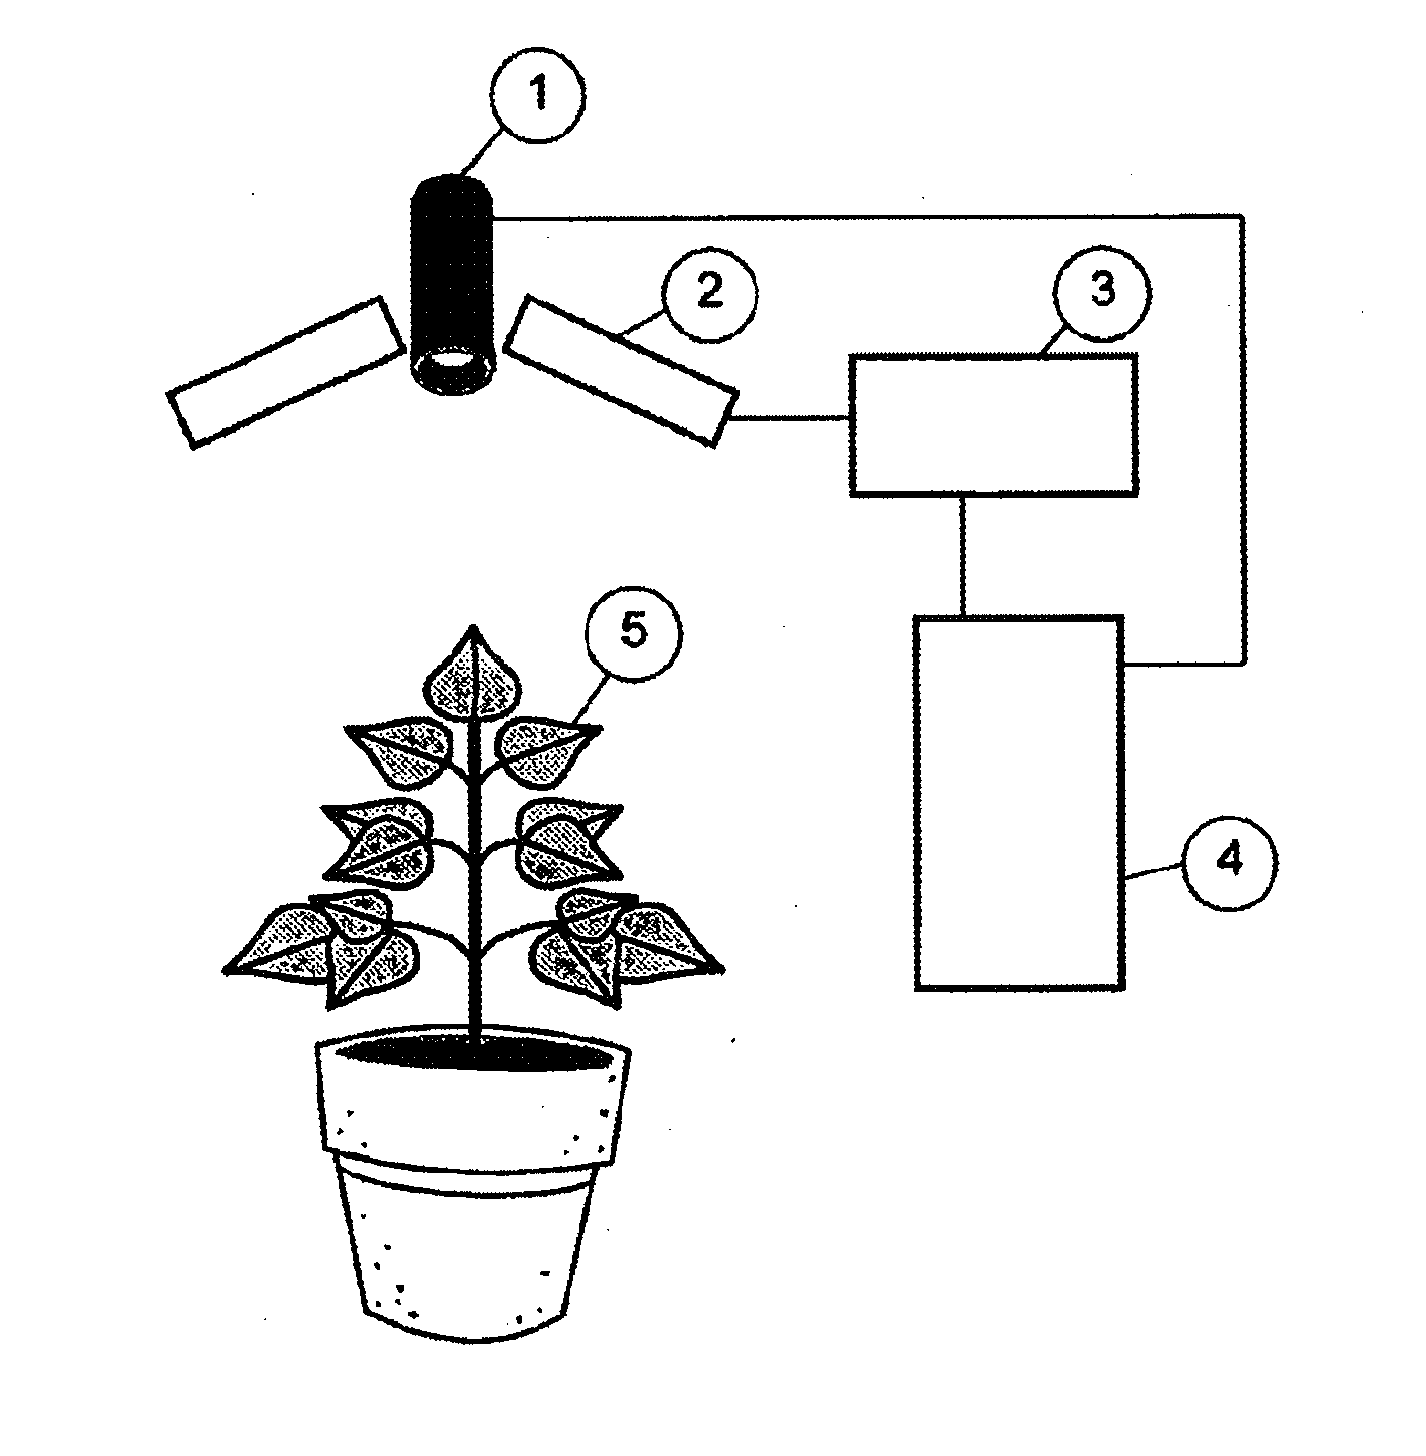
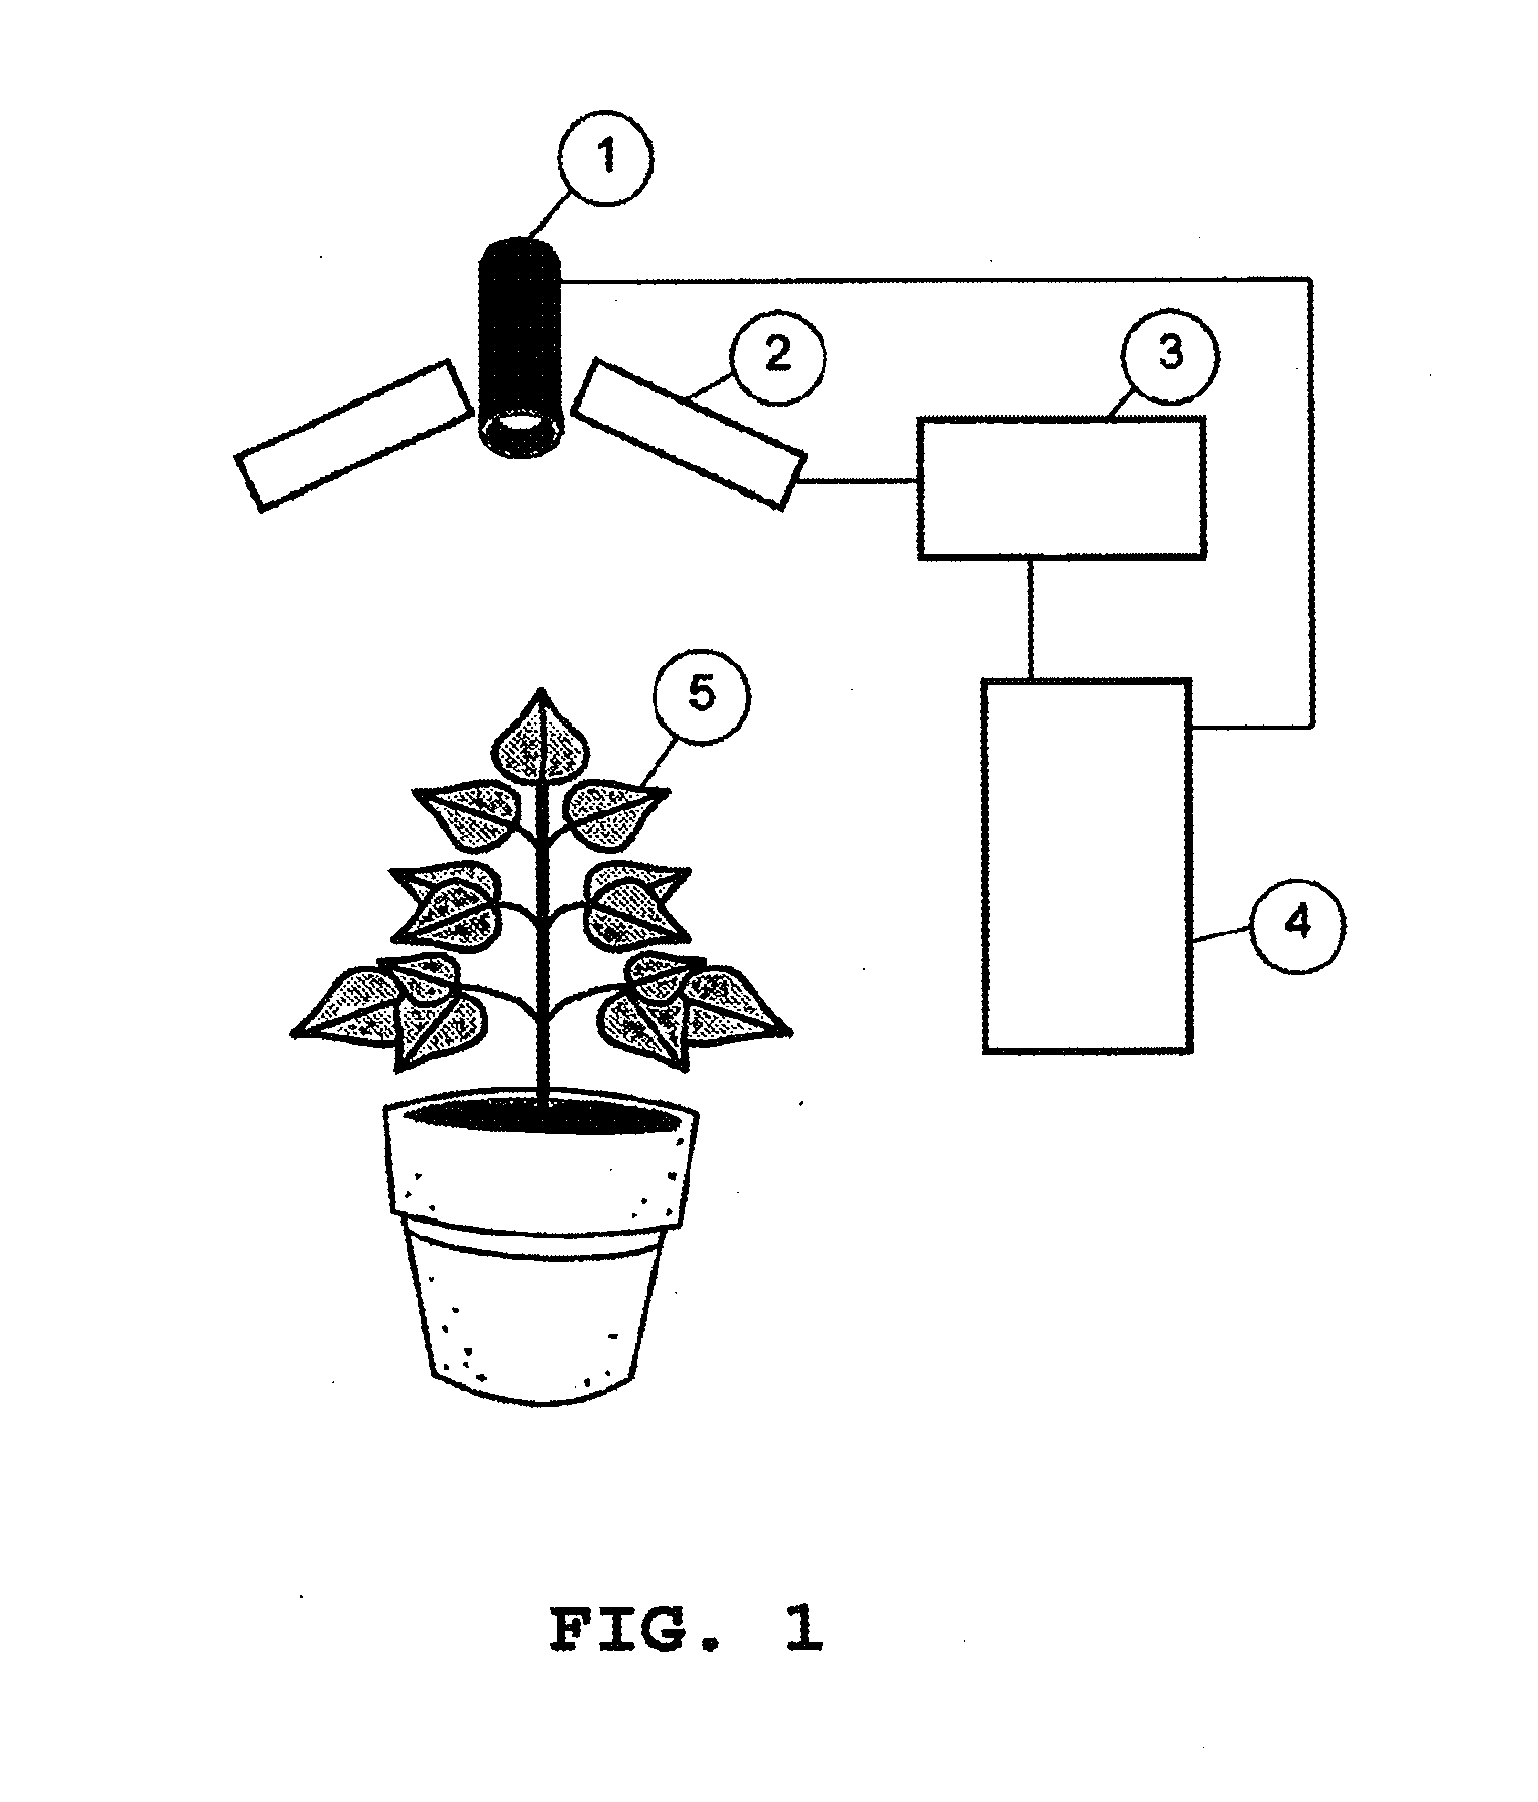
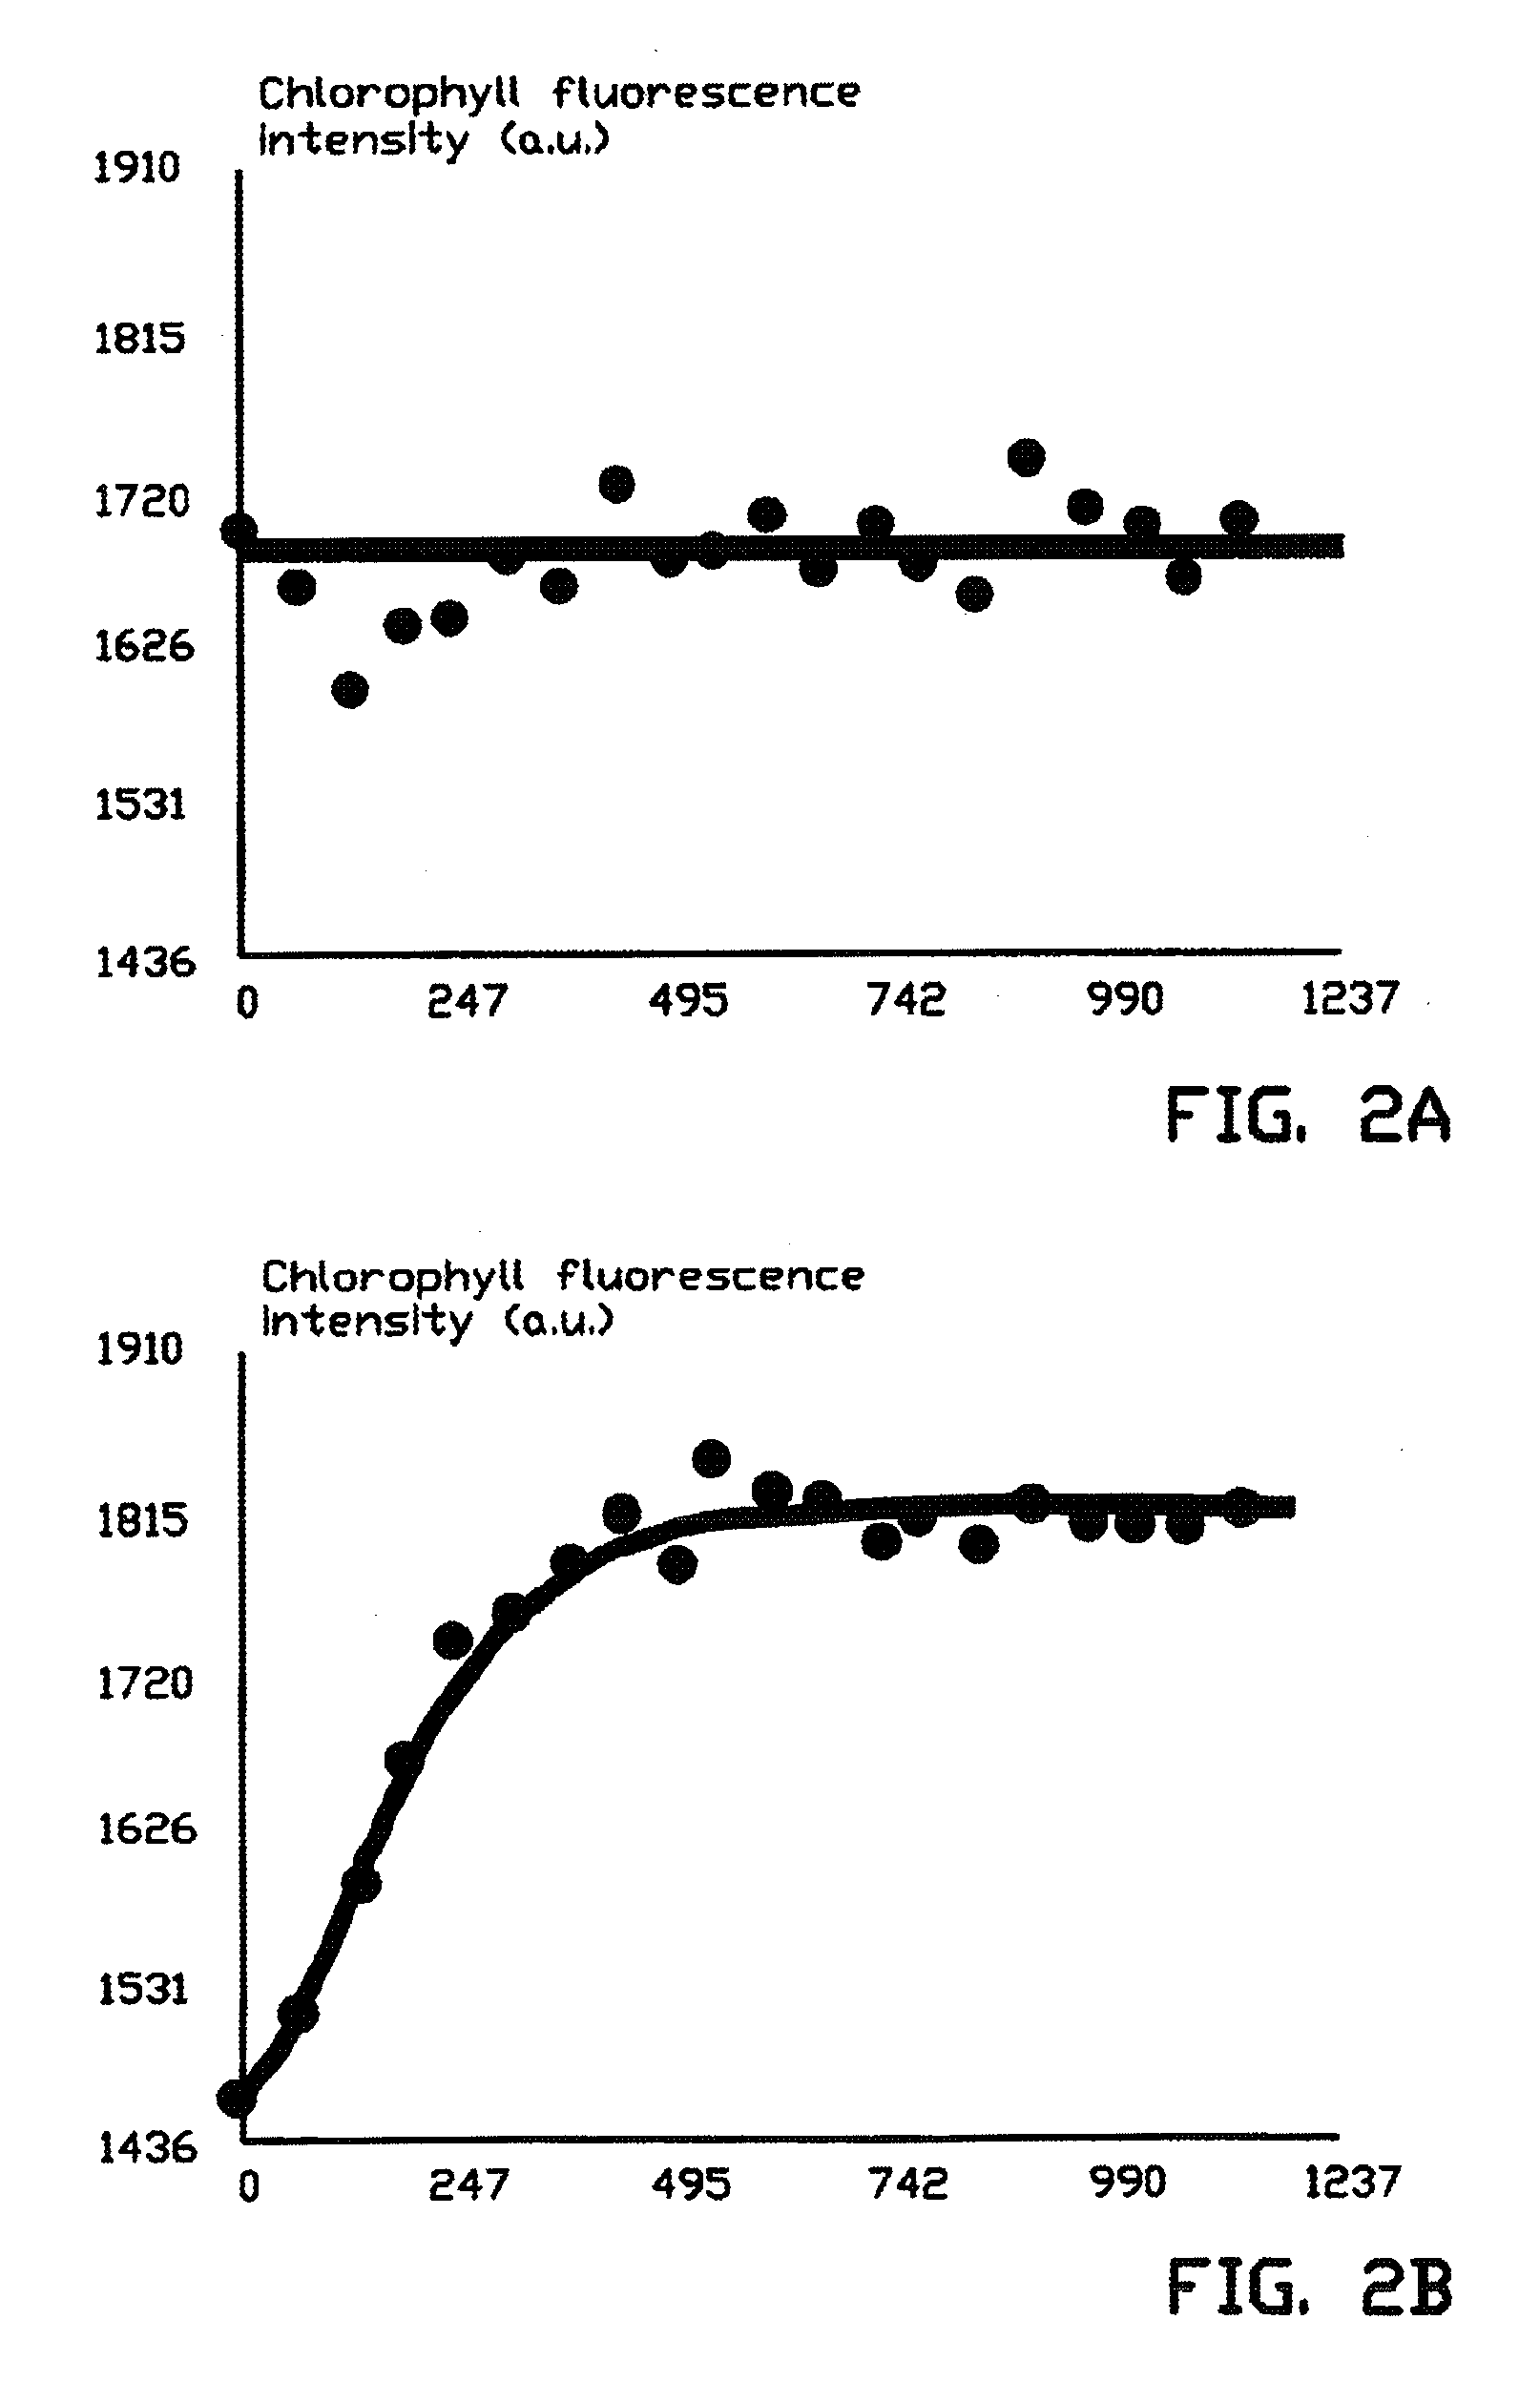
[0060]In this example the effect of a herbicide treatment on the chlorophyll fluorescence image and the QEP-image of the photosynthetic activity is described. The fluorescence images were measured with the above-mentioned preferred device according to FIG. 1. FIG. 2C shows the result of the first LED-pulse of the chlorophyll fluorescence image, Fstart, of a White Goosefoot plant (Chenopodium album) on which 48 hours previously a drop of 3 μl of herbicide solution was applied on one of the leaves. The herbicide action is visible in the image in the local lighter shade of the leaves. In FIGS. 2A and 2B the time (in ms) is plotted on the horizontal axis and the intensity of the chlorophyll fluorescence in arbitrary units is plotted on the vertical axis. In FIG. 2A it can be seen that the course of the chlorophyll fluorescence of an ill-functioning photosynthetic system is almost flat. A properly functioning photosynthetic system shows the course as indicated in FIG. 25. The signal grad...
example 2
[0061]In this example the effect of the septoria disease (Mycosphaerella graminloola) on the chlorophyll fluorescence image, the QEP-image and the TR-image of the photosynthetic activity of five leaves of barley (Hordeum vulgare) is described. The fluorescence images were measured using the above-mentioned preferred device according to FIG. 1. Leaves 2 and 5 are healthy, leaves 1, 3 and 4 are affected by the pathogen septoria. FIGS. 3A and 3B show the result of the first Fstart, and last, Fsat, LED pulse, respectively, of the chlorophyll fluorescence image of five barley leaves. It can clearly be seen that the fluorescence signal has increased. FIG. 3C shows the QEP-image of the photosynthetic activity that has been calculated using a computer for each pixel of the image according to formula 1 from the twenty images of FIGS. 3A and 38. In FIG. 3C the black / dark grey areas in the image of the leaves are hardly photosynthetically active anymore. The pixels have a value of QEP that is ...
example 3
[0062]This example shows that the measurement can be carried out in the light. This example also shows that in the light the effect of dehydration can be properly measured on the QEP-image of the photosynthetic activity. The fluorescence images were measured using the above-mentioned preferred device according to FIG. 1. The measurements were carried out on two African violet plants (Saintpaulia ionantha). The plant on the left in FIG. 4A and 4B still looks fine on the face of it but it is dehydrating. The plant has not been watered for approximately five days. The plant on the right has been watered sufficiently and looks good. For FIG. 4A the measurements were carried out in the dark and for FIG. 4B in the light at an intensity of 90 μmol / m2.second. The QEP-image of the photosynthetic activity was calculated using a computer for each pixel of the image according to formula 1 from the twenty recorded images. In FIG. 4 the dark areas in the image of the leaves are hardly photosynthe...
PUM
 Abstract
Description
Claims
Application Information
 - R&D
- Intellectual Property
- Life Sciences
- Materials
- Tech Scout
- Unparalleled Data Quality
- Higher Quality Content
- 60% Fewer Hallucinations
Browse by: Latest US Patents, China's latest patents, Technical Efficacy Thesaurus, Application Domain, Technology Topic, Popular Technical Reports.
© 2025 PatSnap. All rights reserved.Legal|Privacy policy|Modern Slavery Act Transparency Statement|Sitemap|About US| Contact US: help@patsnap.com


