Methods and Compositions for Modifying Gene Regulation and Dna Damage in Ageing
- Summary
- Abstract
- Description
- Claims
- Application Information
AI Technical Summary
Benefits of technology
Problems solved by technology
Method used
Image
Examples
example 1
Methods and Materials
(i) DNA Microarray Analysis
[0111]Thirty cases spanning ages of 26 to 106 were used for microarray analysis Dissections of the frontal pole were performed and tissue samples were snap frozen in liquid nitrogen. Total RNA was extracted and complementary RNA targets were prepared, labelled and hybridized with an Affymetrix Test 3 Array. Samples with acceptable RNA quality were hybridized to Affymetrix HG-U95Av2 oligonucleotide arrays representing about 12,000 probe sets. Three approaches were used to analyse the data. (Yankner, (2000) Nature 404, 125). Arrays were normalized and genes that correlated with age (Spearman rank correlation P-value Nature Genet. 25, 294-297. Correlation coefficient analysis was performed to assess the relatedness of each case to every other case using S-PLUS 2000 software (Insightful Corp.). Gene-wise standardized expression values of the genes that show Spearman rank correlation with age were used to compute Pearson correlation coeffic...
example 2
Age-Dependent Regulation of Gene Expression
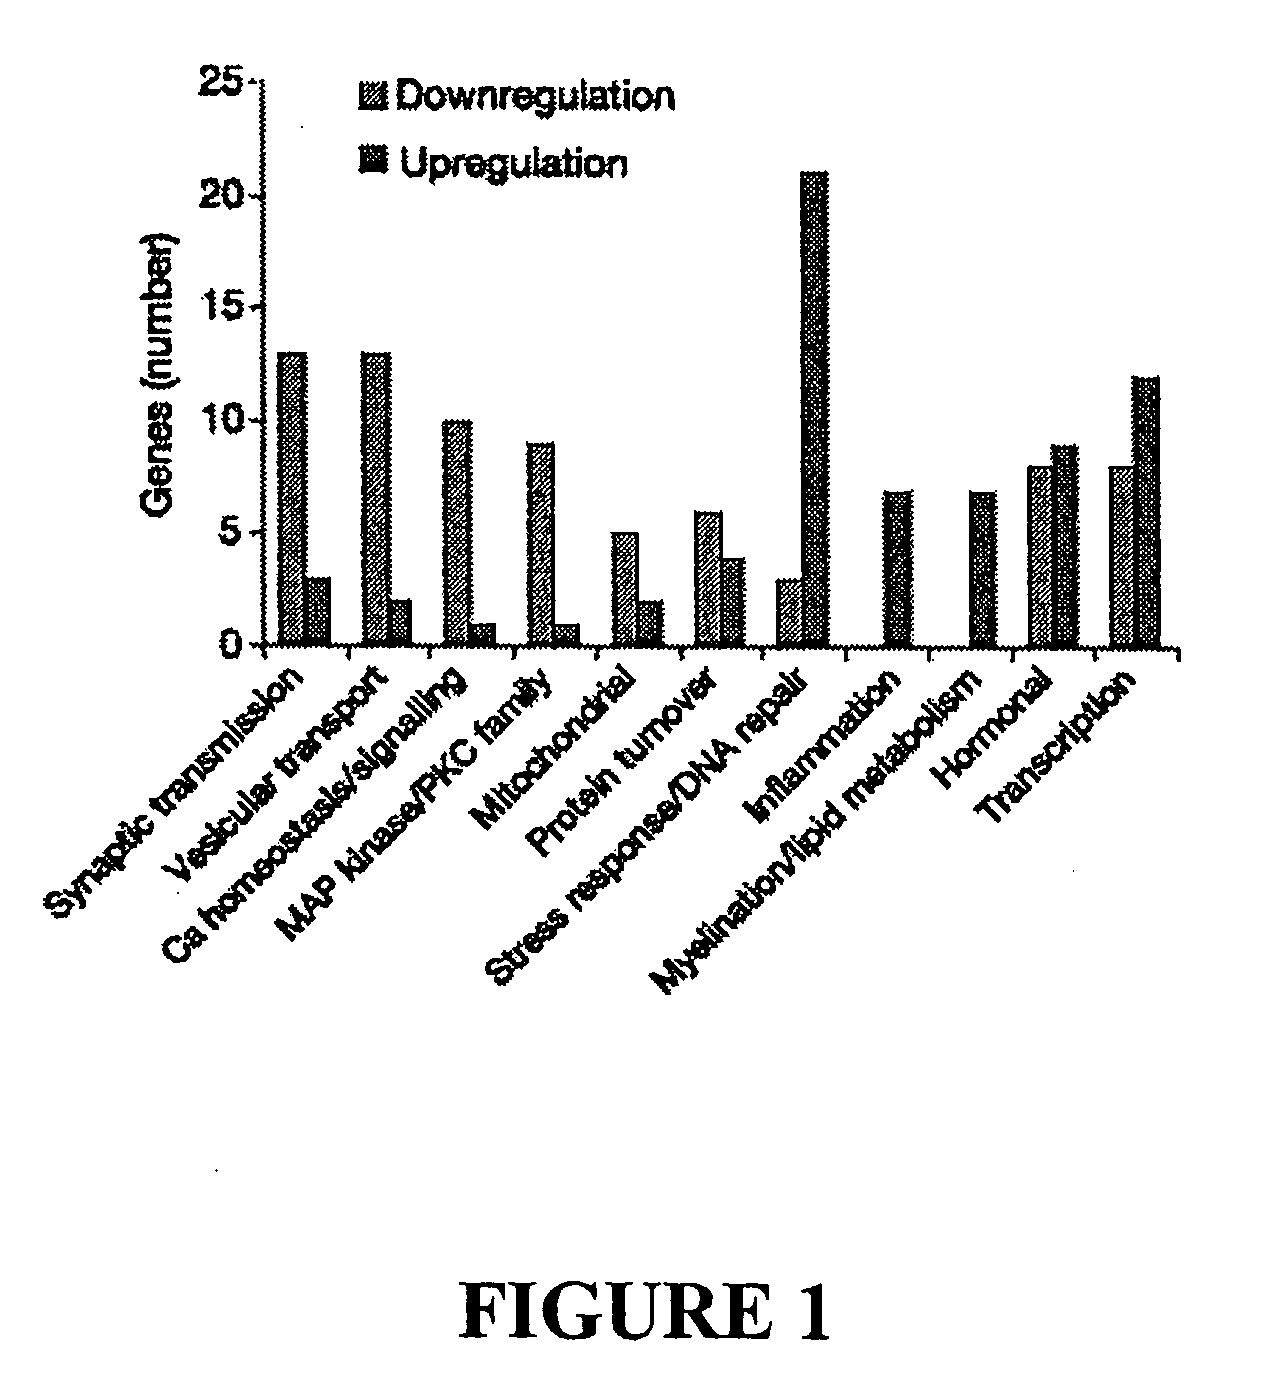
[0130]To investigate age-dependent regulation of gene expression in the human brain, RNA was harvested from postmortem samples of the frontal pole of 30 individuals ranging in age from 26 to 106 and was analysed using Affymetrix gene chips. To resolve genes with similar age-dependent expression patterns, the data was analysed for genes that correlate significantly with age and visualized by hierarchical clustering. This analysis demonstrated a cluster of co-regulated genes with reduced expression, and another cluster of genes with increased expression in aged individuals. To assess the rate of these gene changes, the entire transcriptome profile was compared at each age, and Pearson correlation coefficients were derived as a measure of similarity between any two ages. The group of individuals ≦42 years old showed the most homogeneous pattern of gene expression, and the group ≧73 years old was also relatively homogeneous (red colour indicati...
example 3
Quantitative Real-Time PCR Validation of the Microarray Data
[0132]Age-related genes were identified by performing statistical group comparison of frontal cortical samples from individuals ≦42 and ≧73 years old. About 4% of the approximately 1,000 genes analysed were significantly changed (1.5-fold or more, Table 3). To validate the microarray data, the quantitative real-time polymerase chain reaction (PCR) for a subset of functionally important genes, was compared. Microarray analysis and quantitative PCR generally showed consistent changes (FIG. 3A). The confirmation of microarray results for synaptic, calcium homeostasis and transport-related gene s is shown in FIG. 3A where mRNA levels of selected genes in the aged frontal cortex determined by microarray analysis and quantitative RT-PCR. Values are percentage mRNA levels in aged cases (≧73 years old) versus young cases (≦42 years old) and represent the mean ±s.d.; n=4. Furthermore, consistent changes at the protein level were obs...
PUM
| Property | Measurement | Unit |
|---|---|---|
| Time | aaaaa | aaaaa |
| Fraction | aaaaa | aaaaa |
| Fraction | aaaaa | aaaaa |
Abstract
Description
Claims
Application Information
 - R&D
- Intellectual Property
- Life Sciences
- Materials
- Tech Scout
- Unparalleled Data Quality
- Higher Quality Content
- 60% Fewer Hallucinations
Browse by: Latest US Patents, China's latest patents, Technical Efficacy Thesaurus, Application Domain, Technology Topic, Popular Technical Reports.
© 2025 PatSnap. All rights reserved.Legal|Privacy policy|Modern Slavery Act Transparency Statement|Sitemap|About US| Contact US: help@patsnap.com


