
Quantum dot biolabeling and immunomagnetic separation for detection of contaminants

a biolabeling and immunomagnetic separation technology, applied in the field of quantum dot biolabeling and immunomagnetic separation for the detection of contaminants, can solve the problems of requiring 18 or more hours, difficult to detect contaminants, and generally time-consuming

Inactive Publication Date: 2008-06-12
THE BOARD OF TRUSTEES OF THE UNIV OF ARKANSAS
View PDF8 Cites 52 Cited by
  • Summary
  • Abstract
  • Description
  • Claims
  • Application Information

AI Technical Summary

Benefits of technology

The patent describes methods for detecting and quantifying contaminants in a starting material using bead-based separation and quantum dot-based detection. The methods involve contacting the starting material with a bead coupled to an affinity moiety that binds to the contaminant to form a target, which is then separated from the starting material. The target is then contacted with a quantum dot coupled to a second affinity moiety that binds to the contaminant to form a labeled target. The quantum dot has a characteristic emission spectrum that is detected and compared to the emission spectra of a labeled target containing known numbers of contaminants to quantify the contaminants in the starting material. The methods provide sensitive, specific, and rapid methods for detecting and quantifying contaminants in starting materials.

Problems solved by technology

Detection of contaminants is difficult when only a small amount must be detected in a large sample volume or within a complex sample such as a food product or soil.
The bacteria captured by antibody-coated beads can be detected by conventional plating, which is reliable, but generally time-consuming, requiring 18 or more hours.

Method used


Image

  • Quantum dot biolabeling and immunomagnetic separation for detection of contaminants
  • Quantum dot biolabeling and immunomagnetic separation for detection of contaminants
  • Quantum dot biolabeling and immunomagnetic separation for detection of contaminants

Examples


example 1

Detection of E. coli O157:H7 with QD Biolabeling Coupled with Immunomagnetic Separation

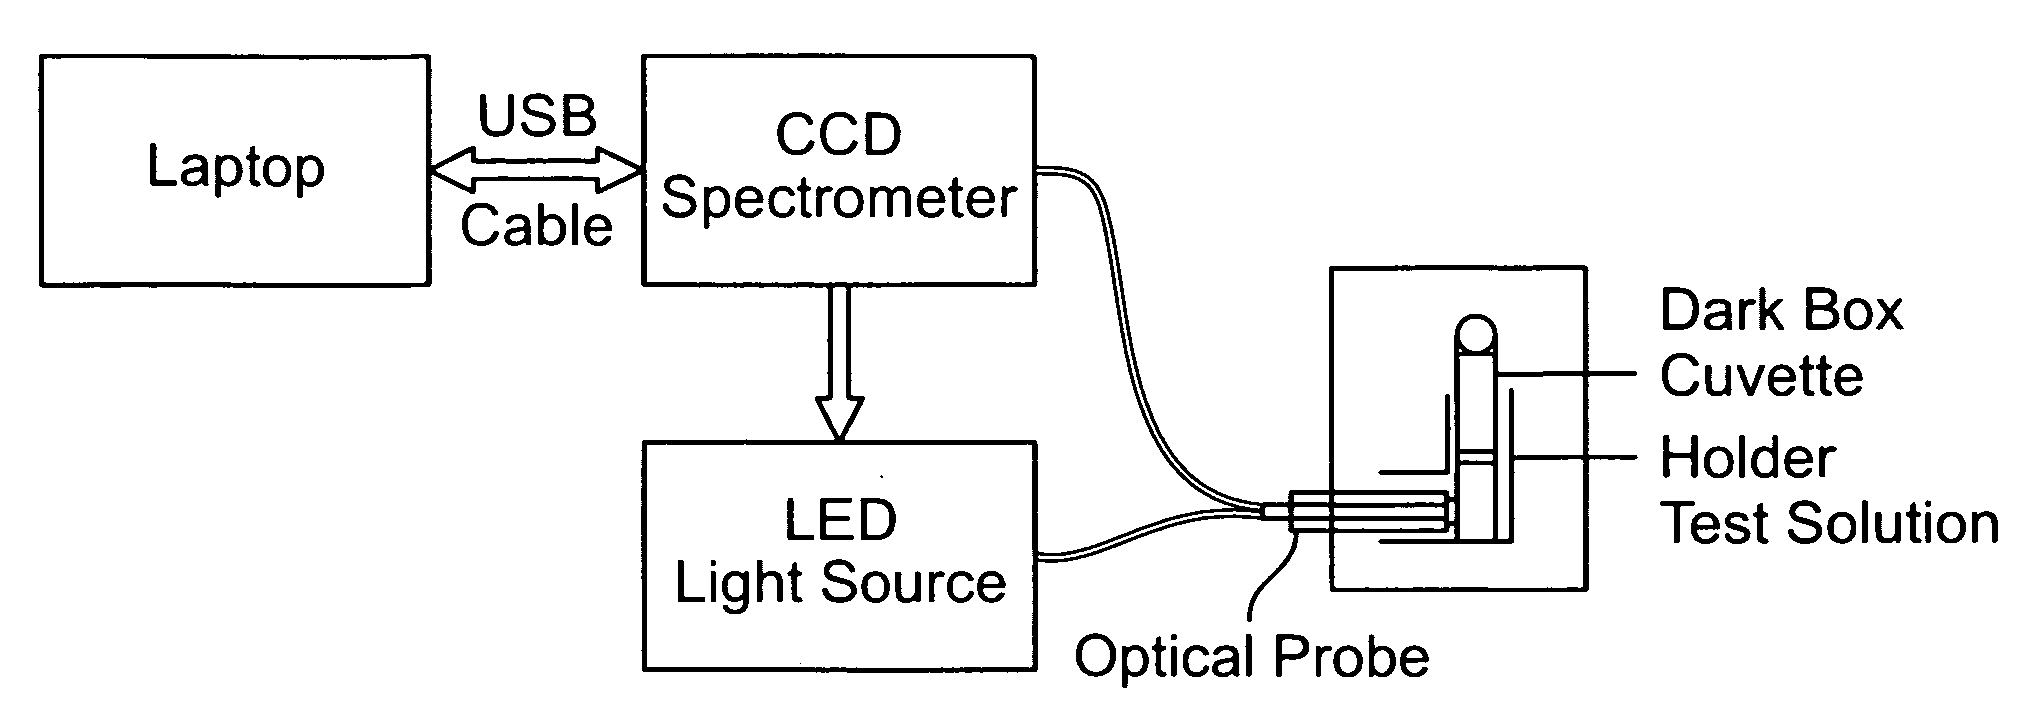
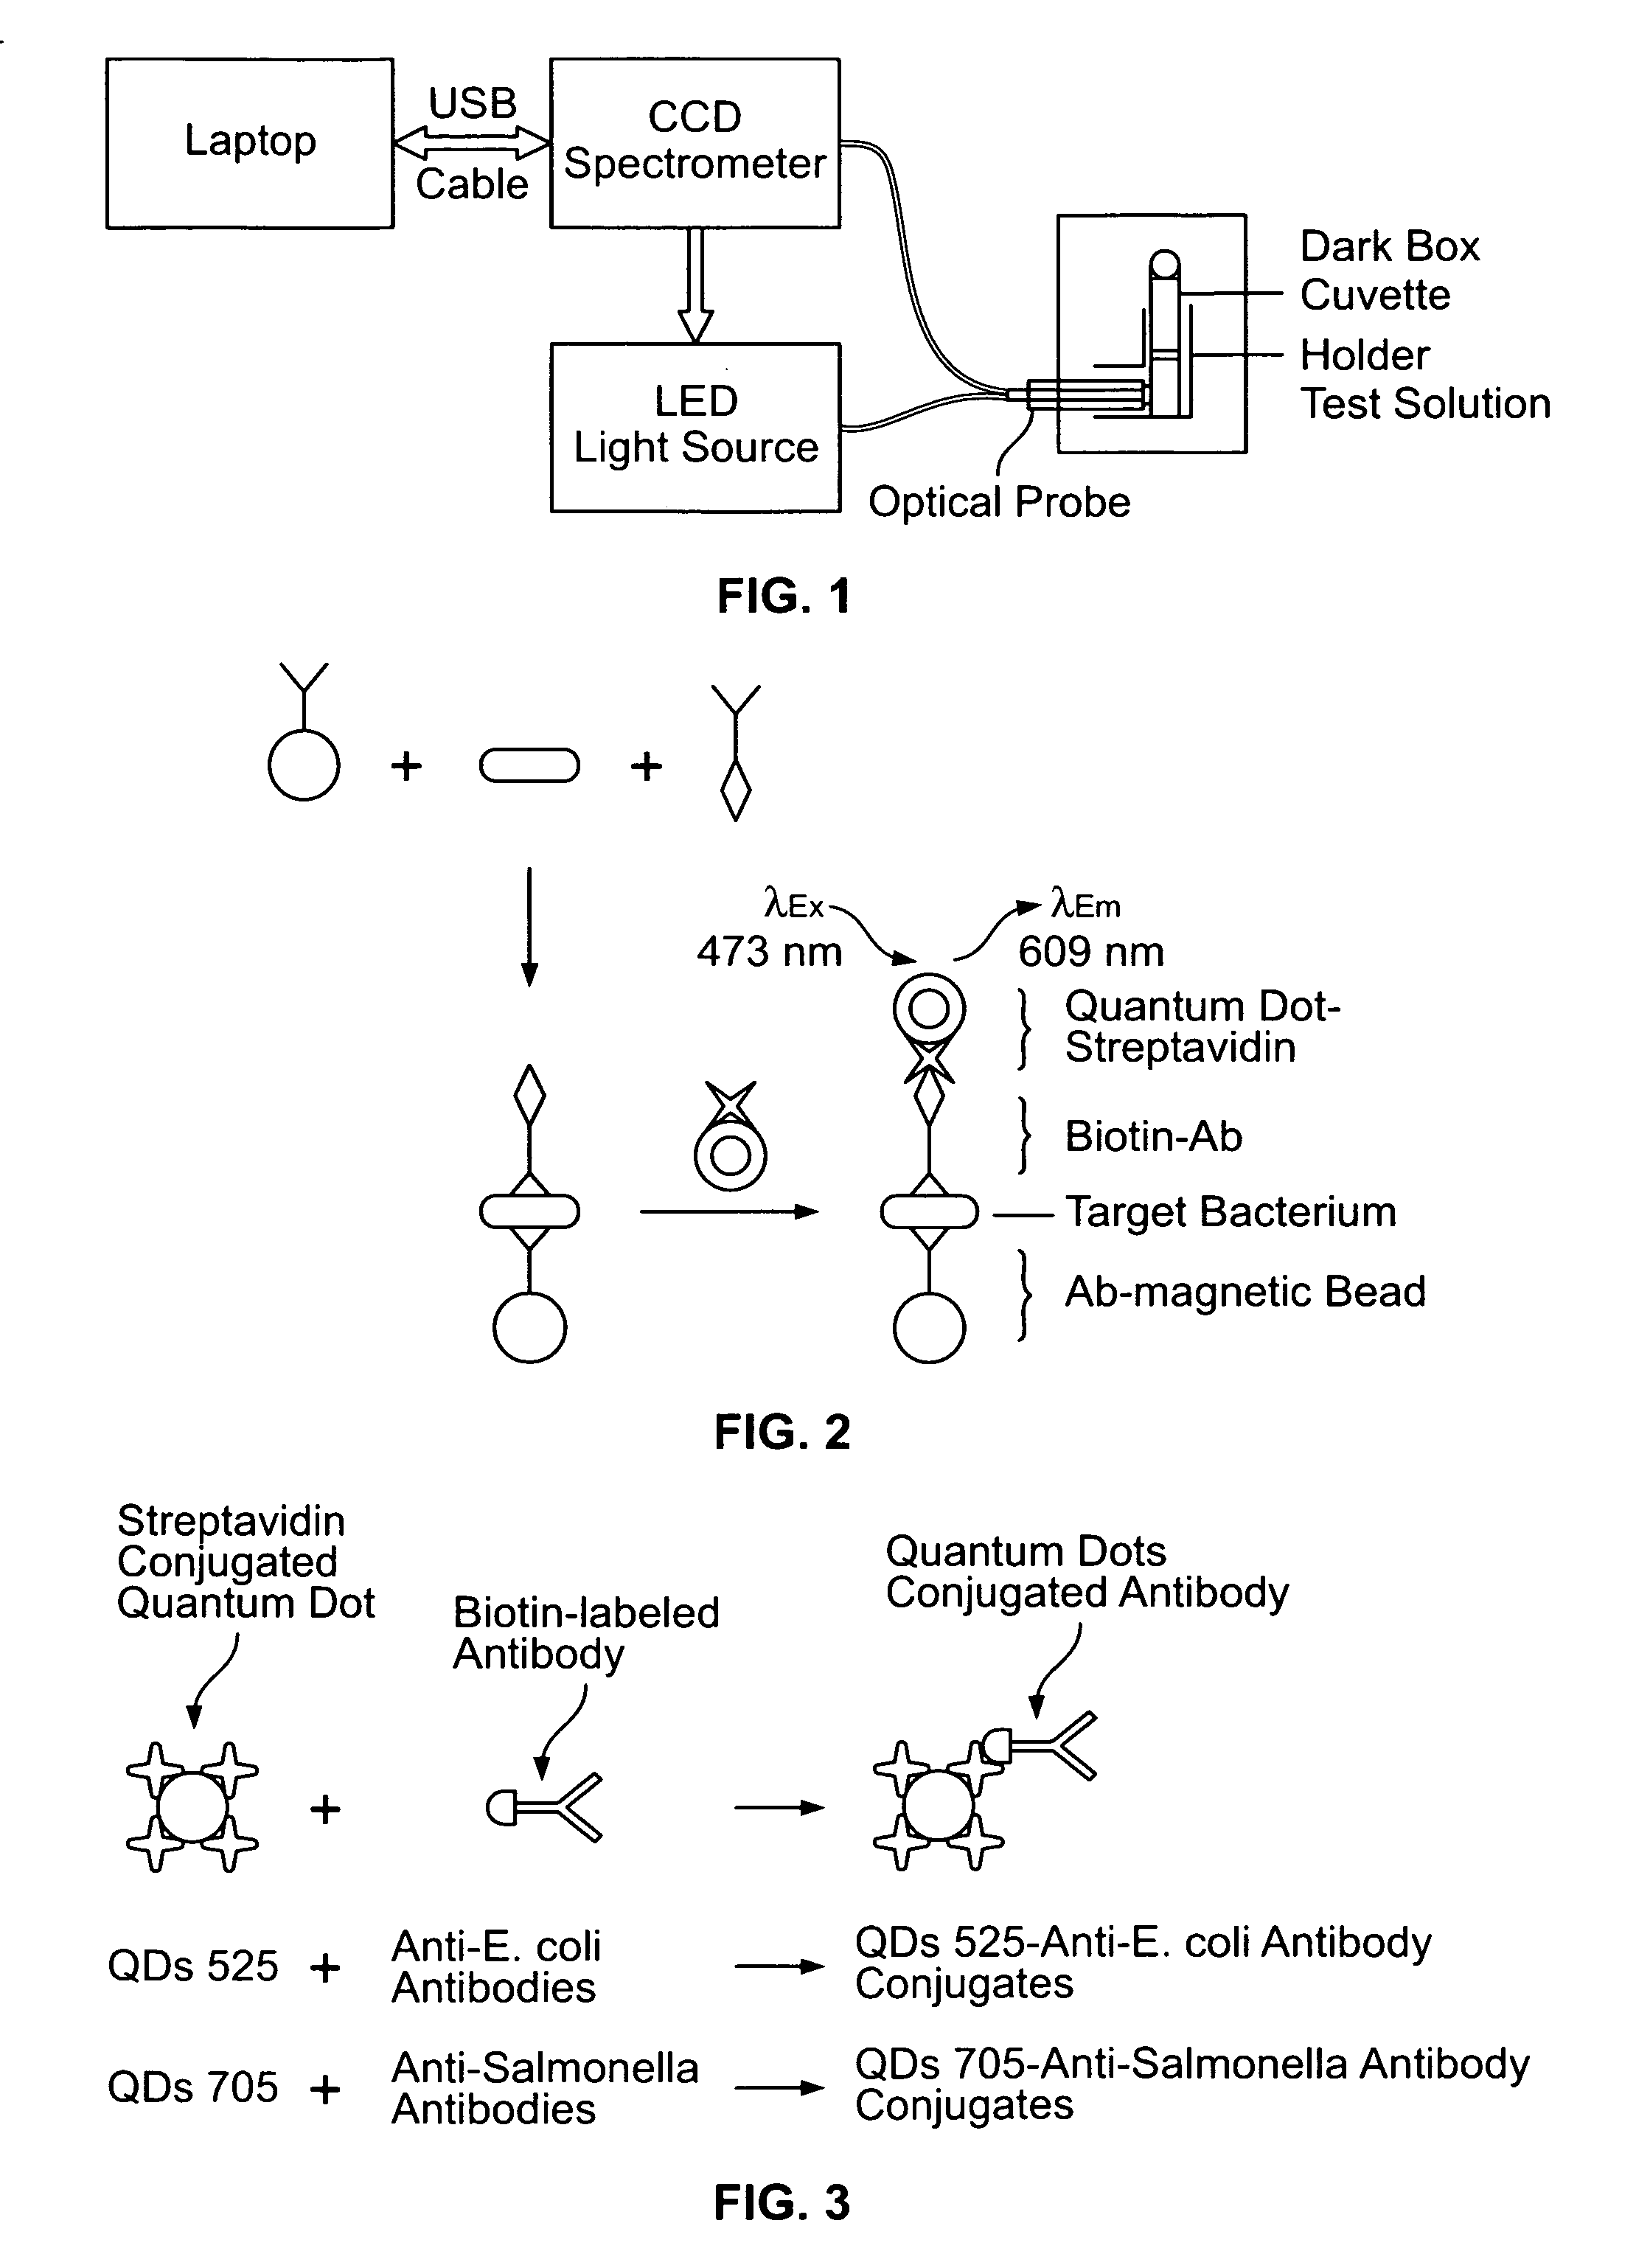
[0047]Reagents. CdSe—ZnS quantum dot (QD)-streptavidin conjugates (10-15 nm in size) having a maximum emission wavelength of 609 nm (Qdot 605, Cat. #1000-1) and the incubation buffer (Qdot™ 605, Cat. #1000-1) were obtained from Quantum Dot Corp. (Hayward, Calif.). Superparamagnetic, polystyrene microscopic beads covalently coated with affinity-purified polyclonal anti-E. coli O157 antibodies (Dynabeads anti-E. coli O157, diameter 2.8 μm, Cat. #710.04) were purchased from Dynal Biotech Inc. (Lake Success, N.Y.). Biotin conjugated anti-E. coli antibodies (Cat. #B65109B) were supplied by Biodesign International (Saco, Me.). Fluorescein isothiocyanate (FITC)-labeled affinity purified anti-E. coli O157:H7 antibodies (Cat. #02-95-90) were manufactured by Kirkegaard & Perry Laboratories (Gaithersburg, Md.). Phosphate buffered saline (PBS, 0.01 M, pH 7.4) and 1% (w / v) bovine serum albumin (BSA)-PBS (pH 7....

example 2

Fluorescence Intensity is Related to Contaminant Quantity

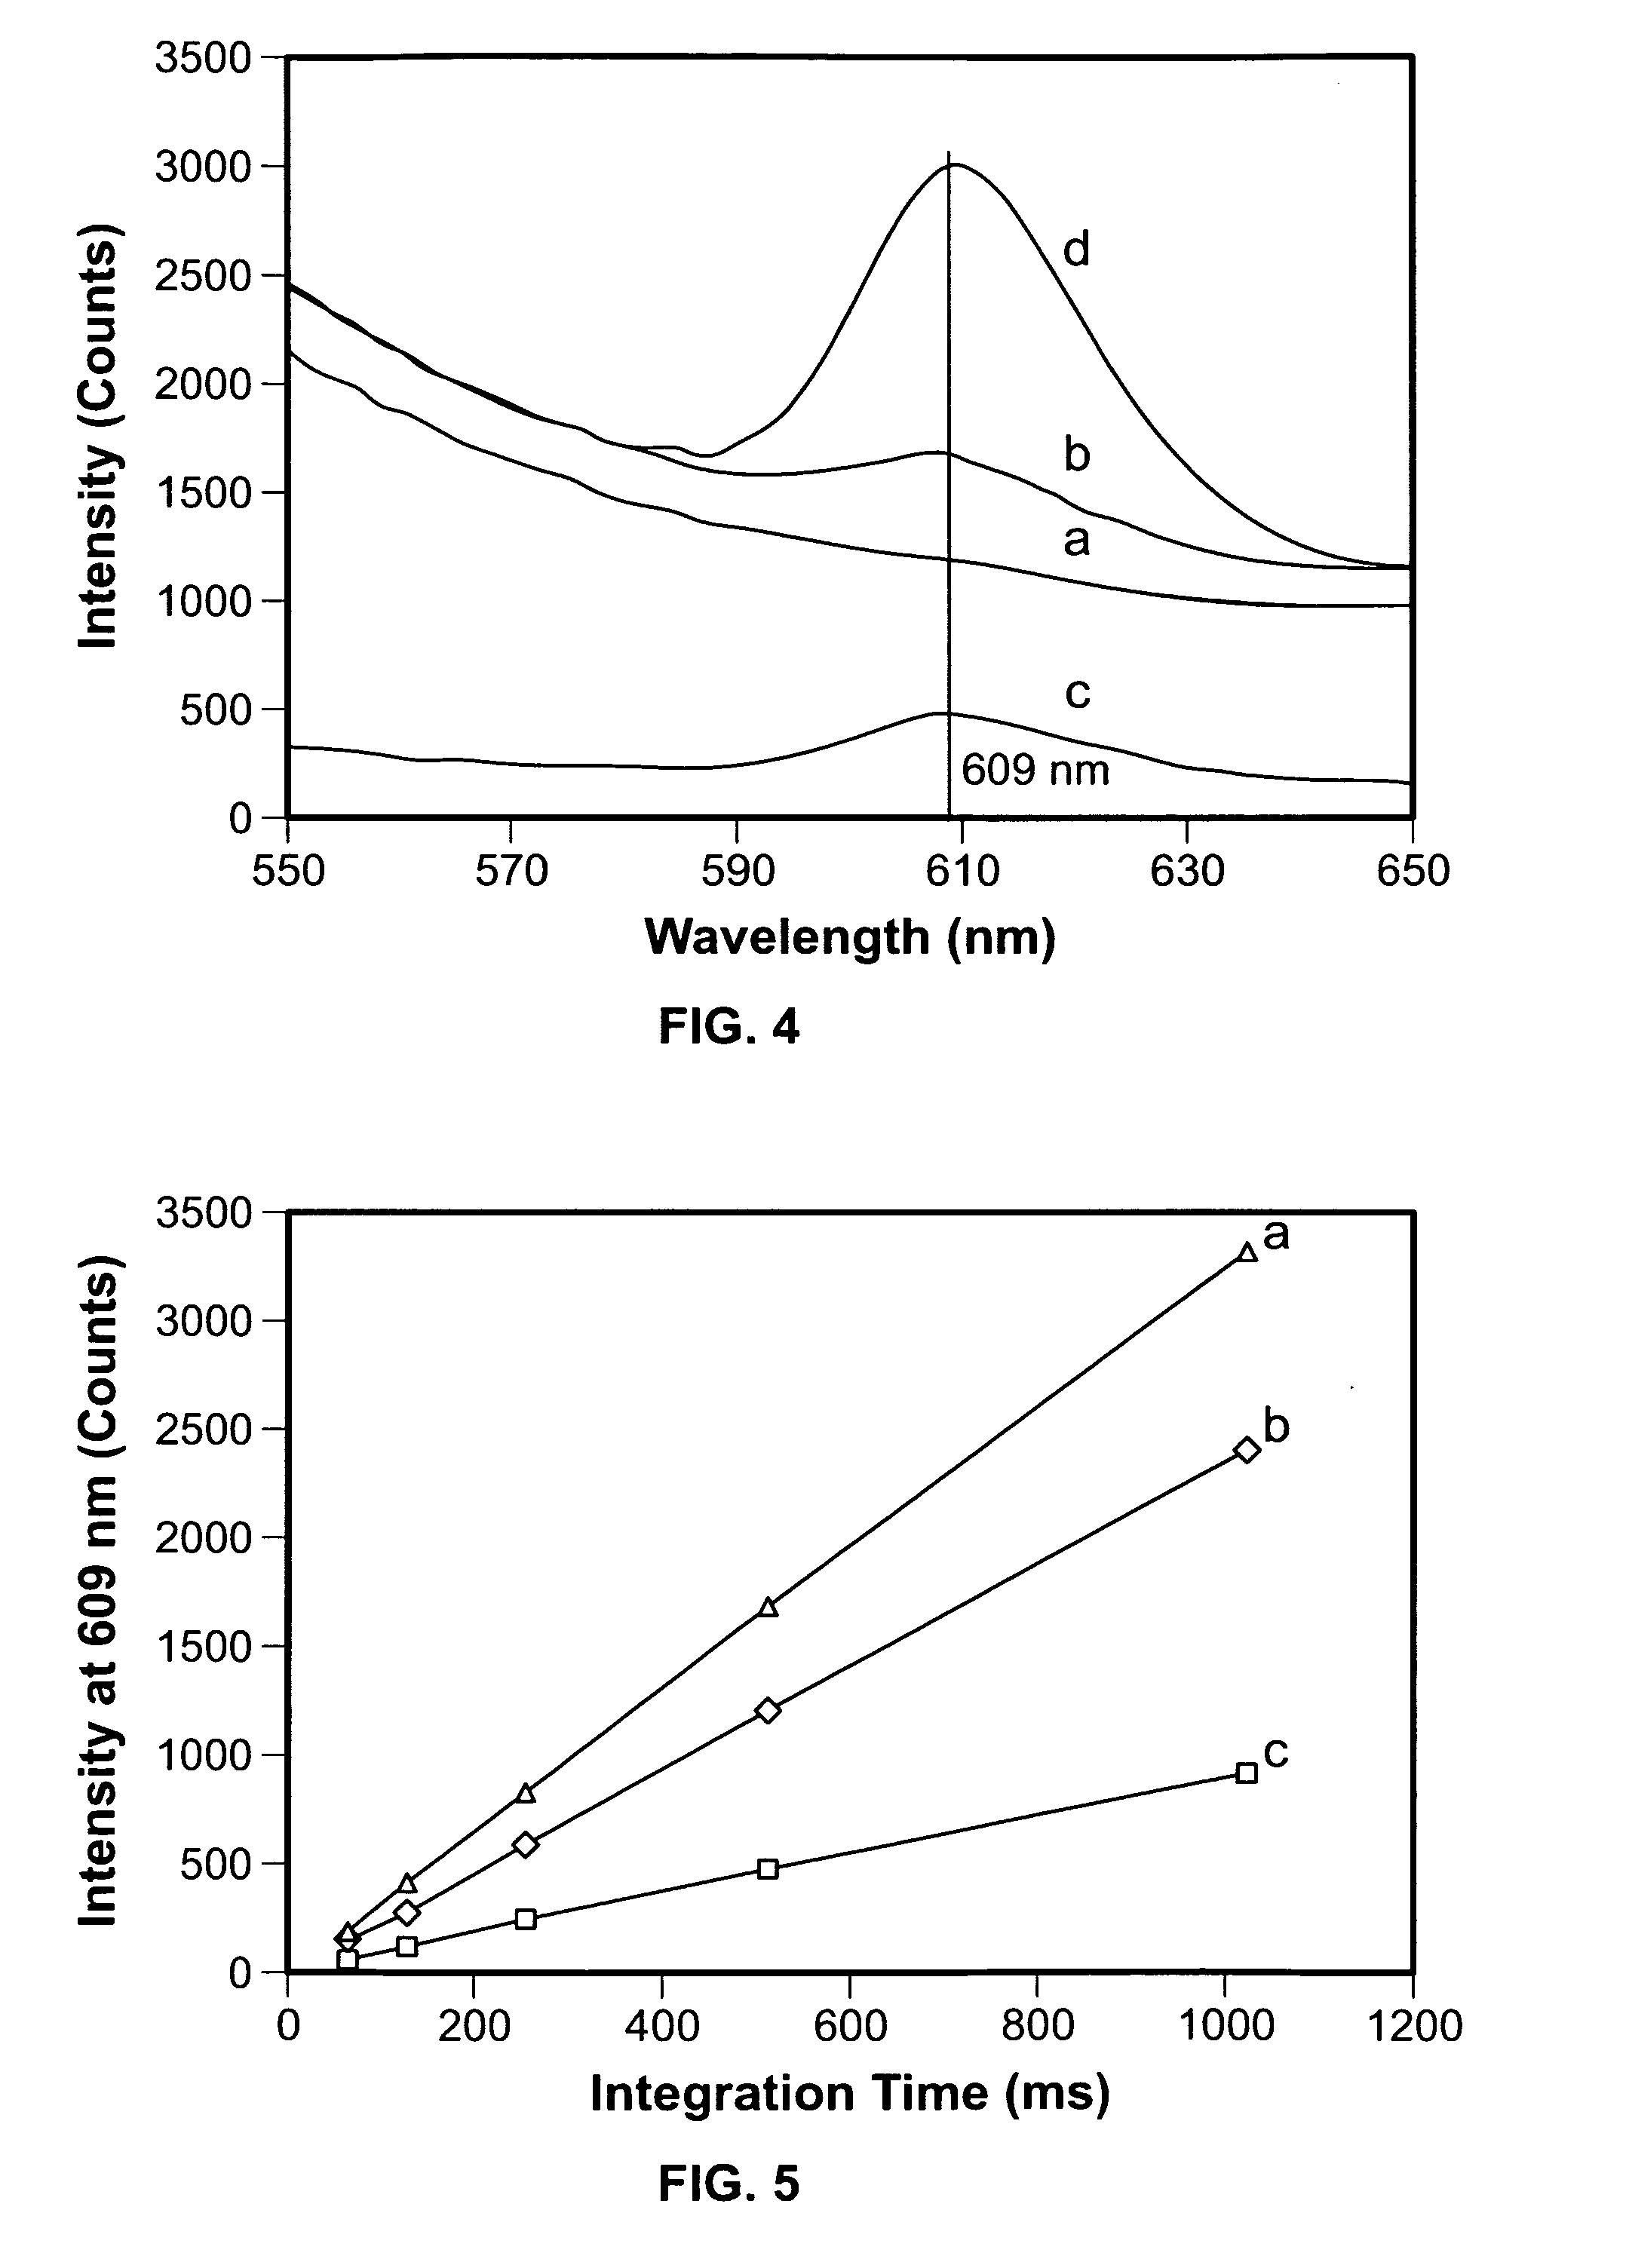
[0053]After subtracting the background signal of the blank, the intensities of fluorescence emission at 609 nm were correlated to the cell concentrations of E. coli O157:H7. Typical fluorescence spectra of 101-107 CFU / mL E. coli O157:H7 are presented in FIG. 6 after subtracting the blank. As shown in this figure, the spectra of 103-107 CFU / mL all have a peak emission around 609 nm, but those of 101 and 102 CFU / mL do not have such a peak. The peak intensity at 609 nm as a function of the cell concentration is illustrated in FIG. 7. The intensity of the peak increases with increasing cell concentration in the range of 103-107 CFU / mL. However, the signals of the blank and the samples of 101 and 102 CFU / mL are not distinguishable. The limit to the level of detection may be due to the high background reflection / backscattering of the beads. The detection limit obtained in this work was ca. 103 CFU / mL and the total detection time, fr...

example 3

Comparison to Traditional Fluorophores

[0054]FITC-labeled anti-E. coli 0157 antibody solution containing ca. 170 nM FITC was tested for labeling the target for comparison to the QD detection method described above. Measured on the CCD spectrometer with the blue LED as excitation source, the FITC-labeled antibody solution showed a peak fluorescence emission at 521 nm, and the relative peak intensity of FITC to QD was 1:230. However, the FITC-labeled targets did not give any emission peaks and the sample signals could not be discriminated from the blank at a concentration of up to 106 CFU / mL. A Fluoro-Tec fluorometer (St. John Associates, Beltsville, Md.) configured specifically for the FITC measurement was thus used for detecting the FITC-labeled targets. The fluorometer utilizes a 931 B photomultiplier tube (PMT) as detector, which is more sensitive but also more expensive than the CCD detector. Using the PMT-based fluorometer, the FITC-labeled targets were detectable at a sample con...


PUM

PropertyMeasurementUnit
sizeaaaaaaaaaa
excitation wavelengthaaaaaaaaaa
FWHMaaaaaaaaaa

Abstract

Methods are provided for detecting, separating, isolating and quantifying contaminants in starting materials by separating the contaminant from the starting material using a bead coupled to an affinity moiety and quantum dot-labeling the contaminant. The contaminant is detected by the characteristic emission spectrum of the quantum dot. Also, competitive binding methods are provided wherein the starting material and a control material are contacted with a quantum dot coupled to an affinity moiety capable of binding the contaminant and a competitor complex. A decrease in the intensity of the characteristic emission spectrum of the quantum dot associated with the competitor complex from the starting material as compared to that of the control material is indicative of the presence of the contaminant in the starting material.

Description

CROSS-REFERENCE TO RELATED APPLICATIONS[0001]This application claims priority to U.S. provisional applications 60 / 642,356, and 60 / 642,336, both of which were filed on Jan. 7, 2005. These provisional applications are incorporated herein by reference in their entireties.STATEMENT REGARDING FEDERALLY SPONSORED RESEARCH[0002]The invention was made with United States government support under Grant Number USDA / CSREES 99-34211-7563 awarded by the United States Department of Agriculture. The United States government has certain rights in this invention.INTRODUCTION[0003]This invention relates to methods for detecting, separating and quantifying contaminants in a variety of starting materials including, but not limited to food products, clinical samples and environmental samples.[0004]The ability to detect the presence of small amounts of contaminants, such as bacteria, in a complex background is of vital importance to biotechnology, medical diagnosis and the fight against bioterrorism. Dete...

Claims


Application Information

Patent Timeline
Patent Type & Authority Applications(United States)
IPC IPC(8): C02F1/48B03C1/30
CPCB82Y15/00G01N35/0098G01N33/588G01N33/54326
Inventor LI, YANBINSU, XIAO-LIYANG, LIJU
Owner THE BOARD OF TRUSTEES OF THE UNIV OF ARKANSAS
Learn More