Methods for predicting drug responsiveness in cancer patients
a cancer patient and drug responsiveness technology, applied in the field of cancer patient drug responsiveness prediction, can solve the problems of cancer cells often developing resistance to a previously effective therapy, often losing critical time,
- Summary
- Abstract
- Description
- Claims
- Application Information
AI Technical Summary
Benefits of technology
Problems solved by technology
Method used
Image
Examples
example 1
[0127]Identification of Biomarkers of Sensitivity and Resistance to Irofulven Using Affymetrix HG-U133A Arrays
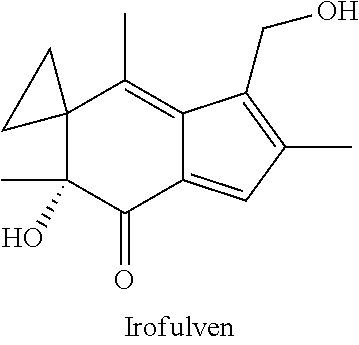
[0128]DNA chip measurements of the 60 cancer cell lines of the NCI60 data set were performed using Affymetrix HG-U133A arrays and logit normalized. For each array, the logit transformation was performed followed by a Z-transformation to mean zero and SD 1, and correlated to growth inhibition (log(GI50)). Growth inhibition data of irofulven against the same cell lines were downloaded from the National Cancer Institute. Each gene's expression in each cell line was correlated to the growth of those cell lines (log(GI50)) in the presence of irofulven. The Pearson correlation coefficient was then determined to identify genes positively and negatively correlated to sensitivity to irofulven. Tables 1 and 2 show the top positively correlated genes (the biomarkers of sensitivity) and negatively correlated genes (the biomarkers of resistance) using the Affymetrix HG-U133A arrays.
[0129...
example 2
[0131]Identification of Biomarkers of Sensitivity and Resistance to Irofulven Using Affymetrix HG-U133_Plus_2 Arrays
[0132]DNA chip measurements of the 60 cancer cell lines of the NCI60 data set were also performed using HG-U133_Plus_2 arrays and logit normalized. For each array, the logit transformation was performed followed by a Z-transformation to mean zero and SD 1, and correlated to growth inhibition (log(GI50)). Growth inhibition data of irofulven against the same cell lines were downloaded from the National Cancer Institute. Each gene's expression in each cell line was correlated to the growth of those cell lines (log(GI50)) in the presence of irofulven. The Pearson correlation coefficient was then determined to identify genes positively and negatively correlated to sensitivity to irofulven. Tables 3 and 4 show the top positively correlated genes (the biomarkers of sensitivity) and negatively correlated genes (the biomarkers of resistance) using the Affymetrix HG-U133_Plus_2 ...
example 3
[0135]Predicting Responsiveness to Irofulven in Various Cancer Patient Populations
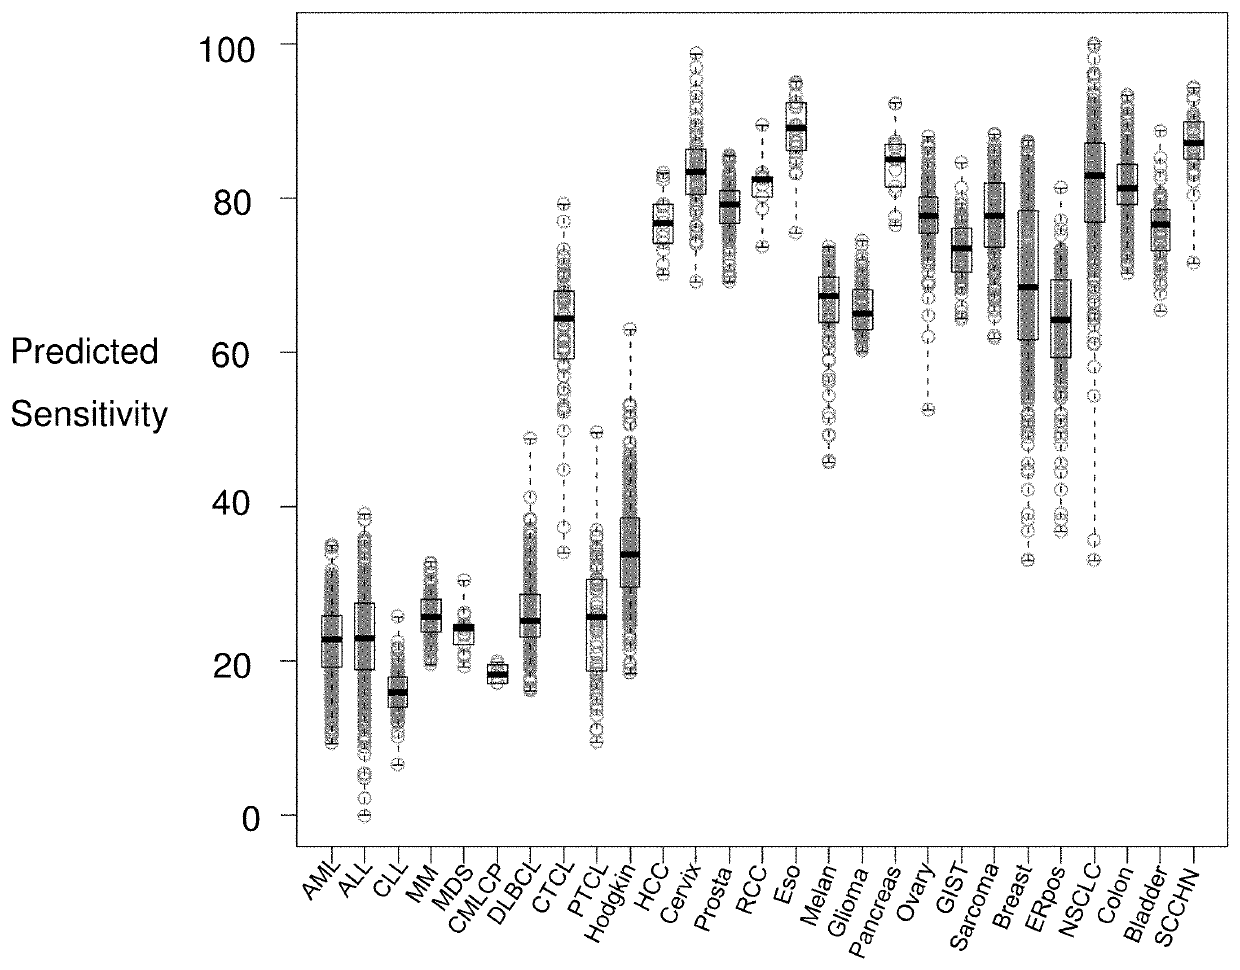
[0136]An mRNA-based predictor of responsiveness to irofulven developed according to the methods of the invention was applied to 3,522 patients having a variety of cancers. Each patient had a pre-treatment measurement of gene expression with an Affymetrix array. The predicted irofulven sensitivity of each patient was calculated as the difference between the mean of the expression levels of the biomarkers of sensitivity and the mean of the expression levels of the biomarkers of resistance for the patient. When the patients were grouped by cancer types, and cancer types predicted to be more responsive to irofulven were identified (FIG. 1).
[0137]Of 27 different cancer types, solid tumor cancers were predicted to be more responsive to irofulven treatment than hematological cancers. In particular, patients with prostate cancer, ovarian cancer, hepatocellular carcinoma (HCC), breast cancer, cervical cancer, r...
PUM
 Abstract
Description
Claims
Application Information
 - R&D
- Intellectual Property
- Life Sciences
- Materials
- Tech Scout
- Unparalleled Data Quality
- Higher Quality Content
- 60% Fewer Hallucinations
Browse by: Latest US Patents, China's latest patents, Technical Efficacy Thesaurus, Application Domain, Technology Topic, Popular Technical Reports.
© 2025 PatSnap. All rights reserved.Legal|Privacy policy|Modern Slavery Act Transparency Statement|Sitemap|About US| Contact US: help@patsnap.com


