
Methods for multi-resolution analysis of cell-free nucleic acids

a cell-free nucleic acid and multi-resolution technology, applied in the field of cell-free nucleic acid multi-resolution analysis, can solve the problems of reducing the sensitivity of detection at the hotspot region, the size of the overall panel, and the limited amount of sequencing data that can be obtained from a sample, so as to maximize the ranking function of sequencing load and utility, improve the accuracy of detecting an insertion, and improve the effect of capture efficiency

Active Publication Date: 2021-07-13
GUARDANT HEALTH
View PDF126 Cites 3 Cited by
  • Summary
  • Abstract
  • Description
  • Claims
  • Application Information

AI Technical Summary

Benefits of technology

The present disclosure provides a method for generating a bait set to capture specific genomic regions of interest. The method involves identifying backbone genomic regions and hot-spot genomic regions using a ranking function, creating a first bait set to capture the backbone genomic regions and a second bait set to capture the hot-spot genomic regions. The second bait set has higher capture efficiency than the first bait set. The technical effect of this method is to improve the efficiency and accuracy of capturing specific genomic regions, which may be important for disease diagnosis and treatment.

Problems solved by technology

The amount of sequencing data that can be obtained from a sample is finite, and constrained by such factors as the quality of nucleic acid templates, number of target sequences, scarcity of specific sequences, limitations in sequencing techniques, and practical considerations such as time and expense.
Another factor is the size of the overall panel.
It will be evident that for any given read budget, increasing the percentage of reads allocated to the backbone regions will decrease the sensitivity of detection at the hotspot regions.
Conversely, increasing the sensitivity of detection at the hotspot regions, by increasing the amount of the read budget allocated to hotspot regions, decreases the detection of the backbone regions.
The relative fraction of reads spent on sequencing fragments mapping to the genomic region also influences the sequencing load of the genomic region, since some genomic regions may be especially difficult to sequence reliably (e.g., due to high GC-content or the presence of highly repeating sequences) and hence may require higher sequencing depth for analysis at the bait's desired resolution.
Similarly relative coverage as a result of sequence bias, amplification bias, and / or capture bias of the genomic region may also affect the sequencing load of the genomic region.
The non-biological error may comprise error in sequencing at a plurality of genomic base locations.
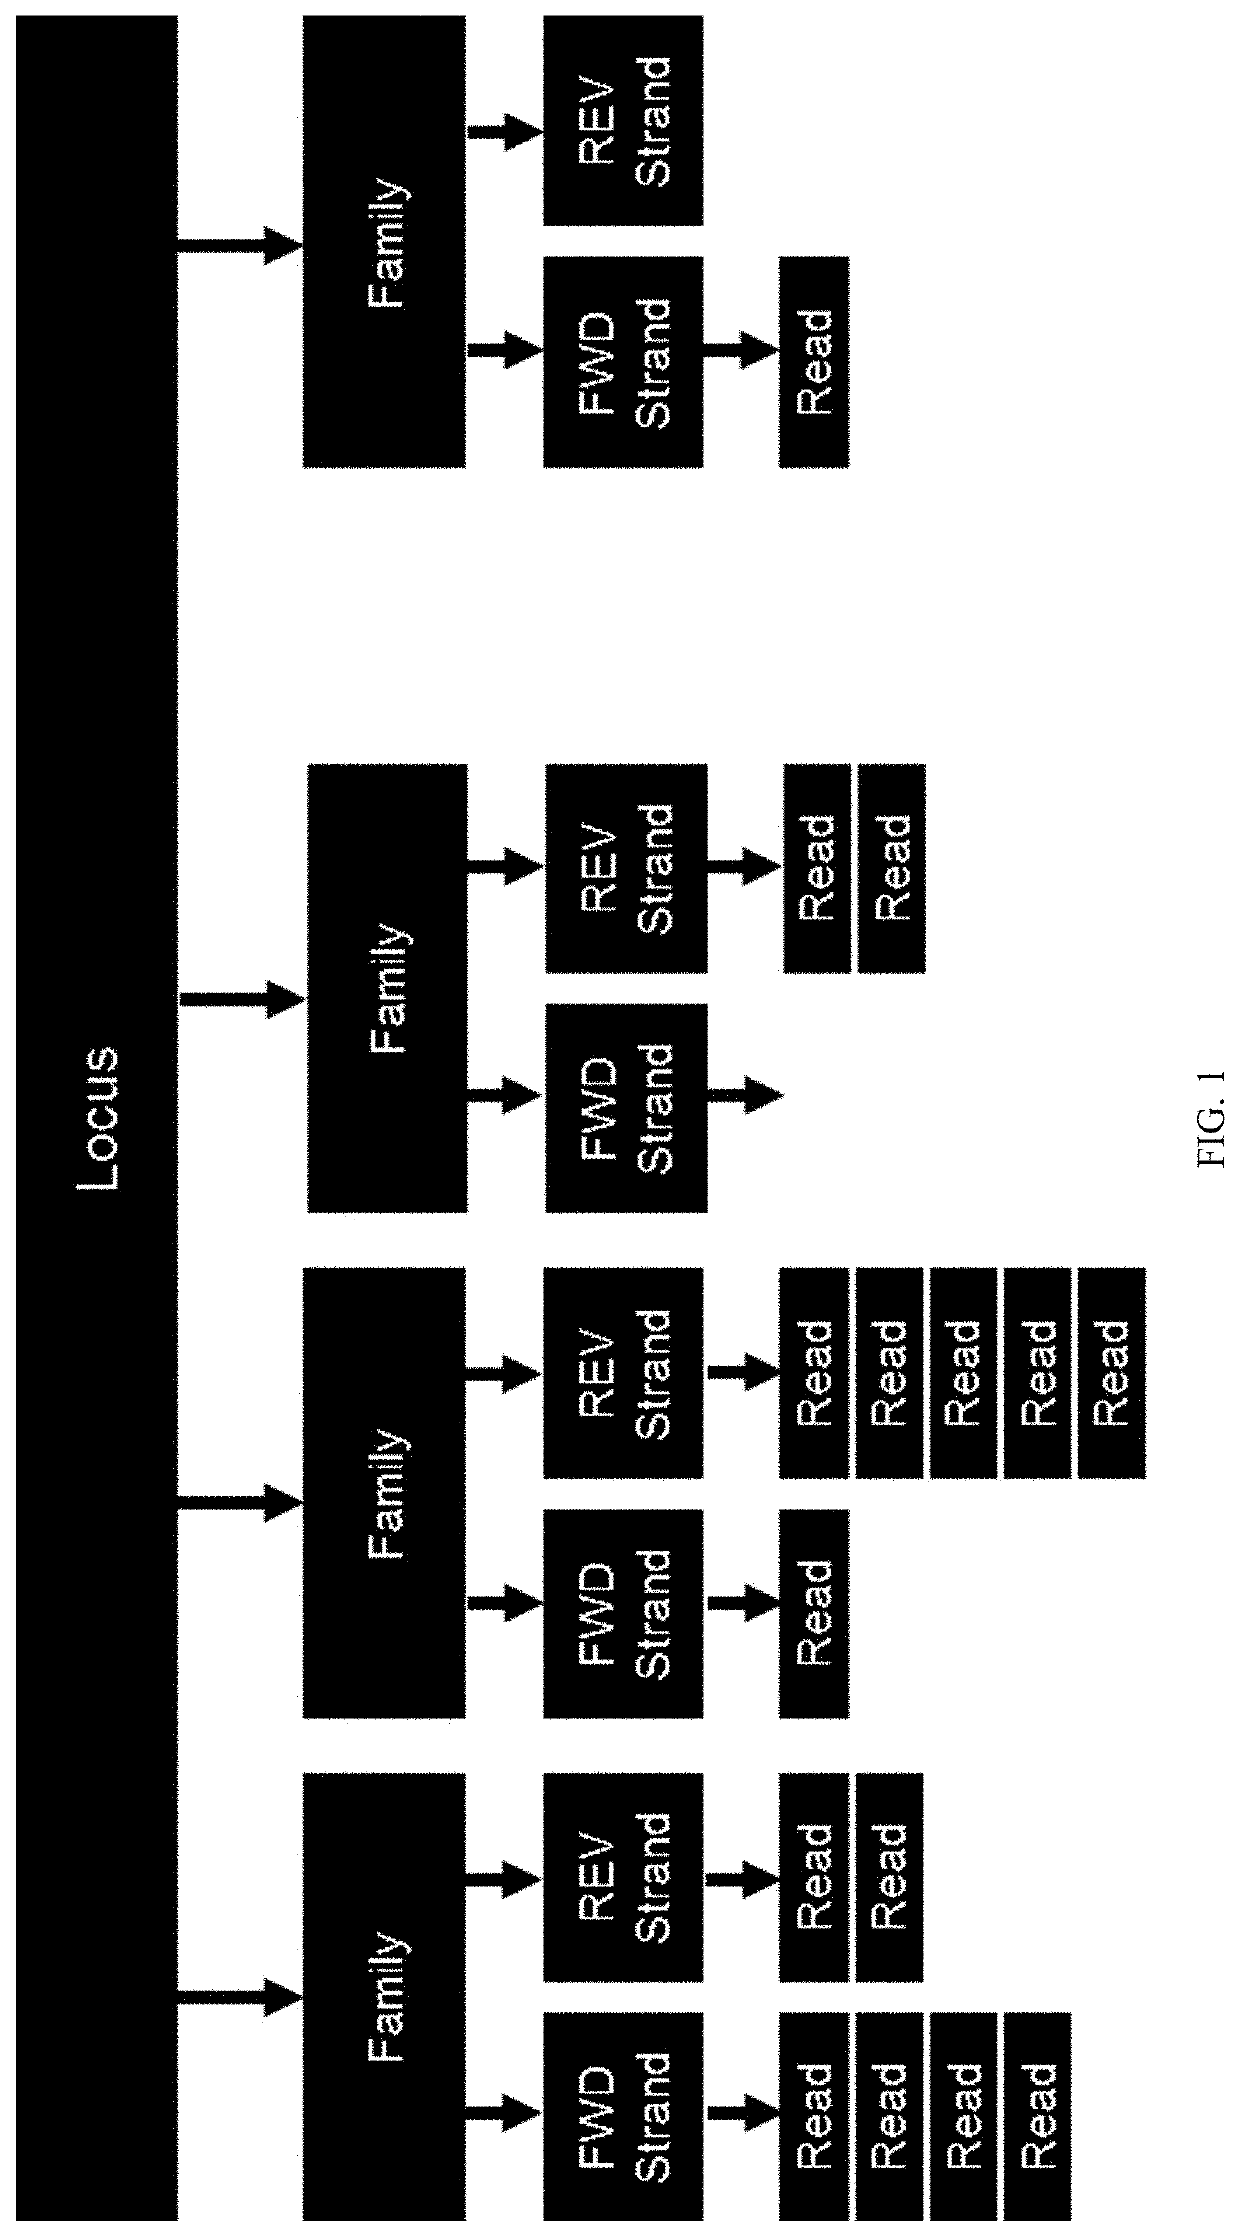
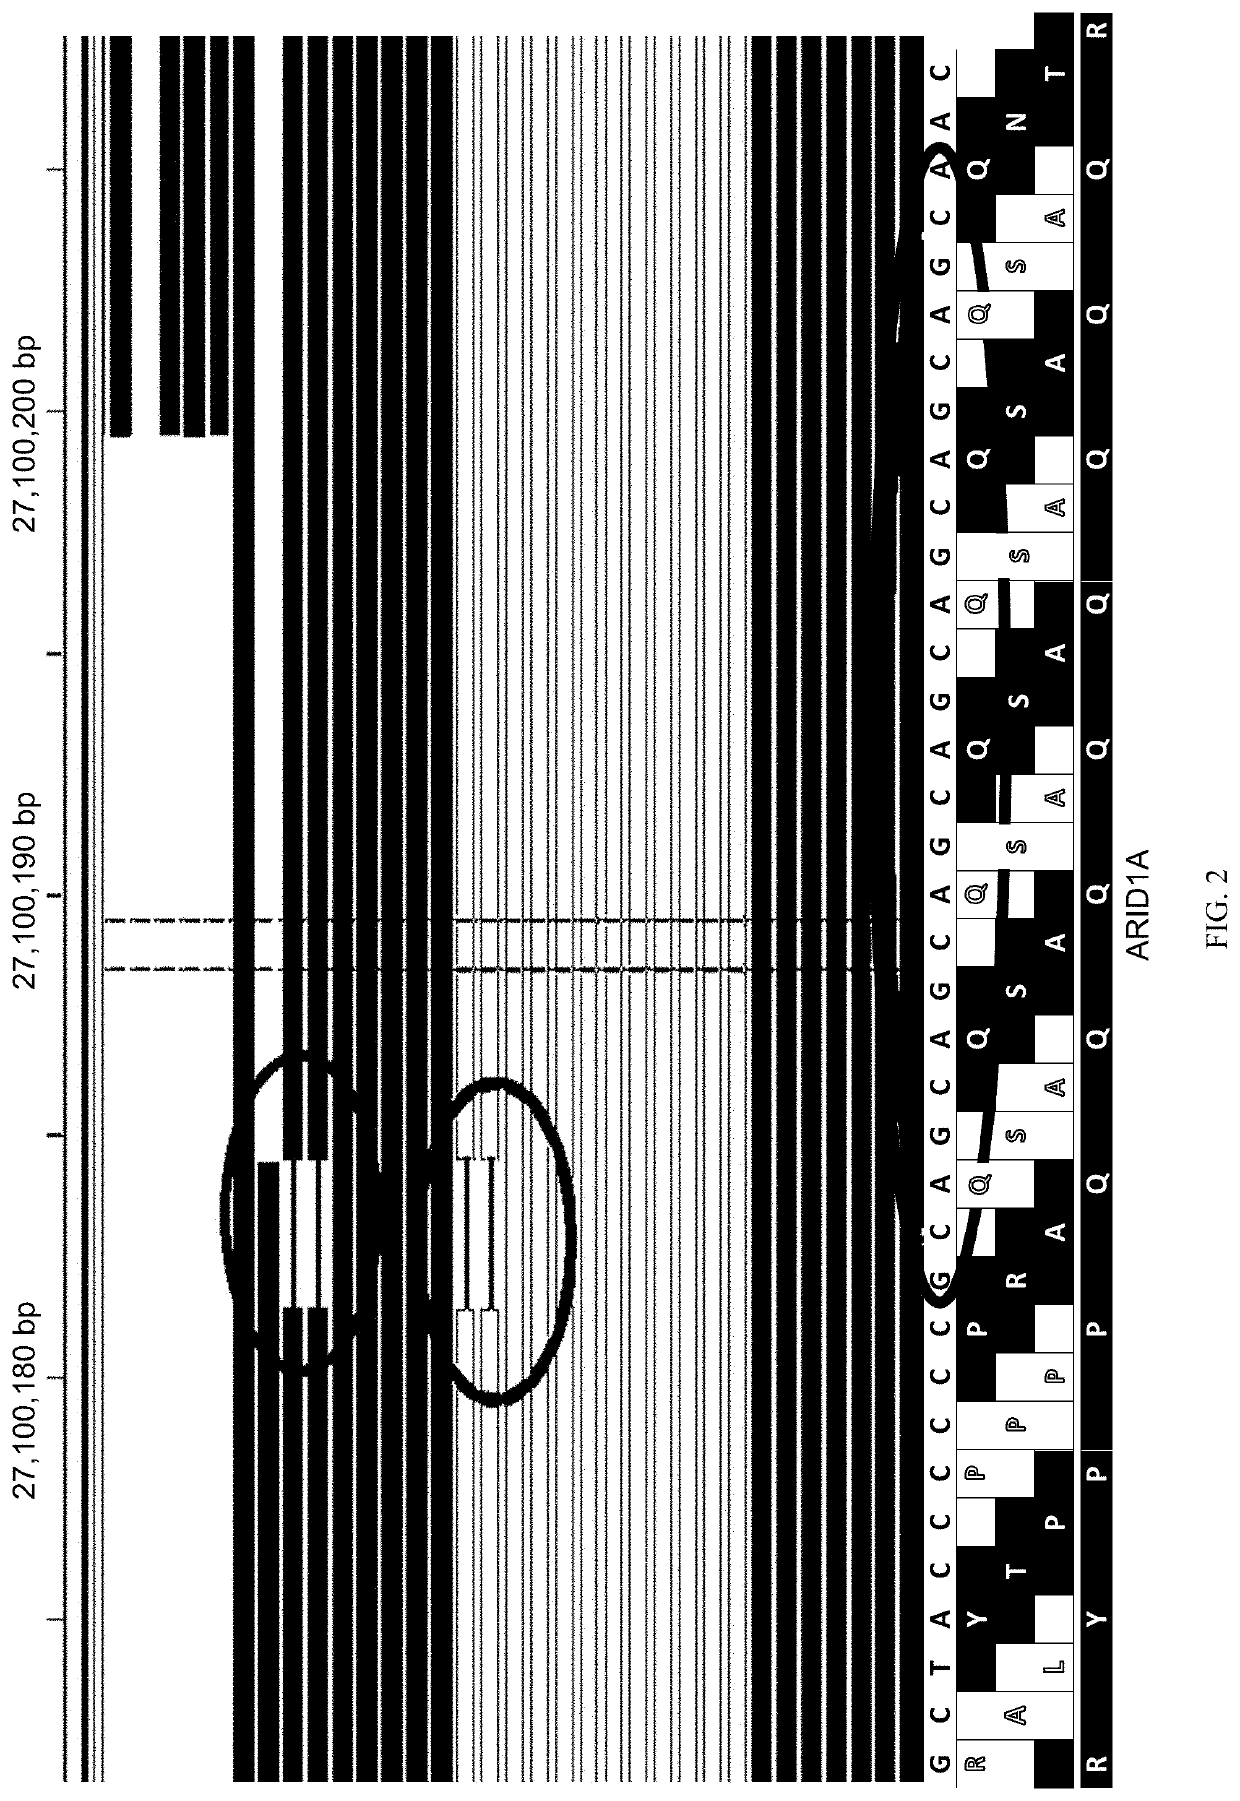
In contrast, introduced indels may be expected to be detected or measured as larger families of reads, which may indicate an introduced error during PCR or sequencing.
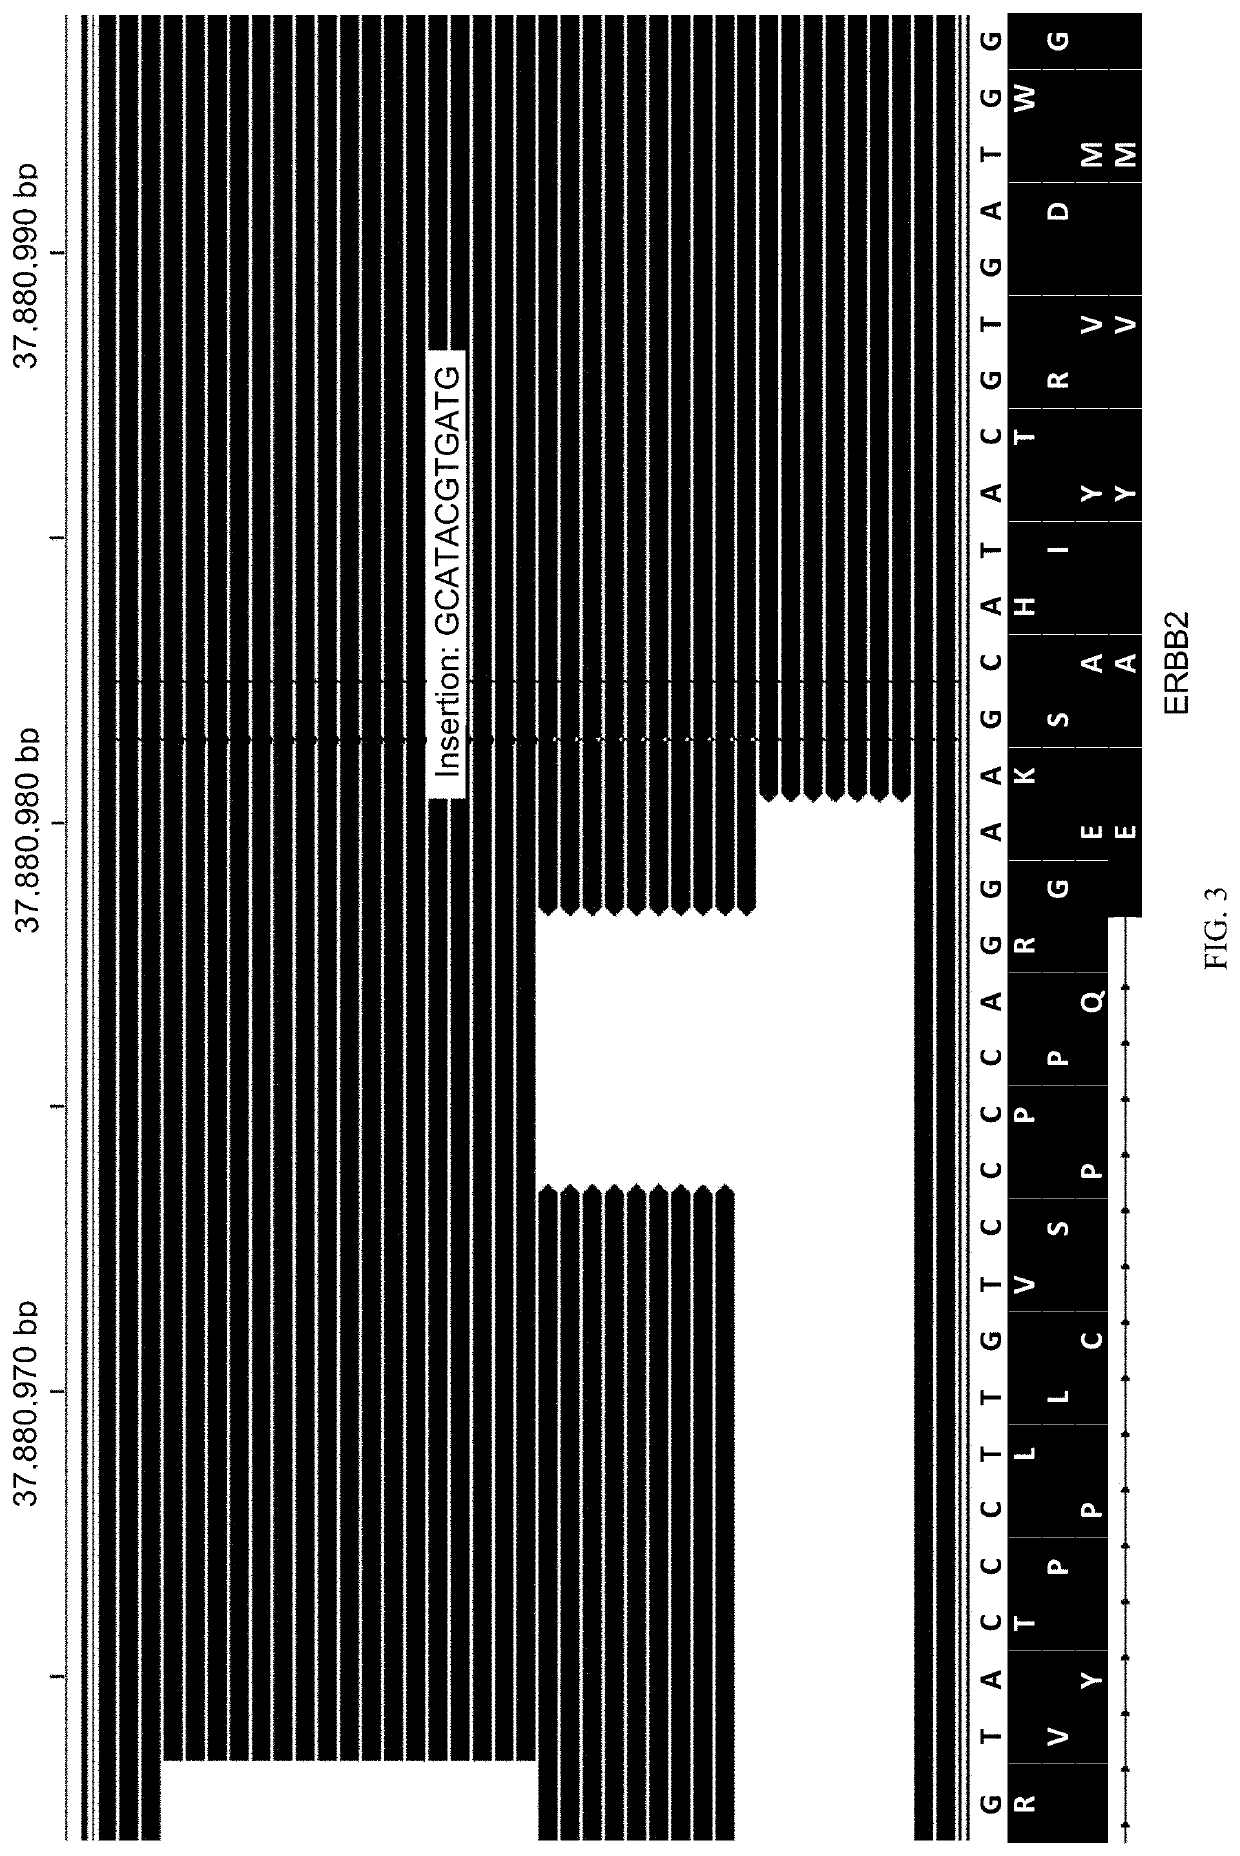
Some untrimmed or erroneous reads may cause the algorithm to disqualify the family based on a hypothesis test that classifies an indel (e.g., insertion or deletion) as introduced rather than biological.
As in the above case in FIG. 3, some untrimmed or erroneous reads may cause the algorithm to disqualify the family based on a hypothesis test that classifies an indel (e.g., insertion or deletion) as introduced rather than biological.

Method used


Image

  • Methods for multi-resolution analysis of cell-free nucleic acids
  • Methods for multi-resolution analysis of cell-free nucleic acids
  • Methods for multi-resolution analysis of cell-free nucleic acids

Examples


example 1

l Performance Assessment

[0180]Analytical sensitivity (as defined by the limit of detection and by positive percent agreement) and precision were assessed throughout the reportable allelic fraction and copy number ranges via multiple serial dilution studies of orthogonally-characterized contrived material and patient samples. Analytical specificity was assessed by calculating the false positive rate in pre-characterized healthy donor sample mixtures serially diluted across the lower reportable range down to allelic fractions below the limit of detection. Positive predictive value (PPV) was estimated as a function of allelic fraction / copy number from pre-characterized clinical patient samples and prevalence-adjusted using a cohort of 2,585 consecutive clinical samples. Orthogonal qualitative and quantitative confirmation was performed using ddPCR.

[0181]Analytical performance is summarized in Table 7 below. Analytical specificity was 100% for single nucleotide variants (SNVs), fusions,...

example 2

nd Backbone Titration

[0185]In this experiment, the appropriate probe replication and the saturation point for each panel were determined. Hotspot and backbone panels were designed for both default probe replication and optimized probe replication. The hotspot panel is approximately 12 kb and targets regions of genomic targets that may be indicative of drug response, a disease status (e.g., cancer), and / or a genomic target listed under National Comprehensive Cancer Network (“NCCN”) guidelines. The backbone panel is approximately 140 kb and covers the rest of the panel content. The hotspot and backbone panel may comprise any genetic locations in Table 3. A titration experiment was performed for panel input amount for each of the four panels at 5 ng, 15 ng, and 30 ng of cfDNA as set forth in Table 1. FIG. 6 shows input amount versus unique molecule count for the generic panel. The unique molecule count saturated at about Vol. 3× for the backbone bait and about Vol. 1.2× for the hotspot...

example 3

Capturing of a Hotspot Region

[0186]Based on the saturation point of each panel in Example 2, a concentration of backbone bait and a concentration of hotspot bait were determined. A mixture of backbone bait (e.g., Vol. A) and hotspot bait (e.g., Vol. B) was generated and the molecule count for the hotspot / backbone bait mixture was compared with molecule count for a generic panel. The molecule counts from the hotspot panel were higher than the backbone panel. The difference became more noticeable at higher cfDNA input amount as the backbone bait saturated out much faster, e.g., at lower input amount, as compared to the hotspot bait. A similar trend was seen with the double-stranded count (data not shown). Family size was also higher for the hotspot panel than the backbone panel (data not shown). The difference in family sizes may indicate that the hotspot panel is capturing more than the backbone panel, despite that the effect was masked with molecule counts. For example, with the lar...


PUM

PropertyMeasurementUnit
concentrationaaaaaaaaaa
nucleic acid sequenceaaaaaaaaaa
concentrationsaaaaaaaaaa

Abstract

The present disclosure provides a method for enriching for multiple genomic regions using a first bait set that selectively hybridizes to a first set of genomic regions of a nucleic acid sample and a second bait set that selectively hybridizes to a second set of genomic regions of the nucleic acid sample. These bait set panels can selectively enrich for one or more nucleosome-associated regions of a genome, said nucleosome-associated regions comprising genomic regions having one or more genomic base positions with differential nucleosomal occupancy, wherein the differential nucleosomal occupancy is characteristic of a cell or tissue type of origin or disease state.

Description

CROSS-REFERENCE[0001]This application is a continuation of U.S. patent application Ser. No. 16 / 338,445, filed Mar. 29, 2019, which is a U.S. national-stage application of International Application No. PCT / US2017 / 054607, filed Sep. 29, 2017, which claims priority to U.S. Provisional Application No. 62 / 402,940, filed Sep. 30, 2016, U.S. Provisional Application No. 62 / 468,201, filed Mar. 7, 2017, and U.S. Provisional Application No. 62 / 489,391, filed Apr. 24, 2017, each of which is entirely incorporated herein by reference.SEQUENCE LISTING[0002]The instant application contains a Sequence listing which has been submitted electronically in ASCII format and is hereby incorporated by reference in its entirety. Said ASCII copy, created Sep. 27, 2017, is named 42534-733_601_SL.txt and is 2,938 bytes in size.BACKGROUND[0003]Analysis of cell-free nucleic acids (e.g., deoxyribonucleic acid or ribonucleic acid) for tumor-derived genetic variants is a critical step in a typical analysis pipeline ...

Claims


Application Information

Patent Timeline
Patent Type & Authority Patents(United States)
IPC IPC(8): C12Q1/68G16B30/00G16B5/00G16B40/30C12Q1/6806G16B25/10
CPCG16B30/00C12Q1/6806G16B5/00G16B40/30C12Q2535/122C12Q2537/159C12Q1/6827C12Q1/6886G16B20/50C12Q2600/154C12Q2600/156G16B20/20G16B25/10
Inventor CHUDOVA, DARYAELTOUKHY, HELMYMORTIMER, STEFANIE ANN WARDABDUEVA, DIANA
Owner GUARDANT HEALTH
Learn More