
Low leakage technique for determining power spectra of non-coherently sampled data

A technology for sampling signals and frequencies, applied in the field of electronic device testing equipment, can solve problems such as high price

Inactive Publication Date: 2003-12-31
TERADYNE
View PDF0 Cites 3 Cited by
  • Summary
  • Abstract
  • Description
  • Claims
  • Application Information

AI Technical Summary

Problems solved by technology

The technique is extremely effective but requires expensive hardware
This solution is especially expensive when the tester includes a large number of sample clocks, which is often the case

Method used


Image

  • Low leakage technique for determining power spectra of non-coherently sampled data
  • Low leakage technique for determining power spectra of non-coherently sampled data
  • Low leakage technique for determining power spectra of non-coherently sampled data

Examples


Embodiment

[0055] 4A-4C show simulation predictions of the performance of the best fit technique according to the present invention versus other techniques for reducing leakage. A list of the test codes used to generate the data for these graphs is provided at the end of the specification. Each of the three graphs in Figures 4A-4C compares single-tone power spectra obtained under four different conditions:

[0056] 1. Perform a Fast Fourier Transform (FFT) on the uncorrected data (i.e., obtained using a rectangular window, labeled "uncorrected"),

[0057] 2. FFT the data shaped by the Hanning window ("windowed"),

[0058] 3. FFT the resampled data ("resampled"), and

[0059] 4. Best fit technique ("least squares") as described herein.

[0060] The horizontal axis of each graph represents frequency, specifically, frequency bins (Bin) 0 to 63. For direct comparison with methods using FFT, the best fit technique was run using N=64, where each of the N frequencies corresponds to an FFT p...


PUM


Abstract

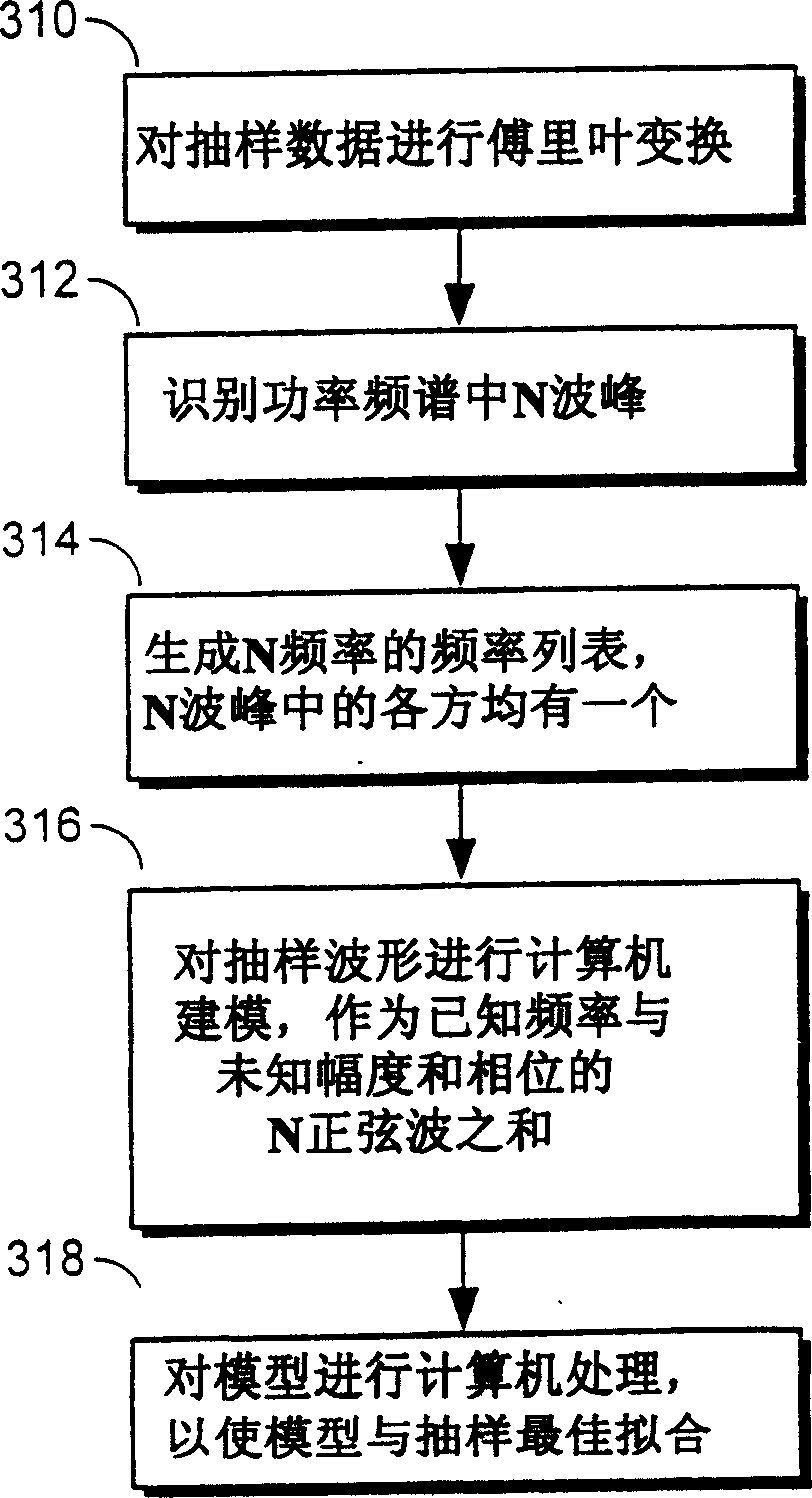
The present invention provides a technique for determining the amplitudes of frequency components of a waveform sampled from an automatic test system, which includes assembling a list of N frequencies expected to be found in the sampled waveform. A test program running on the tester generally supplies the list of frequencies. The technique assumes that the sampled waveform conforms to an idealized waveform model that mathematically corresponds to a sum of N sinusoids. Each of the N sinusoids that make up the model has unknown amplitude and a frequency that equals one of the N frequencies in the list of frequencies. The technique attempts to solve for the unknown amplitude of each of the N frequencies by mathematically minimizing, via a linear least-squares algorithm, the difference between the model and the actual, sampled waveform.

Description

field of invention [0001] The present invention relates to electronic device testing equipment and methods, and more particularly to techniques for extracting the amplitude of frequency components of test signals from electronic test signals. background of the invention [0002] Test procedures for automated test systems typically require the tester to measure the power spectrum of a signal sampled from a device under test (DUT). In a conventional test scenario, an automated test system generates a stimulus to execute on the DUT's input and samples the DUT's output as the DUT responds to the stimulus. The tester software computes the power spectrum of the sampled output signal by performing a discrete Fourier transform (DFT) on the obtained samples. [0003] It is well known that whenever the sampling clock is not "coherent" with the sampled signal, errors known as "leakage" will show up in the power spectrum generated by the DFT. A sampling clock is "coherent" if its freq...

Claims


Application Information

Patent Timeline
IPC IPC(8): G01R23/16G01R31/319
CPCG01R23/16
Inventor 格雷戈里E·迪翁
Owner TERADYNE
Learn More