Monitoring tool and method for ironic service in openstack environment

An environment and tool technology, applied in the field of monitoring tools for ironic services, can solve problems such as monitoring and no ironic services

Active Publication Date: 2020-07-17
山东汇贸电子口岸有限公司
View PDF15 Cites 1 Cited by
  • Summary
  • Abstract
  • Description
  • Claims
  • Application Information

AI Technical Summary

Problems solved by technology

[0006] The ironic component of openstack is used for bare metal management. Although openstack has some monitoring methods for the bare metal managed by ironic, it requires specific hardware support, and there is no monitoring of the ironic service itself. If there is a problem with the ironic service itself, it is difficult to find out in time

Method used


Image

  • Monitoring tool and method for ironic service in openstack environment
  • Monitoring tool and method for ironic service in openstack environment

Examples


Embodiment 1

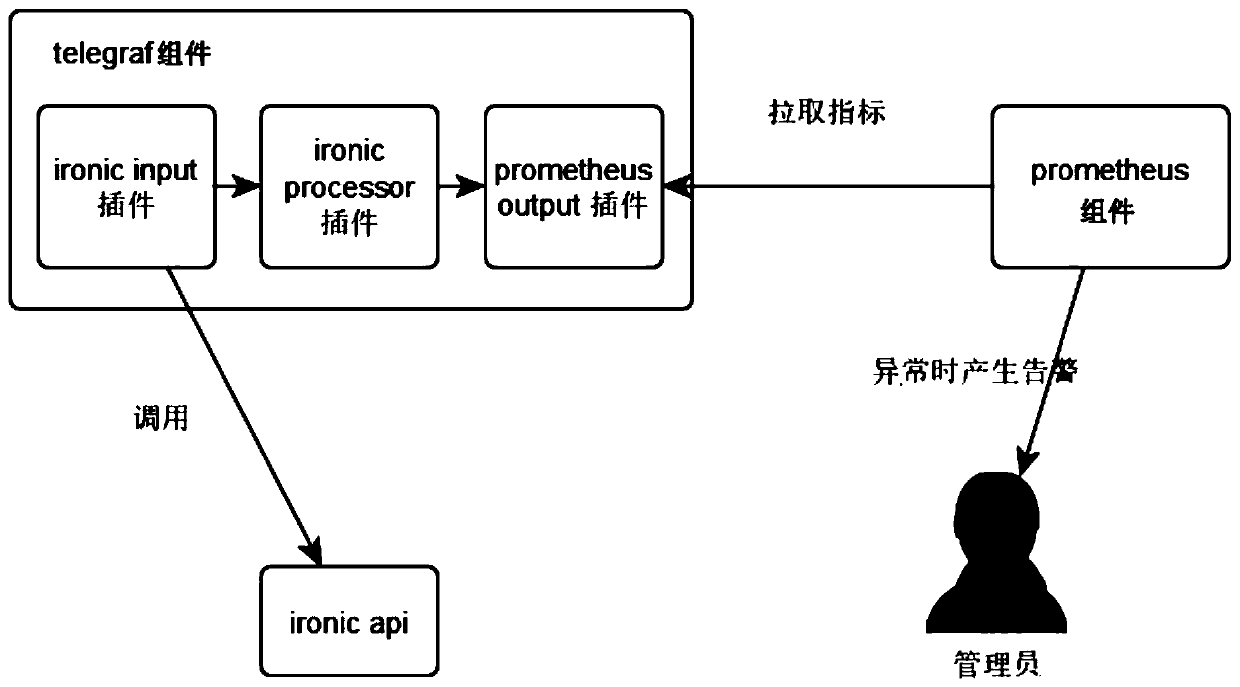
[0043] combined with figure 1 , this embodiment proposes a monitoring tool for ironic services in an openstack environment. The monitoring tool is based on telegraf components and prometheus components, and also includes adding ironic input plug-ins, ironic processor plug-ins, and prometheus output plug-ins to the telegraf components.

[0044] The ironic input plug-in is used to periodically call the ironic api, confirm the availability of the ironic service and obtain baremetal node information.

[0045] The ironic processor plugin is used to process the information collected by the ironic input plugin and generate corresponding indicators.

[0046] The prometheus output plugin is used to receive metrics generated by the ironic processor plugin.

[0047] The prometheus component is used to pull and analyze indicators from the prometheus output plug-in, and generate an alarm when an exception occurs.

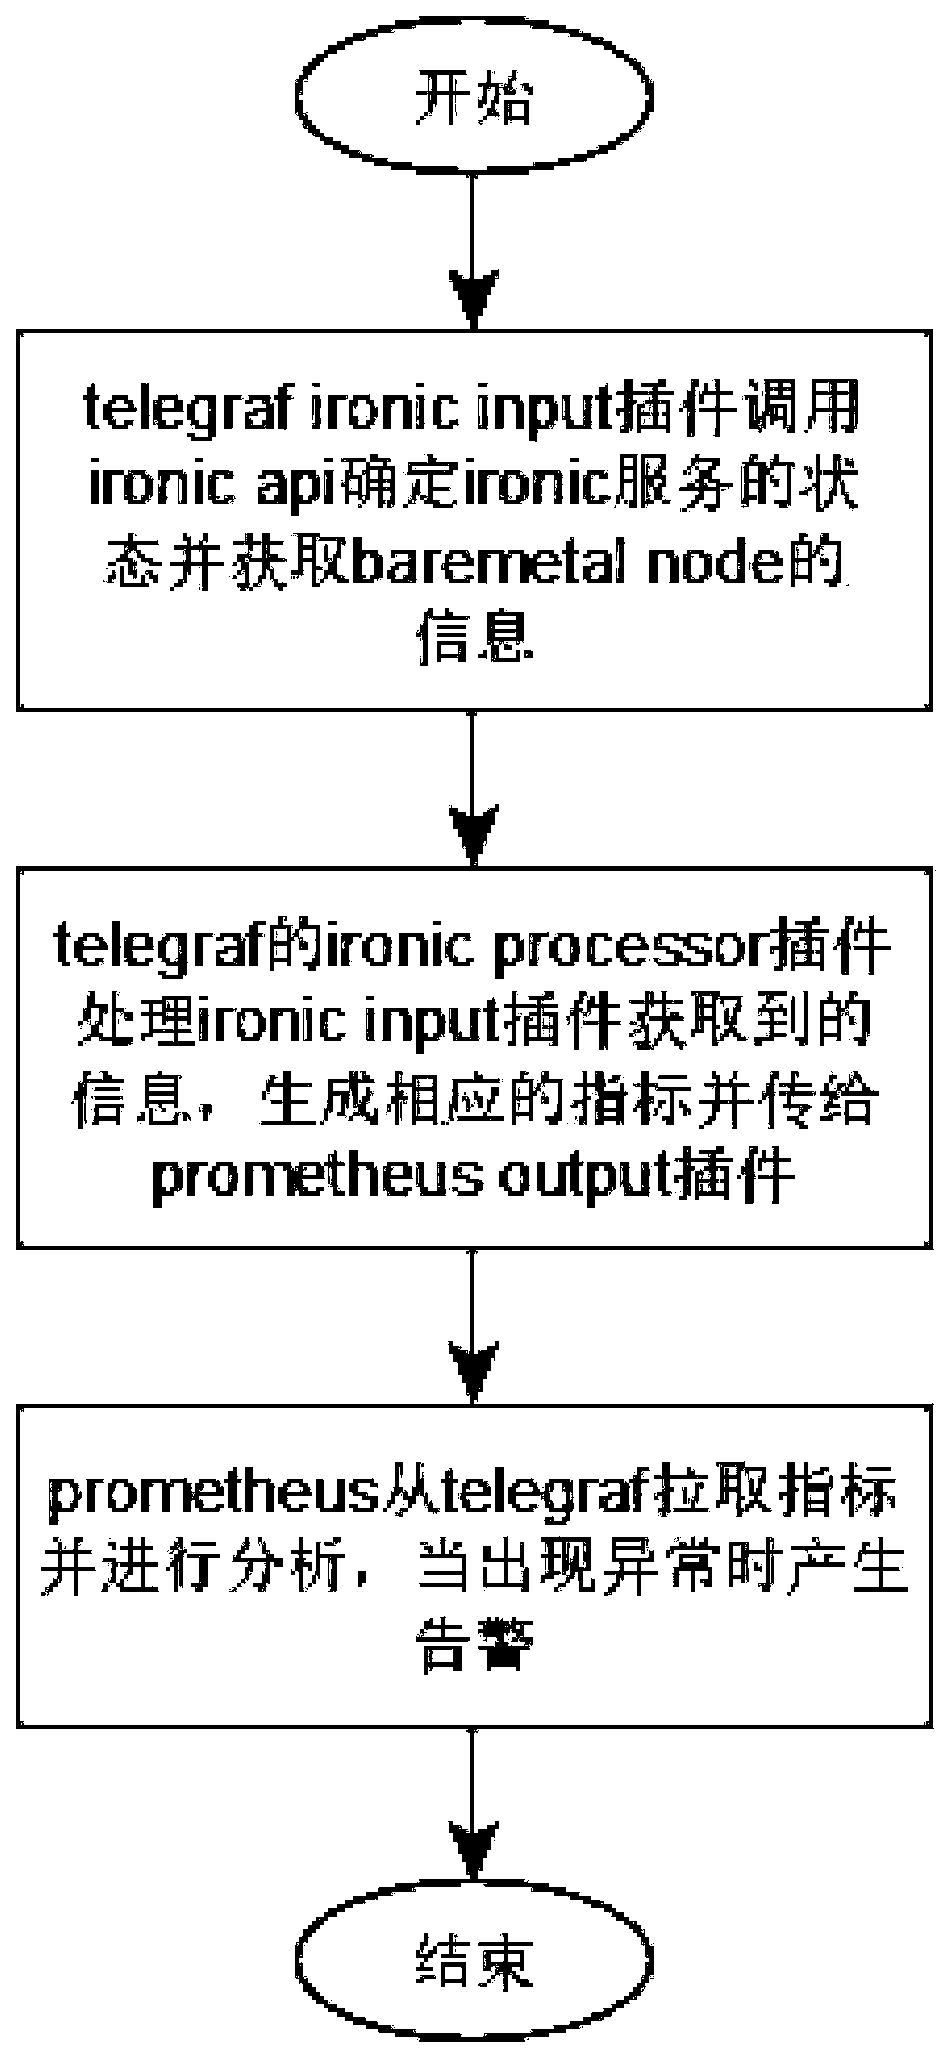
[0048] combined with figure 2, a monitoring tool for ironic services in...


PUM


Abstract

The invention discloses a monitoring tool and method for an ironic service in an openstack environment, and relates to the technical field of openstacks. The monitoring tool is based on a telegraf assembly and a promelteus assembly, and further comprises an ironic input plug-in, an ironic processor plug-in and a promelteus output plug-in which are added in the telegraf assembly. The implementationprocess of the monitoring method based on the tool comprises the following steps of: periodically calling an ironic api through an ironic input plug-in added to a telegram component, so as to confirmthe availability of an ironic service and acquire the information of a basic node; processing information collected by an ironic input plug-in and generating a corresponding index through the ironicinput plug-in which is added to a telgraf component; outputting an index generated by an ironic probe sensor plug-in of a telegram component to a probe output plug-in according to the index of the telegram component; and the promelteus component pulls the index from the promelteus output plug-in of the telegram component and analyzes the index, and sends an alarm when an exception occurs. According to the invention, the state of the ironic service can be conveniently monitored, an alarm can be timely generated when an abnormality occurs, and the abnormality can be timely discovered and handledin a production environment, so that a major accident is avoided.

Description

technical field [0001] The invention relates to the technical field of openstack, in particular to a monitoring tool and method for ironic services in an openstack environment. Background technique [0002] openstack: An open source cloud computing management platform project that can control a large number of computing, storage, and network resources. Physical bare metal can be managed through ironic components. [0003] ironic: The component that manages physical machines in openstack. Ironic uses a structure called baremetal node to define the physical bare metal, which contains various attributes of the physical bare metal and corresponds to the database one by one. Openstack uses ironic to manage physical machines like virtual machines. [0004] telegraf: A plugin-driven server agent for collecting and sending metrics from databases, systems, and sensors. Written in go language. Telegraf provides various plug-ins to collect and send various data, and there are four...

Claims


Application Information

Patent Timeline
Patent Type & Authority Applications(China)
IPC IPC(8): G06F11/30G06F11/32G06F11/34
CPCG06F11/3055G06F11/3051G06F11/3093G06F11/327G06F11/3476Y02D10/00
Inventor 唐航蔡卫卫谢涛涛
Owner 山东汇贸电子口岸有限公司
Why Eureka
Try Eureka