A Method for Predicting Change Points of Seismic Data Sets

A technology of seismic data and prediction methods, which is applied in the directions of surveying, earthwork drilling, data processing applications, etc., can solve problems such as waste, affecting production timeliness, and inoperability, so as to improve accuracy and efficiency, improve recognition accuracy, and identify The effect of improving the efficiency of

Active Publication Date: 2022-05-06
CHINA NAT PETROLEUM CORP CHUANQING DRILLING ENG CO LTD +1
View PDF12 Cites 0 Cited by
  • Summary
  • Abstract
  • Description
  • Claims
  • Application Information

AI Technical Summary

Problems solved by technology

[0002] During the casing operation of shale gas horizontal wells in the Sichuan Basin, casing changes frequently occur, that is, casings that are lowered into the well are deformed and damaged and cannot be operated, which affects the production timeliness in the slightest, and causes downhole operations to be scrapped in severe cases, seriously affecting the shale gas production capacity. Exploration and development project progress and development effect, resulting in huge losses and waste
At the same time, since the recognition of micro-structures in the above-mentioned prior art is only obtained by calculating the curvature, or only by improving the seismic resolution to identify micro-structures
In the actual application process, even if the above existing technology is used to predict the change point of the horizontal well casing, the identification effect of the micro structure is relatively simple, so the identification effect is not ideal, which leads to the prediction accuracy and efficiency of the change point of the casing. not ideal

Method used


Image

  • A Method for Predicting Change Points of Seismic Data Sets
  • A Method for Predicting Change Points of Seismic Data Sets
  • A Method for Predicting Change Points of Seismic Data Sets

Examples


Embodiment 1

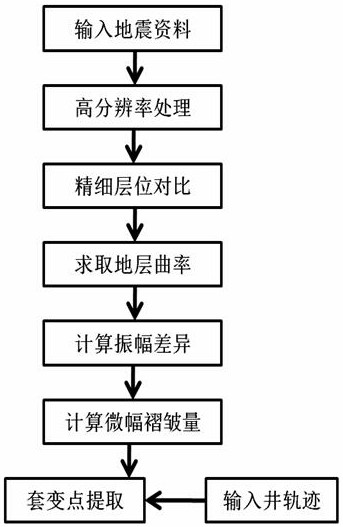
[0032] As the best implementation mode of the present invention, it discloses a lost circulation prediction method based on seismic data, the steps of which are as follows:

[0033] a. High resolution processing: processing conventional lower resolution seismic data into high resolution data;

[0034] b. Fine horizon correlation: Accurately pick up seismic horizons according to the usual seismic horizon correlation technology;

[0035] c. Automatic identification of folds: calculate the curvature of the formation along the seismic horizon, find folds, and judge the positive or negative of the curvature at the same time;

[0036] d. Judging the nature of folds: judging whether it is an anticline or a syncline according to the positive and negative changes of the curvature;

[0037] e. Extract the amplitude difference: calculate the amplitude difference in each direction within the scope of the target layer with the center of the slight fold;

[0038] f. Calculation of slight ...

Embodiment 2

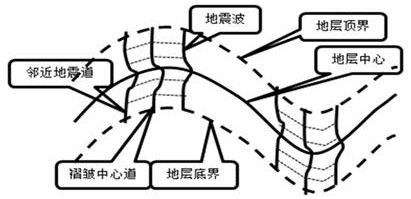
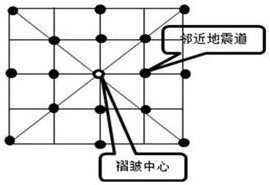
[0045] Specific application examples: Refer to 2 and 3 to clarify the principle of the specific calculation method.

[0046] figure 2 Contains an anticline and a syncline, just take the anticline as an example. The stratum center is determined, and the stratum thickness (time window length when the seismic section is in the time domain) is the range between the top and bottom boundaries of the stratum. According to the horizon data picked up by the formation center, the curvature can be calculated, folds can be found, and the positive and negative of the curvature (dorsal and syncline properties) can be obtained to determine the core of the fold and the seismic trace where the fold center is located—the central trace, and then from the upper Calculate the amplitude difference on both sides of the center track point by point. In actual calculation, also according to image 3 Calculate the amplitude difference between multiple tracks in all directions of the center track, an...


PUM


Abstract

The invention discloses a seismic data set change point prediction method, which relates to the technical field of seismic data application in the exploration and development of oil and gas fields, a. high-resolution processing; b. fine horizon comparison; c. automatic fold recognition: calculating along the seismic horizon Take the formation curvature, find folds, and judge the positive or negative of the curvature at the same time; d. Judgment of the nature of the folds: judge whether it is an anticline or a syncline according to the positive and negative changes of the curvature; Amplitude difference; f. Calculation of micro-amplitude folds: comprehensively calculate micro-amplitude folds according to the three parameters of curvature sign, curvature, and amplitude difference; g. Prediction of casing change points: according to well trajectory coordinates, from micro-amplitude folds The position of the possible casing change point and its slight fold degree are picked from the quantitative data, and the slight fold amount is extracted along the trajectory of the horizontal well to obtain the prediction result of the casing change point. The accuracy and efficiency of the method for predicting casing change points of horizontal wells based on slight folds are significantly improved.

Description

technical field [0001] The invention relates to the technical field of application of seismic data in the exploration and development of oil and gas fields, in particular to a method for predicting change points of seismic data sets. Background technique [0002] During the casing operation of shale gas horizontal wells in the Sichuan Basin, casing changes frequently occur, that is, casings that are lowered into the well are deformed and damaged and cannot be operated, which affects the production timeliness in the slightest, and causes downhole operations to be scrapped in severe cases, seriously affecting the shale gas production capacity. The progress and development effect of exploration and development projects have caused huge losses and waste. Casing change may be caused by one or more of the following factors: sudden change in geological conditions, instability of borehole wall, casing material not meeting formation change conditions, unsuitable technological measure...

Claims


Application Information

Patent Timeline
Patent Type & Authority Patents(China)
IPC IPC(8): E21B47/00E21B47/10G06Q50/02
CPCE21B47/00E21B47/10G06Q50/02
Inventor 吴大奎吴宗蔚欧阳明华胡天文
Owner CHINA NAT PETROLEUM CORP CHUANQING DRILLING ENG CO LTD
Why Eureka
Try Eureka