Energy dispersion X-ray spectrum-based analysis method for phases of fly ash
A technology of X-ray spectroscopy and energy dispersion, which is used in the field of environmental protection (solid waste utilization) and material analysis and testing. Effects with sufficient resolution and particle count
- Summary
- Abstract
- Description
- Claims
- Application Information
AI Technical Summary
Problems solved by technology
Method used
Image
Examples
Embodiment 1
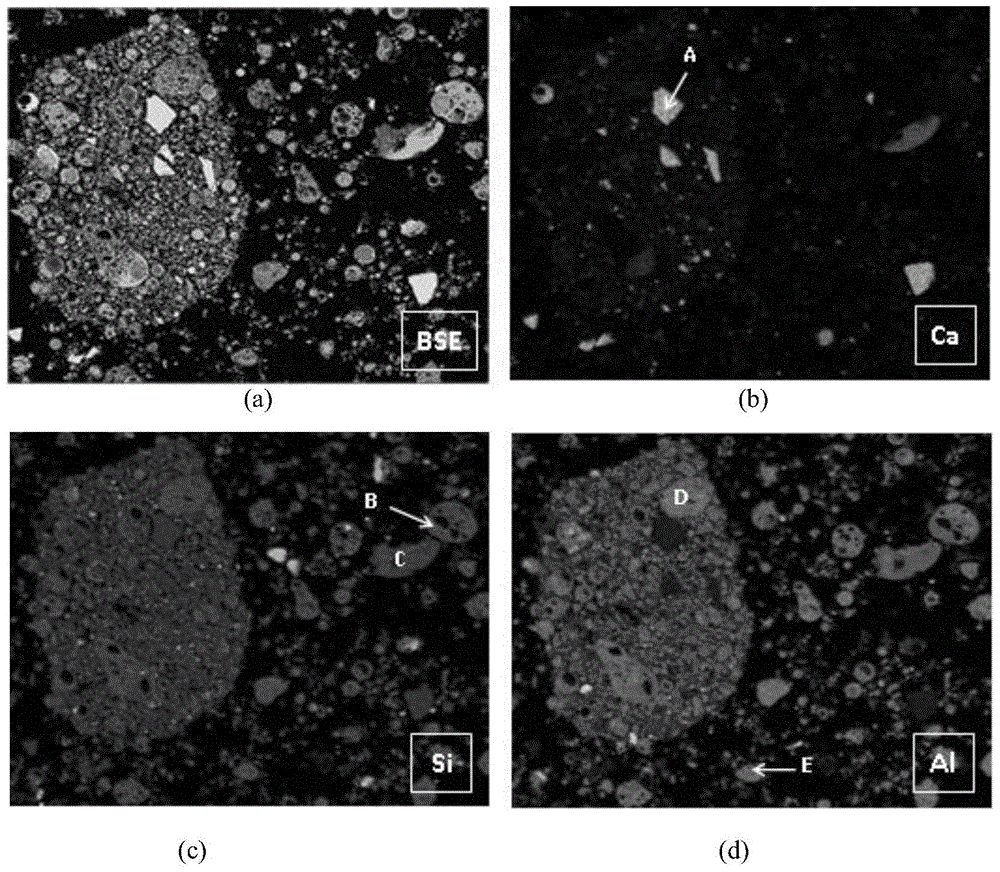
[0031] Embodiment 1. Analysis of the phase type and spatial distribution of a kind of low-calcium fly ash. Follow the steps below to analyze:
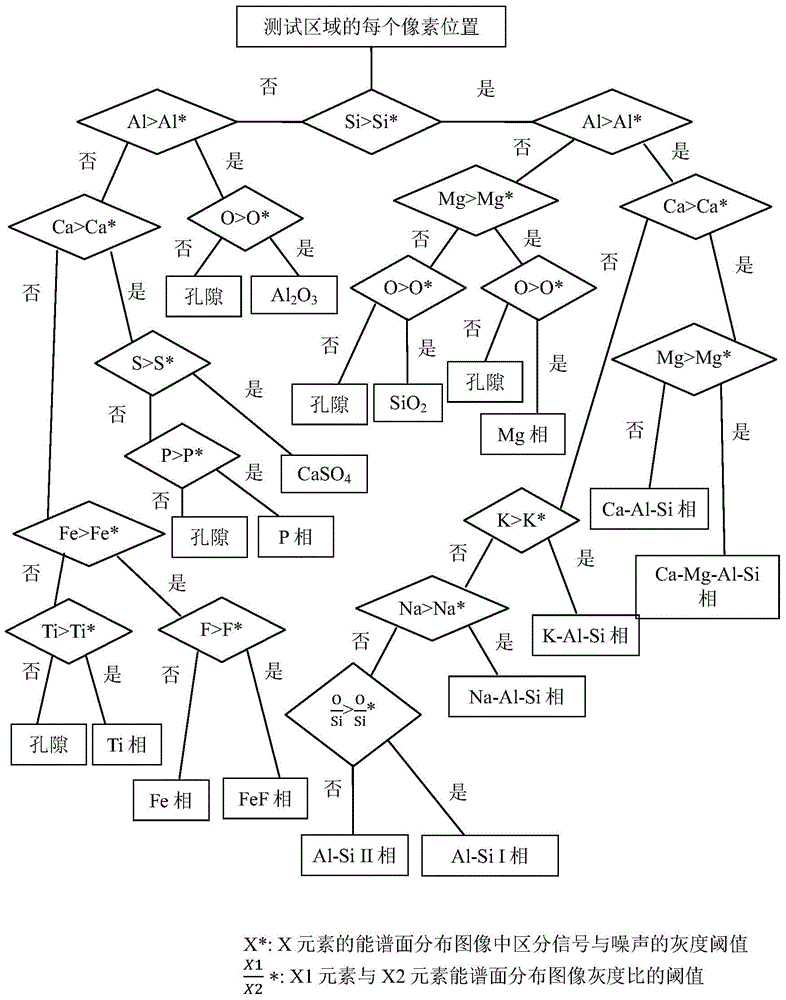
[0032] (1) Using X-ray fluorescence spectroscopy to analyze the chemical composition of low-calcium fly ash. The test results show that the chemical composition of fly ash is: SiO 2 45.90%, Al 2 o 3 37.30%, CaO5.33%, Fe 2 o 3 2.84%, SO 3 1.74%, MgO1.33%, K 2 O0.61%, Na 2 O0.35%, TiO 2 1.36%. According to the above test results, it is preliminarily determined that the elements that need to collect energy spectrum distribution images for this kind of fly ash are: Si, Al, Ca, Fe, S, Mg, K, Na, Ti, O.
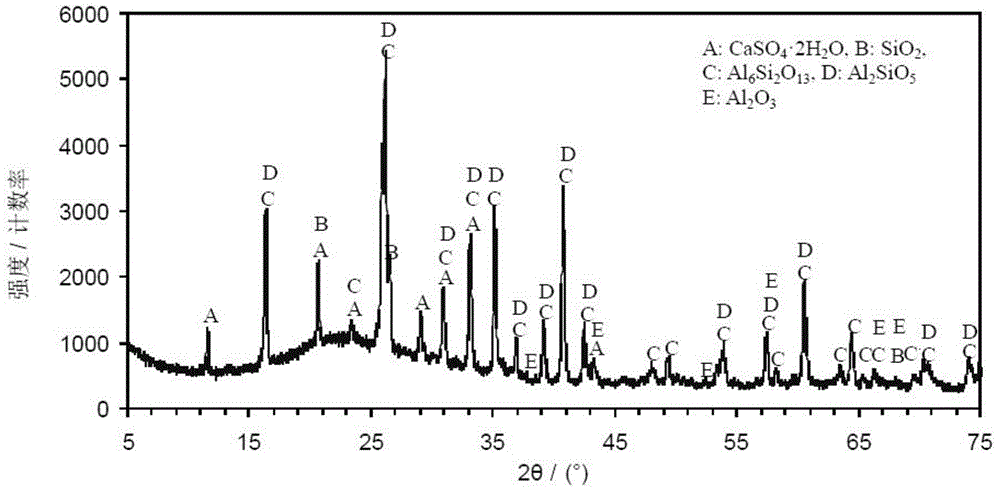
[0033] (2) Analyze the mineral composition of low-calcium fly ash by X-ray diffraction, the results are as follows figure 2 shown. The test results show that the crystalline phase in fly ash is mainly mullite (Al 6 Si 2 o 13 ), sillimanite (Al 2 SiO 5 ) CaSO 4 2H 2 O, SiO 2 and Al 2 o 3 . The mantou peak located in t...
Embodiment 2
[0039] Embodiment 2. Analysis of the phase type and content of a low-calcium fly ash. Follow the steps below to analyze:
[0040] (1) Steps (1)-(3) are the same as in Example 1.
[0041] (2) Select a typical area in the fly ash sample, collect backscattered electron images and energy spectrum distribution images of Si, Al, Ca, Fe, S, Mg, K, Na, Ti, F, O elements, the results are as follows Figure 7 shown. It can be seen that each element has different degrees of enrichment. Among them, the white spots appearing in the energy spectrum distribution image of Si, Al, O three elements have high brightness and high enrichment degree; Ca, Mg elements are next; S, K, Fe, Na, Ti, F elements The number of white spots appearing in the spectrum image is less. Considering that the observed results of the element energy spectrum surface distribution images are very similar to the rules reflected in Example 1, therefore, only for Figure 7 Some typical phases in the fly ash test area s...
PUM
 Abstract
Description
Claims
Application Information
 - Generate Ideas
- Intellectual Property
- Life Sciences
- Materials
- Tech Scout
- Unparalleled Data Quality
- Higher Quality Content
- 60% Fewer Hallucinations
Browse by: Latest US Patents, China's latest patents, Technical Efficacy Thesaurus, Application Domain, Technology Topic, Popular Technical Reports.
© 2025 PatSnap. All rights reserved.Legal|Privacy policy|Modern Slavery Act Transparency Statement|Sitemap|About US| Contact US: help@patsnap.com


