
An Optimal Method for Drawing the Frequency Curve of Type p‑iii Distribution

A technology of frequency curve and optimization method, applied in the optimization field of drawing P-III type distribution frequency curve, can solve the problems of time-consuming and energy-consuming, numerous parameters, complicated operation, etc., to expand applicability, avoid arbitrariness, and parameter estimation. result only effect

Inactive Publication Date: 2017-11-28
WUHAN UNIV
View PDF5 Cites 0 Cited by
  • Summary
  • Abstract
  • Description
  • Claims
  • Application Information

AI Technical Summary

Problems solved by technology

Due to the differences in the experience and parallax of different engineering designers, the flood frequency curve obtained by this method is relatively arbitrary. In engineering practice, different design departments often obtain different design results, and it is difficult to formulate a unified Engineering Design Standards
Moreover, the method of manually adjusting parameters multiple times also consumes a lot of time and energy.
[0004] Liu Li et al. (Liu Li, Zhou Jianzhong, Yang Junjie, etc., the application of particle swarm optimization line-fitting method in hydrological frequency analysis. Hydrology, 2009, 29(2), 21-23.) proposed an optimal fitness method based on particle swarm optimization algorithm. line method, and apply this method to the analysis of the annual maximum flow frequency. Although this method avoids the uncertainty of human factors to a certain extent, it is estimated by the actual value of the sample data and the theoretical curve at the same frequency. The minimum sum of the absolute value of the estimated value of the deviation is the objective function, which does not take into account historical floods and catastrophic floods, and does not meet the actual requirements of Chinese engineering design
Li Hongwei et al. (Li Hongwei, Song Songbai. Application of Ant Colony Algorithm in the Calculation of Hydrological Frequency Curve Parameters. People Yellow River, 2009, 31(4), 38-40.) proposed a network-based method that can be applied to the calculation of hydrological frequency parameters. Ant colony algorithm based on grid division strategy, this method not only has many parameters, but the operation is cumbersome, and it also does not take into account historical floods and catastrophic floods

Method used


Image

  • An Optimal Method for Drawing the Frequency Curve of Type p‑iii Distribution
  • An Optimal Method for Drawing the Frequency Curve of Type p‑iii Distribution
  • An Optimal Method for Drawing the Frequency Curve of Type p‑iii Distribution

Examples


Embodiment Construction

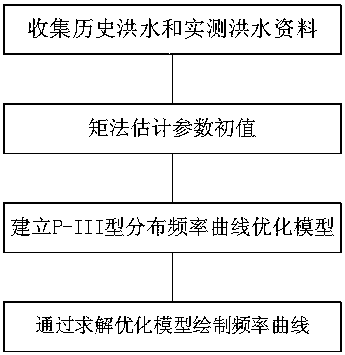
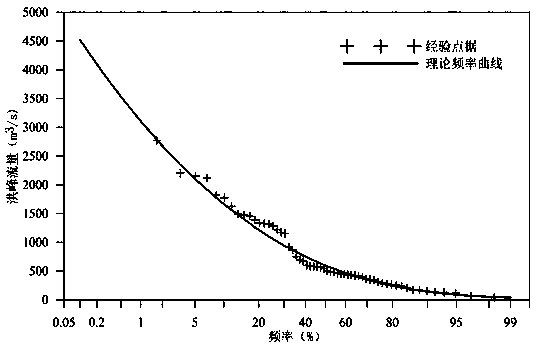
[0022] In the present invention, by establishing a P-III type distribution frequency curve optimization model, different weights are given to the relative errors of the theoretical frequency and the empirical frequency, and the minimum square sum of the relative error weights is used as the objective function, and according to the general situation of the watershed and the actual situation of the reservoir, add For the constraint conditions of the parameters, the parameters estimated by the method of moments are used as the initial values, and the improved very fast simulated annealing algorithm (MVFSA) is used to solve the model, and the optimal solution of the parameters is obtained, thereby drawing the P-III type distribution frequency curve. Combine below figure 1 The concrete steps of the present invention are illustrated:

[0023] Step 1, collect historical flood and measured flood data;

[0024] For the collected historical floods, let the maximum survey period be N, t...


PUM


Abstract

The invention discloses an optimization method for drawing a P-III type distribution frequency curve. By establishing a P-III type distribution frequency curve optimization model, theoretical frequency and experimental frequency are endowed with different weights, and the minimum square sum of a relative error weight serves as an objective function; according to the drainage basin general situation and the actual condition of a reservoir, constraint conditions of a parameter are added; and the parameter estimated through a moment method serves as an initial value, an improved very fast simulated annealing algorithm is adopted for solving the model, the optimal solution of the parameter is obtained, and therefore the P-III type distribution frequency curve is drawn. By means of the method, the parameter estimation result is unique, randomness caused by human factors is avoided, historical flood and catastrophic flood are also taken into account, the applicability of the P-III type distribution frequency curve is widened, and an important reference basis is provided for drawing the P-III type distribution frequency curve.

Description

technical field [0001] The invention relates to an optimization method of a frequency curve, in particular to an optimization method for drawing a P-III type distribution frequency curve. Background technique [0002] Flood frequency analysis is the main content of estimating the design flood of water conservancy and hydropower projects, and it is also an important basis for calculating design standards during the construction of water conservancy projects. Design flood calculation is carried out by constructing a flood frequency analysis model, which is composed of flood frequency distribution function and parameter estimation method. In the 1960s, based on the analysis results of a large number of long-term flood series and the actual experience of design work over the years, my country stipulated the P-III type distribution as the distribution function of hydrological analysis and calculation in my country, and used the method of moments to estimate the initial value of t...

Claims


Application Information

Patent Timeline
Patent Type & Authority Patents(China)
IPC IPC(8): E02B1/00
Inventor 尹家波
Owner WUHAN UNIV
Learn More