Active substance, nonaqueous electrolyte battery, and battery pack
A non-aqueous electrolyte and active material technology, applied in the direction of active material electrodes, battery electrodes, batteries, etc., can solve the problems of improved energy density of electrodes, low capacity of titanium oxide, etc., and achieve excellent cycle characteristics
- Summary
- Abstract
- Description
- Claims
- Application Information
AI Technical Summary
Problems solved by technology
Method used
Image
Examples
Embodiment 1
[0216] In Example 1, an active material was produced by the following procedure.
[0217]
[0218] First, weigh titanium dioxide (TiO 2 ) and niobium pentoxide (Nb 2 o 5 ), to have a molar ratio of 1:1. These materials were placed in a mortar, and ethanol was added thereto and mixed. Then, the mixture was placed in an alumina crucible, followed by heat treatment at 1000° C. for 12 hours in the atmosphere using an electric furnace. After natural cooling, grind and mix the resulting mixture again in a mortar. Then, the mixture was subjected to heat treatment at 1100° C. for 12 hours to obtain active material particles.
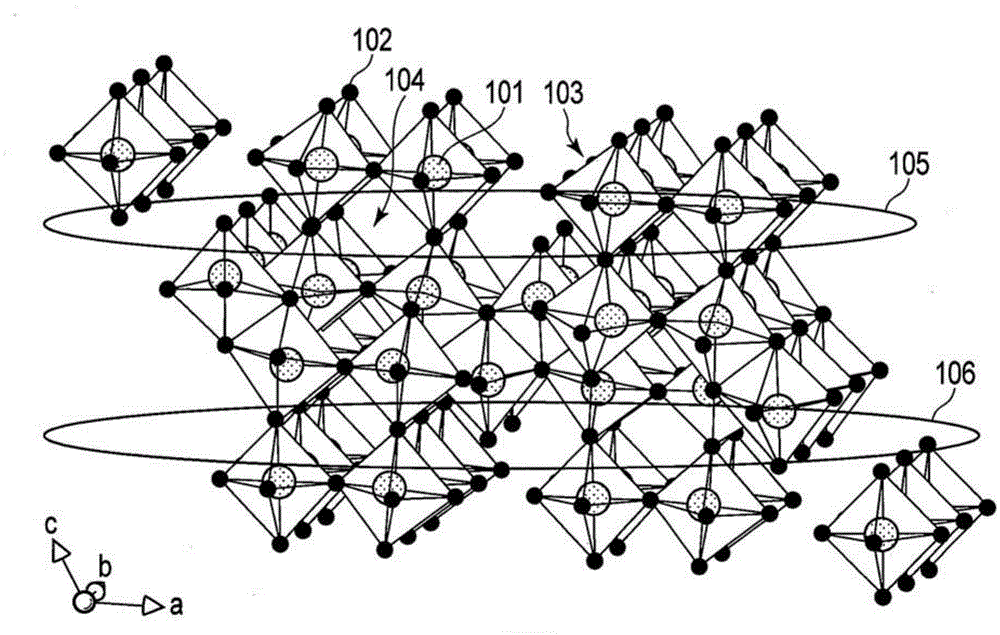
[0219] As a result of ICP analysis, it was found that the composition of the active material particles was TiNb 2 o 7 .
[0220]
[0221] The active material particles obtained in the above manner were added to a solution containing 10% by weight of sucrose based on the weight of the active material, followed by mixing with a ball mill. After mixing...
Embodiment 2
[0239] The active material of Example 2 was produced in the same manner as in Example 1 except that the sintering temperature of the composite in a reducing atmosphere was set to 700°C.
[0240] As a result of ICP analysis, it was found that the composition of the active material particles prepared by the solid phase method was TiNb 2 o 7 .
[0241] In addition, the obtained active material was subjected to Raman spectroscopy in the same manner as in Example 1. Figure 12 The resulting Raman spectrum is shown in .
[0242] Such as Figure 12 Shown, the Raman spectrogram of the active material that obtains in embodiment 2 has in 1587cm -1 G band with peak at and at 1350cm -1 D band with a peak at . In addition, the Lorentzian function fitting method was performed, and the peak intensity I of the G band originating from the carbon material G with the peak intensity of the D band I D The ratio between I G / I D is 1.12.
[0243] In addition, the obtained active material...
Embodiment 3
[0245] The active material of Example 3 was produced in the same manner as in Example 1 except that the sintering temperature of the composite in a reducing atmosphere was set to 750°C.
[0246] As a result of ICP analysis, it was found that the composition of the active material particles prepared by the solid phase method was TiNb 2 o 7 .
[0247] The resulting active material was subjected to Raman spectroscopy in the same manner as in Example 1. As a result, it was found that the obtained active material contained -1 Nearby G-band and 1330cm -1 carbon material near the D band. In addition, the Lorentzian function fitting method was performed, and the peak intensity I of the G band G with the peak intensity of the D band I D The ratio between I G / I D is 0.95.
PUM
 Abstract
Description
Claims
Application Information
 - R&D Engineer
- R&D Manager
- IP Professional
- Industry Leading Data Capabilities
- Powerful AI technology
- Patent DNA Extraction
Browse by: Latest US Patents, China's latest patents, Technical Efficacy Thesaurus, Application Domain, Technology Topic, Popular Technical Reports.
© 2024 PatSnap. All rights reserved.Legal|Privacy policy|Modern Slavery Act Transparency Statement|Sitemap|About US| Contact US: help@patsnap.com


