Photoemission ionization source and application thereof in mass spectrometry or ion mobility spectrometry
An ion mobility spectrometry and photoemission technology, applied in the new ionization technology field, can solve the problems of complicated instruments, and achieve the effect of simplifying the reaction, avoiding trouble, and improving the sensitivity
- Summary
- Abstract
- Description
- Claims
- Application Information
AI Technical Summary
Problems solved by technology
Method used
Image

Examples
Embodiment 1
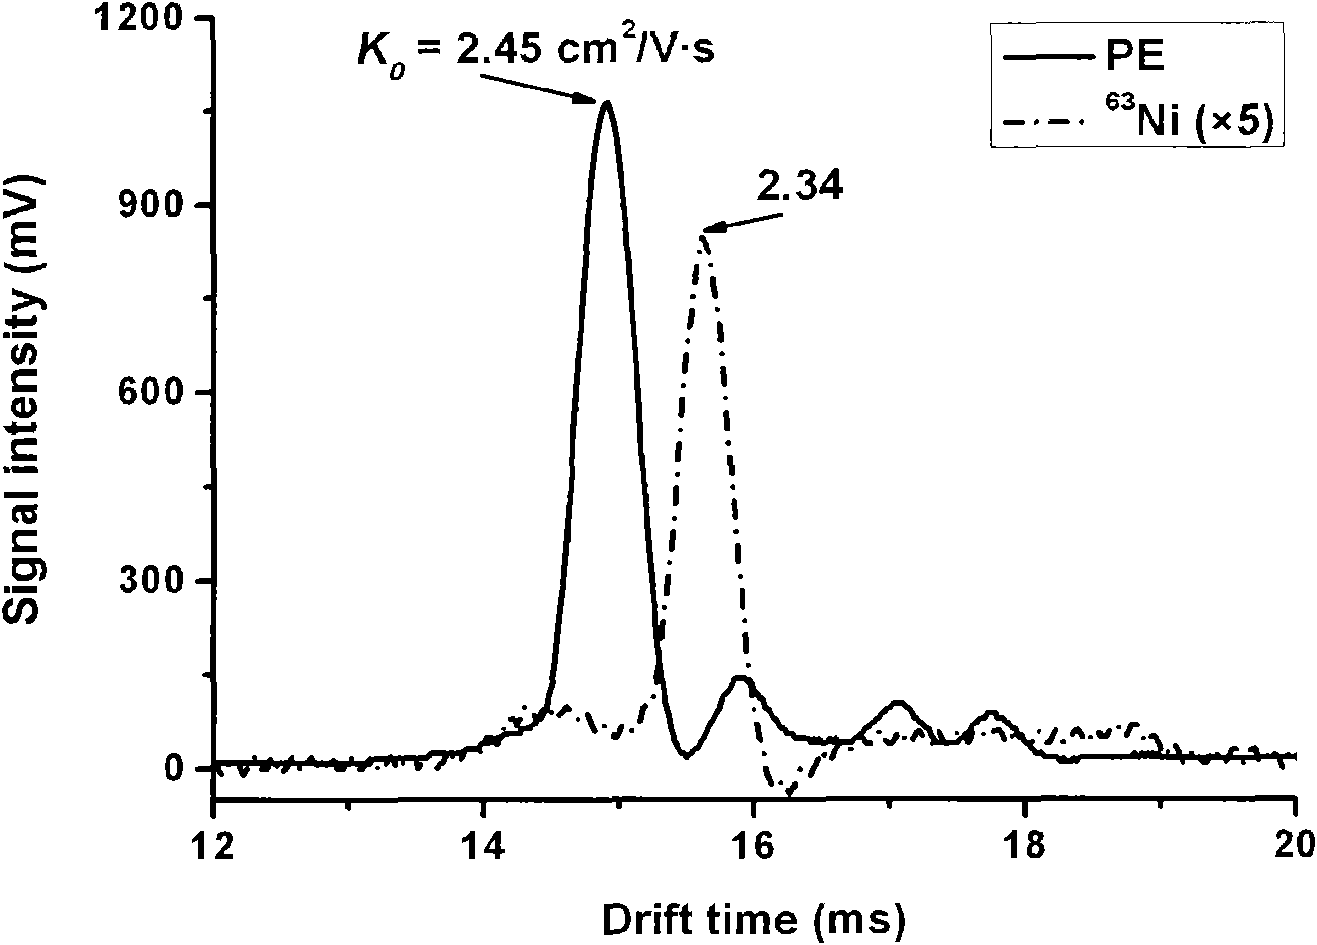
[0038] image 3 The photoemission ionization source and 63 Mobility spectra of reagent ions obtained from Ni source. It can be seen from the figure that the reagent ion migration time obtained by the two ionization sources is different, and the reagent ion peak obtained by the photoemission ionization source is at 14.91ms, 63 The reagent ion peak obtained from the Ni source is at 15.36ms. This shows that their corresponding ions are also different. The reagent ion obtained by photoemission may be CO 3 - (H 2 O) n-1 ,and 63 The reagent ion obtained from Ni source may be O 2 - (H 2 O) n . At the same time, we can see that the reagent ion peak ratio of the photoemission ionization source 63 The reagent ion peak obtained by the Ni source is much stronger, about 63 5 times that of the Ni source reagent ion peak, which shows on the one hand that the sensitivity of the photoemission ionization source is higher than 63 The source of Ni is high.
Embodiment 2
[0040] Figure 4 Shown are the mobility spectra of four explosives (TNT, RDX, HMX and PETN) obtained using a photoemission ionization source combined with ion mobility spectrometry. As can be seen from the figure, all four explosives are well detected. The four explosives all obtained a product peak (T1, R1, H1 and P1) at a migration time of 17.70ms, NO 3 The group cluster ion——NO 3 - ·Y (Y stands for H 2 O, HNO 3 equal molecules). At the same time, they also have their own characteristic peaks - TNT has a characteristic peak (T2) at 23.14ms; RDX has a characteristic peak at 25.84ms; HMX presents two characteristic peaks (H2 and H3), at 25.90ms and 28.50ms; PETN has a characteristic peak at 30.74ms.
Embodiment 3
[0042] Figure 5 Given is the photoemission ionization source coupled with ion mobility to detect halogen compounds (CH 2 Cl 2 , CH 2 Br 2 , CH 3 I) Migration spectrum. It can be seen from the figure that the three halogen compounds are also well detected and resolved. CH in the figure 2 Cl 2 The characteristic peaks at 15.45ms and 17.80ms, CH 2 Br 2 The characteristic peaks are at 14.36ms, 16.35ms and 18.45ms, CH 3 The characteristic peaks of I are at 18.07ms and 20.16ms.
PUM
 Abstract
Description
Claims
Application Information
 - R&D
- Intellectual Property
- Life Sciences
- Materials
- Tech Scout
- Unparalleled Data Quality
- Higher Quality Content
- 60% Fewer Hallucinations
Browse by: Latest US Patents, China's latest patents, Technical Efficacy Thesaurus, Application Domain, Technology Topic, Popular Technical Reports.
© 2025 PatSnap. All rights reserved.Legal|Privacy policy|Modern Slavery Act Transparency Statement|Sitemap|About US| Contact US: help@patsnap.com