
Quantitative analysis method capable of reducing analytical apparatus spectrogram relative deviation RSD

A quantitative analysis and analytical instrument technology, applied in instruments, analytical materials, scientific instruments, etc., can solve single, undiscovered and other problems, and achieve the reduction of relative deviation RSD value, the reduction of the influence of electrode area and dilution, and the reduction of influence. Effect

Inactive Publication Date: 2009-08-19
QIQIHAR MEDICAL UNIVERSITY
View PDF0 Cites 5 Cited by
  • Summary
  • Abstract
  • Description
  • Claims
  • Application Information

AI Technical Summary

Problems solved by technology

[0003] The reason why the above-mentioned various measurement methods have the same common problem is that the factors considered in the design of equipment and operation functions are still relatively single, or there are still great limitations in thinking
If you want to greatly reduce the deviation caused by the RSD value, you must improve the relevant parameters and methods, and the relevant reports on this type of technology have not yet been found.

Method used


Image

  • Quantitative analysis method capable of reducing analytical apparatus spectrogram relative deviation RSD
  • Quantitative analysis method capable of reducing analytical apparatus spectrogram relative deviation RSD
  • Quantitative analysis method capable of reducing analytical apparatus spectrogram relative deviation RSD

Examples


example 1

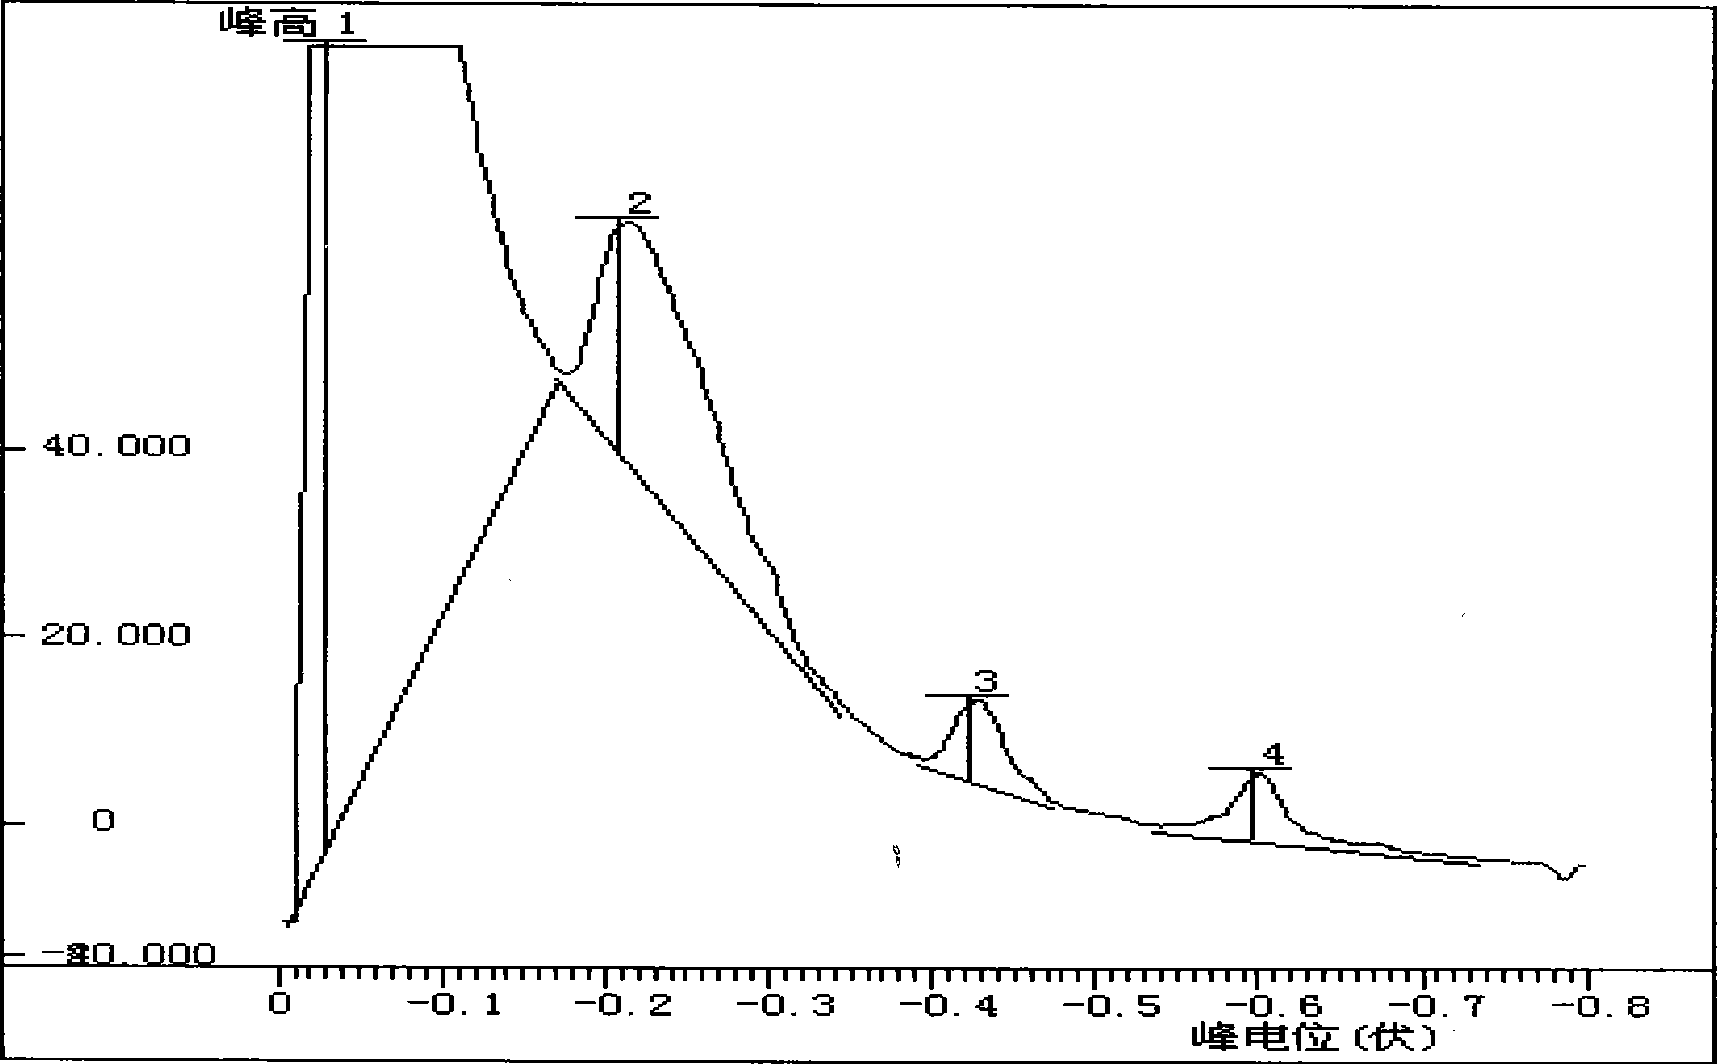
[0036] This example is the polarographic quantitative analysis method of the present invention, and concrete steps are as follows:

[0037] (1) Preparation of measurement solution

[0038] A test component is contained in the solution to be tested, and then the internal standard component is added quantitatively. The internal standard component is selected from the internal standard prepared by the heavy metal element cadmium.

[0039] (2) Measurement curve drawing

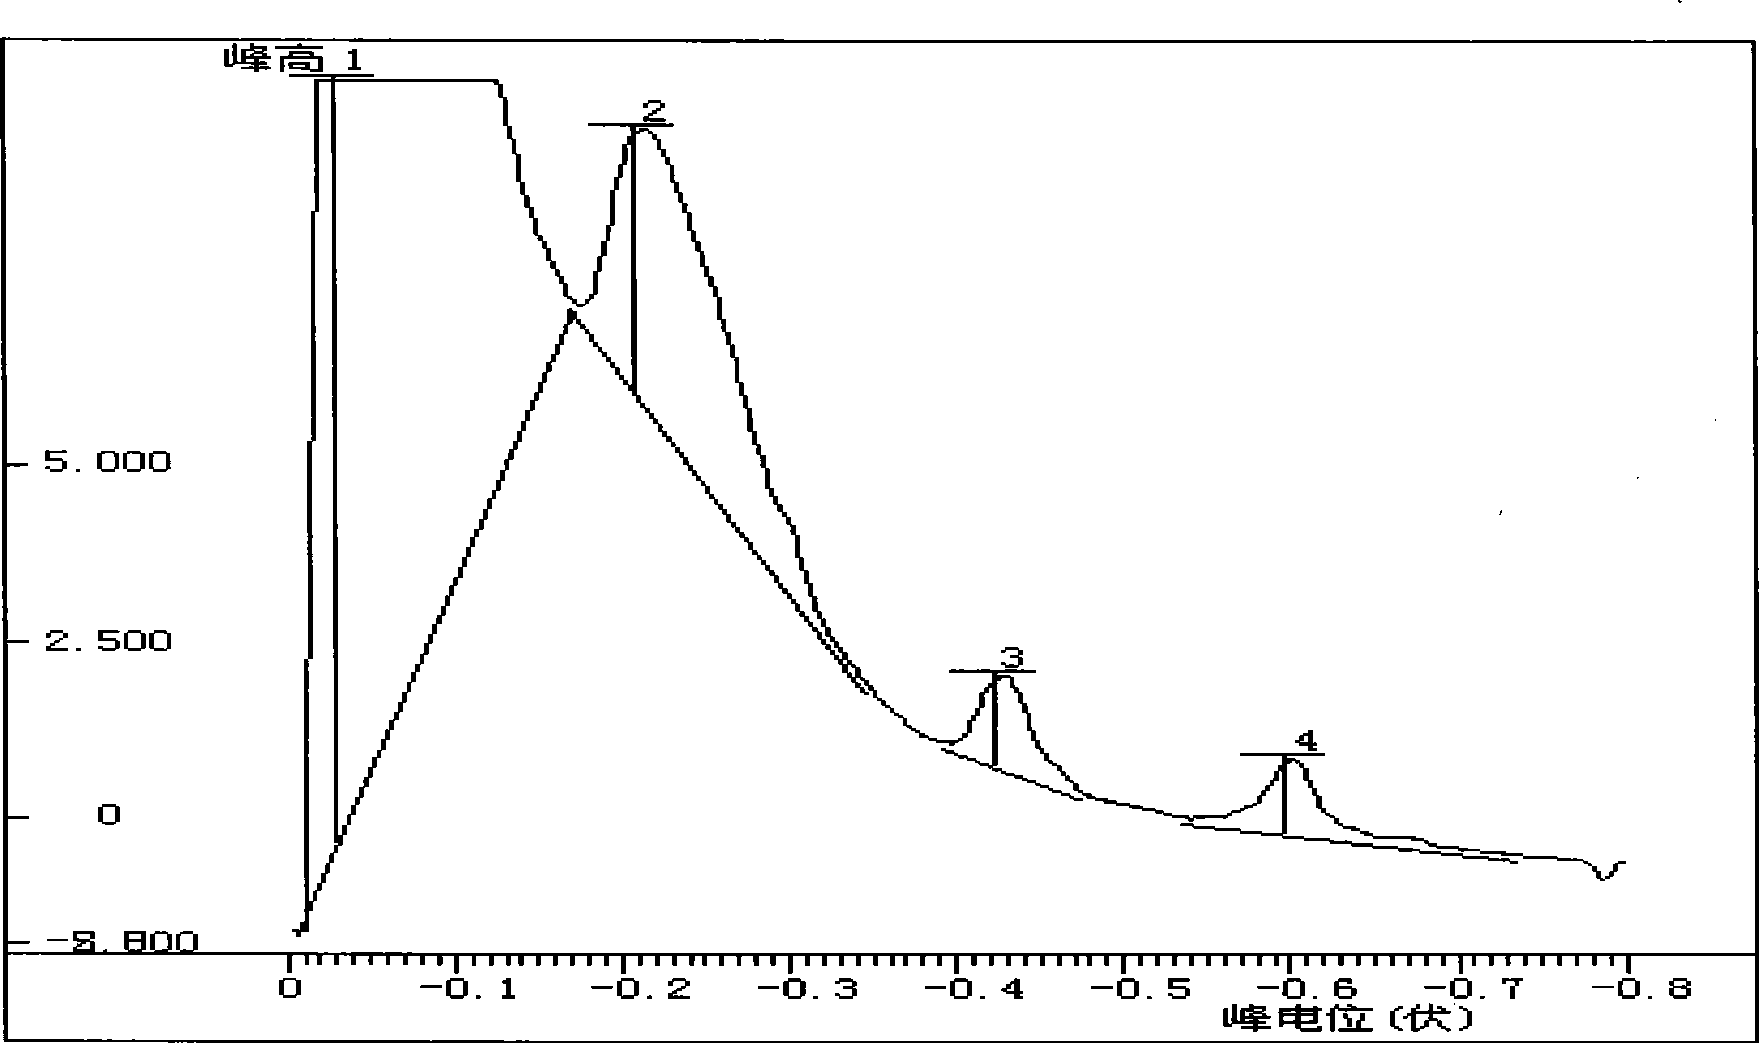
[0040] The measurement curve coordinate parameters are set to measure peak height and potential. See figure 2 .

[0041] (3) Calculation of measured values

[0042] First, obtain the peak height of all components and the peak potential, peak time, or peak wavelength corresponding to the peak height. The calculated peak height is called the absolute height of the peak height. Then calculate the peak height or peak area of ​​the internal standard according to the peak potential or peak time of the internal s...

example 2

[0044] This example is the stripping voltammetry quantitative analysis method of the present invention, and concrete steps are as follows:

[0045] (1) Preparation of measurement solution

[0046] The solution to be tested contains two components to be tested, and then the internal standard component is added quantitatively. The internal standard component is an internal standard prepared from the heavy metal element nickel.

[0047] (2) Measurement curve drawing

[0048] The measurement curve coordinate parameters are set to measure peak height and potential.

[0049] (3) Calculation of measured values

[0050] Same as Example 1.

example 3

[0052] This example is the potential stripping quantitative analysis method of the present invention, and the specific steps are as follows:

[0053] (1) Preparation of measurement solution

[0054] The solution to be tested contains three components to be measured, and then the internal standard component is added quantitatively. The internal standard component is an internal standard prepared from the heavy metal element cobalt.

[0055] (2) Measurement curve drawing

[0056] The measurement curve coordinate parameters are set to measure peak height and potential.

[0057] (3) Calculation of measured values

[0058] Same as Example 1.


PUM


Abstract

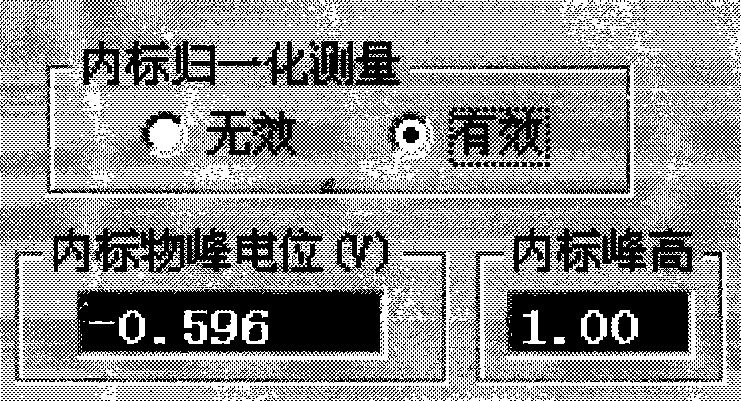
The invention discloses a quantitative analysis method which is capable of reducing the relative spectrogram deviation (RSD) of an analytical instrument. The method comprises the steps of preparation of a measuring solution, drawing of a measure curve and calculation of a measured value, wherein besides components to be measured, internal standard substance components are quantitatively added in the preparation of the solution to be measured; after measurement, a series of discrete signal points are obtained on a new coordinate system, and continuous curves of different types of equipment and corresponding methods are further obtained; and an internal standard normalized spectrogram defined in the method is obtained by calculating the spectrogram, and the calculated peak height or peak area is called relative peak height or relative peak area. The quantitative analysis method has the beneficial effects that as the new spectrogram expression method of internal standard normalized spectrogram is creatively designed and adopted for the first time, the RSD value of the spectrogram in the existing analytical instrument is greatly reduced, namely the influence of operating conditions on the peak height is obviously reduced; and proved by experiments, remarkable improvement effects are achieved in the existing various instrument analysis methods.

Description

technical field [0001] The invention relates to a quantitative analysis method that can reduce the relative deviation RSD of the spectrogram of an analytical instrument. The method is at least applicable to polarographic analysis, stripping voltammetry analysis, potential stripping analysis, chromatographic analysis, and spectral analysis and various types of trace elements. quantitative determination process. Background technique [0002] Due to the influence of known operating conditions, the relative standard deviation RSD of the peak height or peak area obtained in the existing analytical instrument analysis method and trace element quantitative analysis method is generally very large, which will naturally affect the accuracy of the analysis results sex. For example, when the dissolution analysis method is used to measure blood lead, the RSD value is usually greater than 10%, and the measured results will naturally have a large error. Furthermore, when a mercury static...

Claims


Application Information

Patent Timeline
Patent Type & Authority Applications(China)
IPC IPC(8): G01N27/26G01N30/86G01N21/27G01J3/00G06F17/00
Inventor 张榕刘吉成张波
Owner QIQIHAR MEDICAL UNIVERSITY
Learn More