Method and apparatus for verifying the authenticity of an item by detecting encoded luminescent security markers
A security marking and authenticity technology, which can be used in the verification of the authenticity of banknotes, fluorescence/phosphorescence, material excitation analysis, etc., and can solve problems such as impracticality and complexity.
- Summary
- Abstract
- Description
- Claims
- Application Information
AI Technical Summary
Problems solved by technology
Method used
Image
Examples
example 1
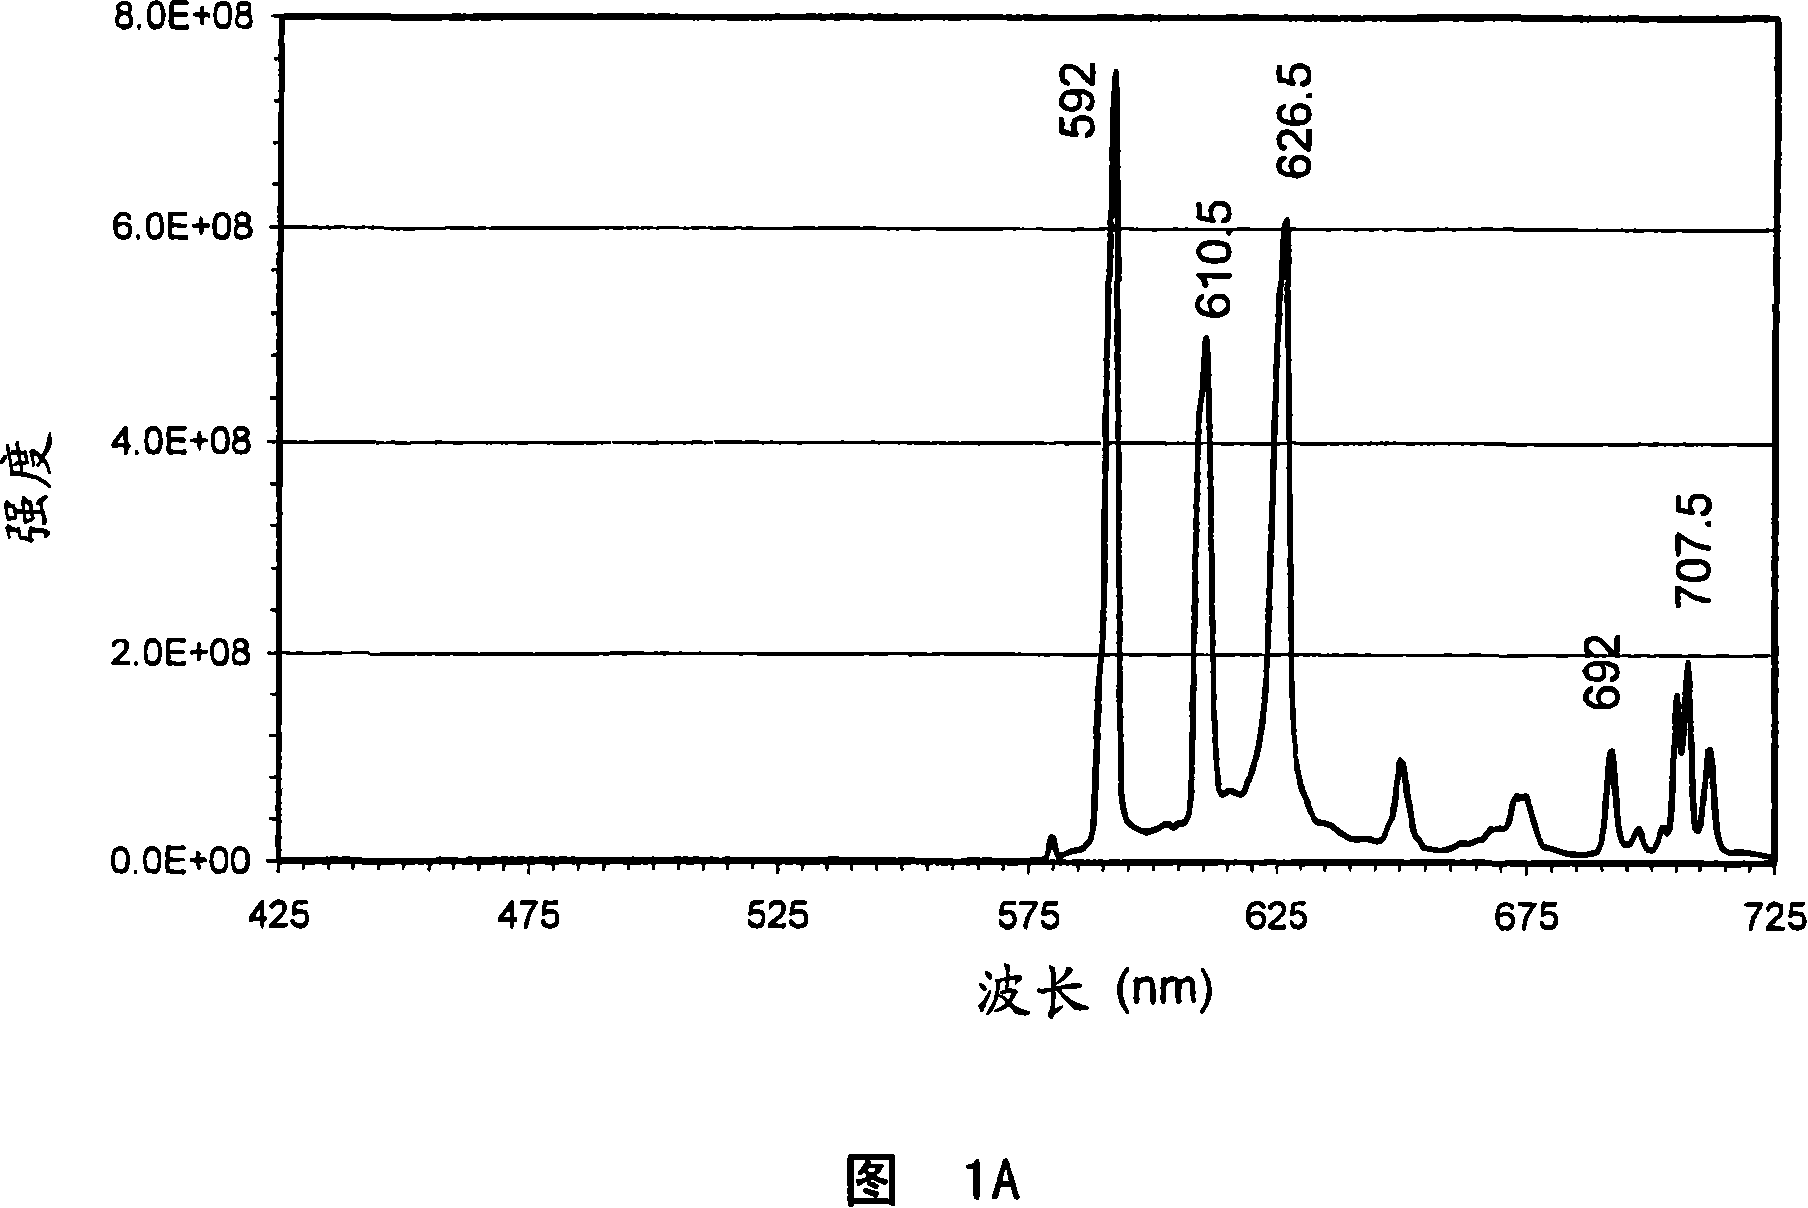
[0080] Example 1 The luminescent material has a spectrum containing 3 peaks (Fig. 1A)
[0081] Apparatus 10 having four photodetector assemblies according to the configuration of Figure 2 can be used to determine the authenticity of articles bearing luminescent security markings having an emission spectrum similar to that shown in Figure 1A. In this arrangement, the bandpass filter 54 of the photodetector assembly 50 is centered at 589 nanometers and has a full width at half maximum (FWHM) transmission of 10 nanometers in order to pass the wavelength band of 584-594 nanometers, the photodetector Bandpass filter 64 of assembly 60 passes a wavelength band of 605-615 nanometers, and bandpass filter 74 of photodetector assembly 70 passes a wavelength band of 689-699 nanometers. Also for this spectrum, light detector assembly 80 with bandpass filter 88 can pass light between 540 and 570 nanometers to verify the absence of significant light energy in this wavelength range.
example 2
[0082] Example 2 Security marking with two luminescent materials to illustrate separation of Eu using specific wavelength beam splitters (48, 58) 3+ and Tb 3+ the glow
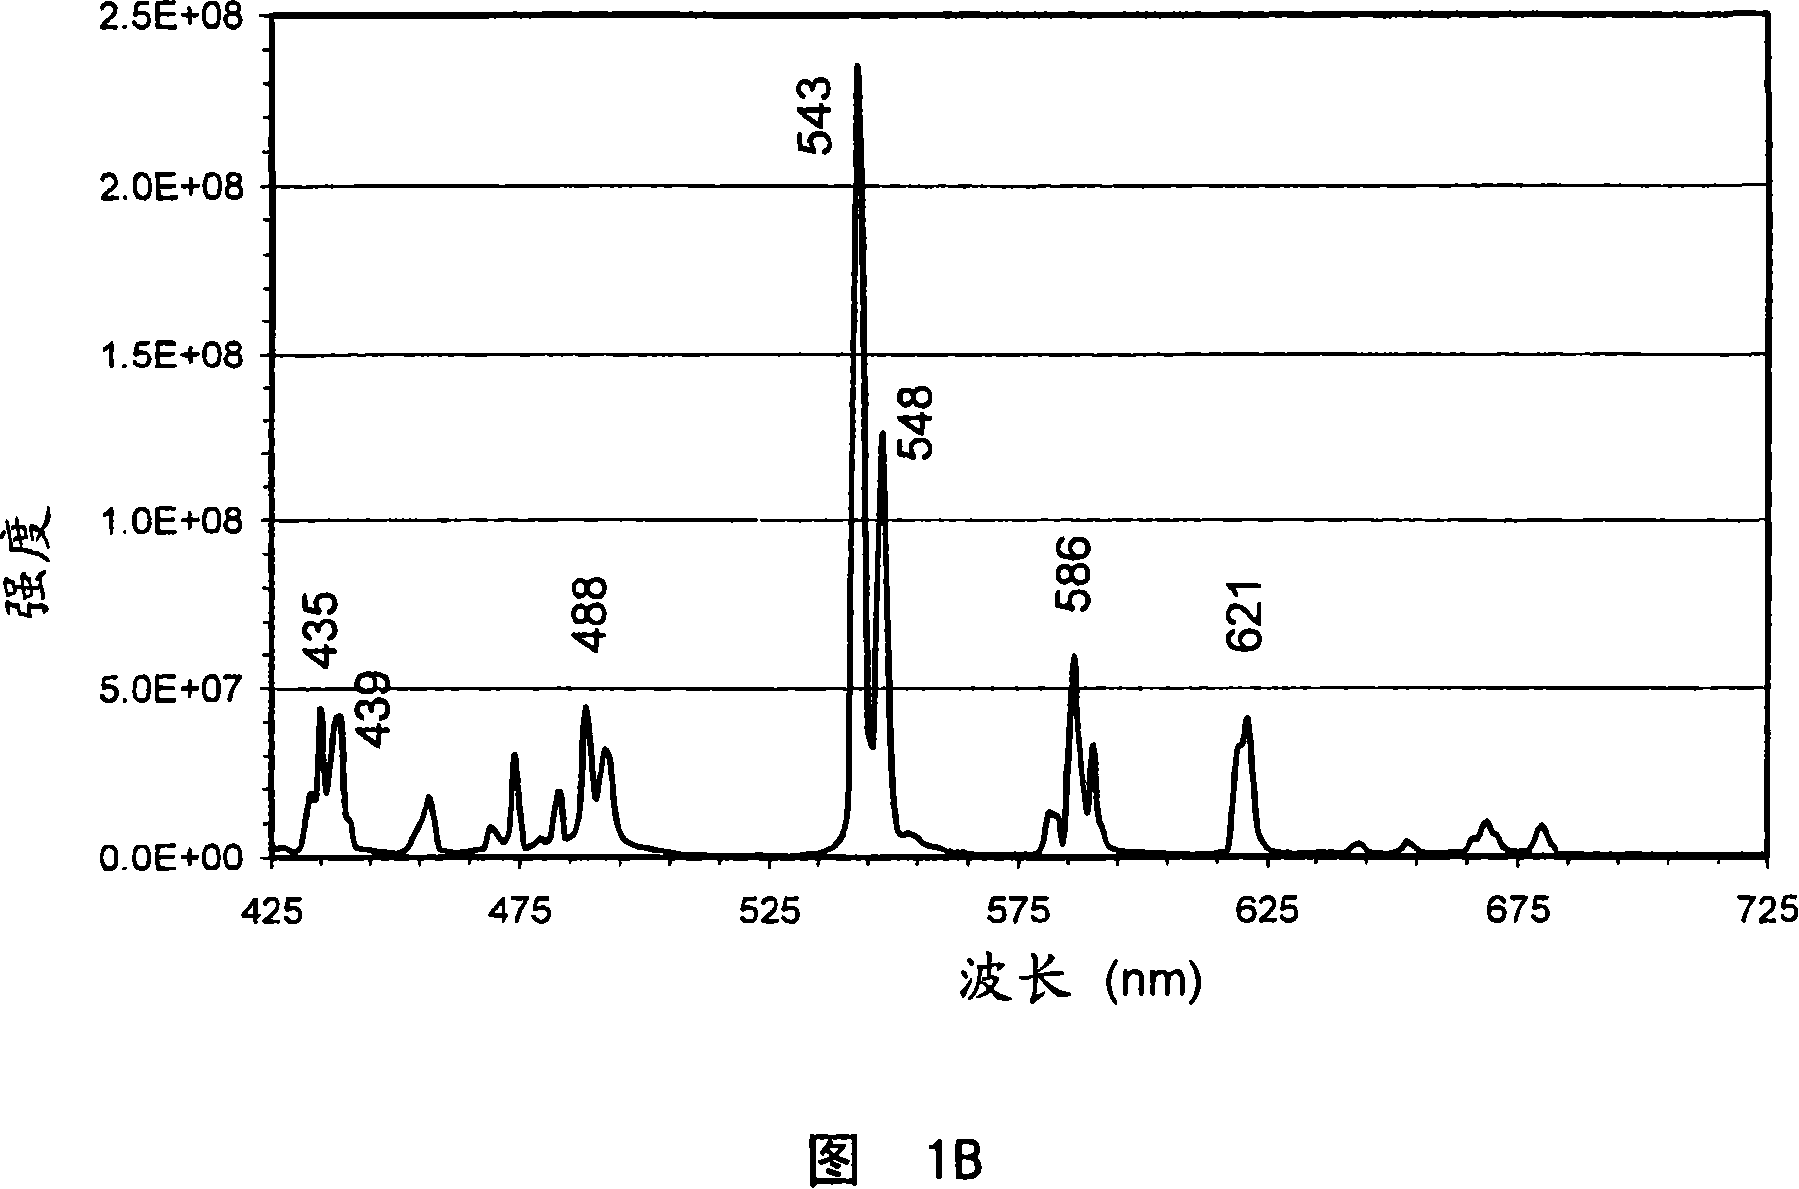
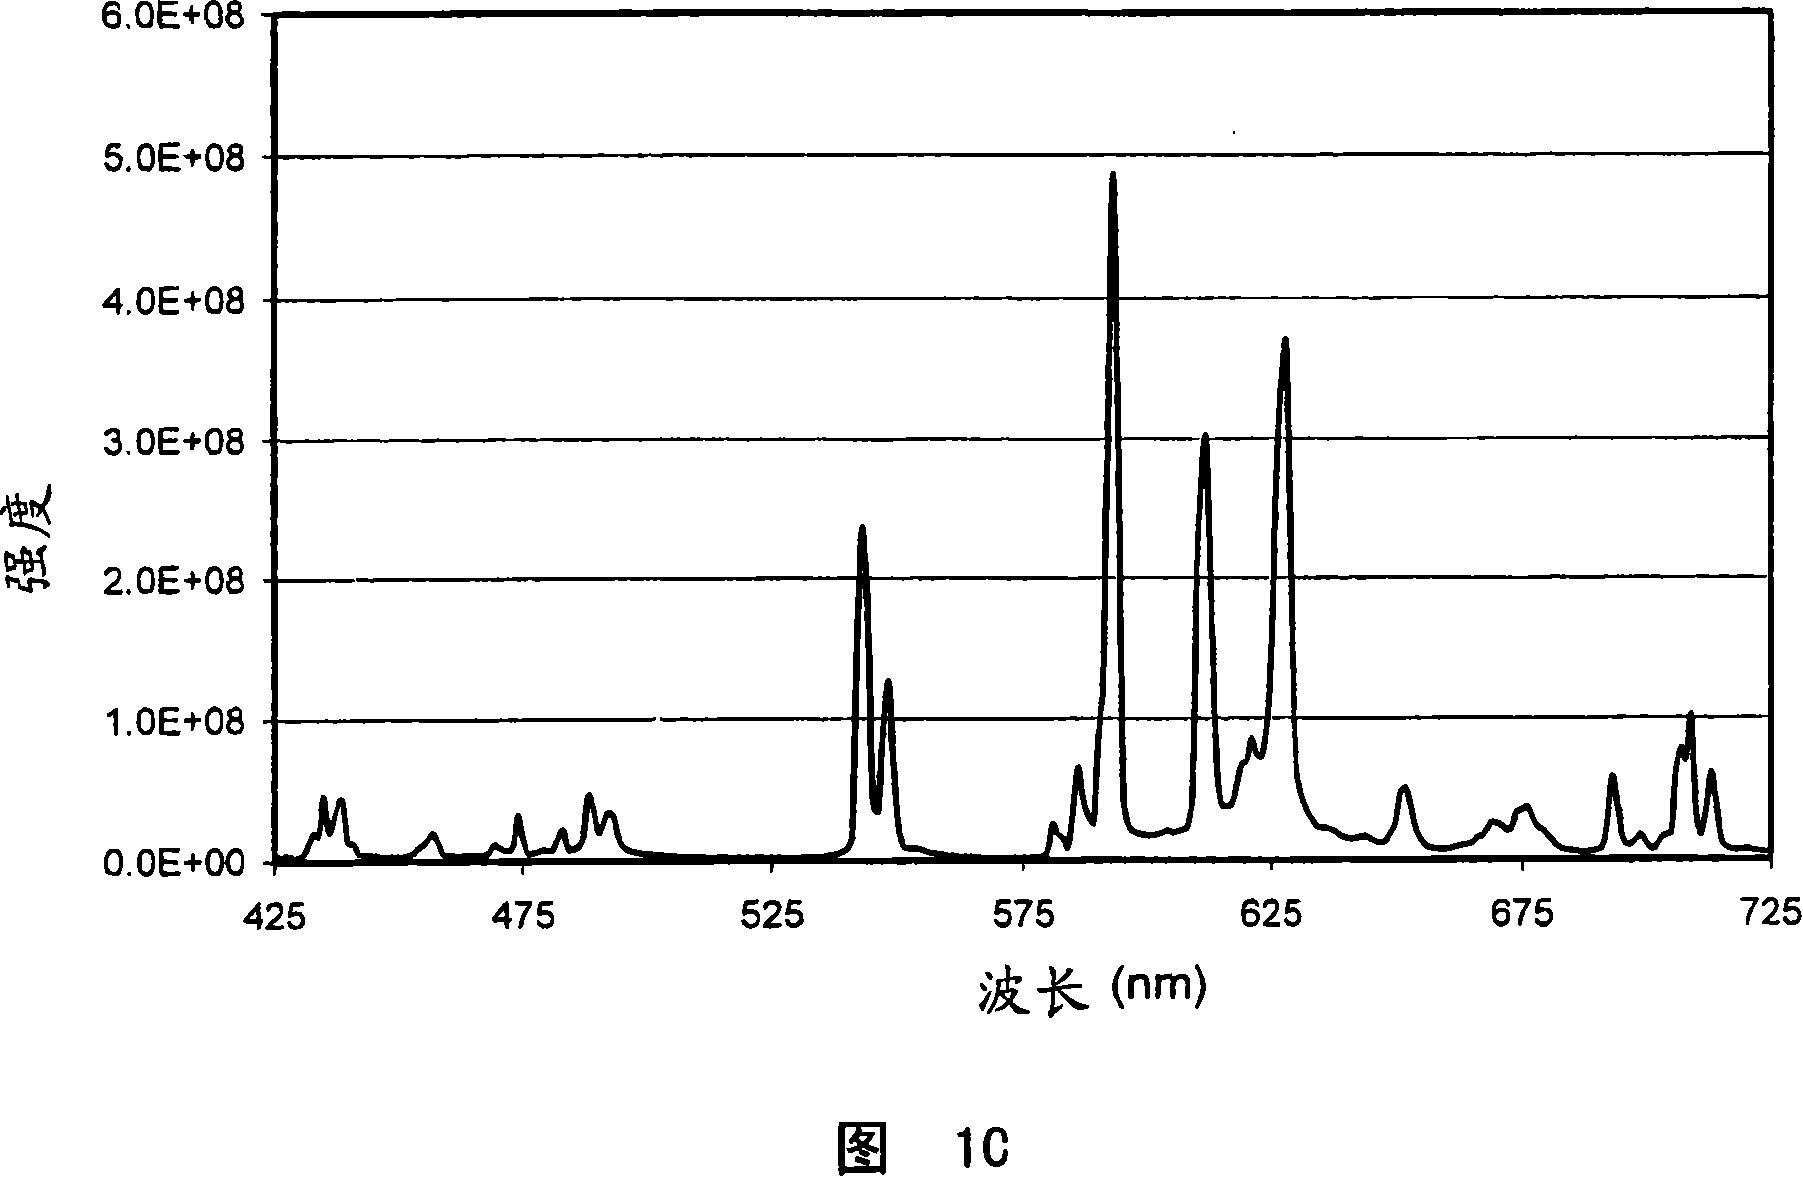
[0083] By combining Kasei Optonix(Y, Gd)BO excited by 394 nm light 3 : The first spectrum of Eu (sold as KX-504A) (Fig. 1A) with GTE Sylvania Gd excited by 377 nm light 2 o 2 The second spectrum (Fig. 1B) of S:Tb (type 2611) is mathematically added and "synthesized" to obtain a set of "Tb 3+ +Eu 3+ "Emission spectra, each multiplied by a variable factor to simulate different mixing ratios (as listed in columns 2 and 3 of Table 1 below). Using SPEX with excitation and emission resolution set to 1 nm Fluorolog-3 The spectrometer measures two starting spectra. The resulting synthetic emission spectrum of this hypothetical mixture (shown in Figure 1C) was convolved with the reflectance spectral responses of the two filters chosen to separate the green Tb emission from the red Eu emission. The green f...
example 3
[0118] Example 3 sync detection
[0119] A commercial single-phase lock-in amplifier (EG&G Princeton Applied Research Model 5209) was used to analyze the output signal from the silicon photodiode circuit. The LEDs were electronically modulated by a Stanford Research DG535 pulse generator. The modulated excitation waveform is a square wave with independently variable pulse width and pulse frequency. Due to the use of a lock-in amplifier with an electronic bandpass filter centered at the LED modulation frequency, only the fundamental cos(ωt) component of the Fourier series expansion of the signal produced by the square wave excitation is detected. It should be appreciated that a slightly larger signal can be obtained by modulating the LED output sinusoidally such that the entire signal occurs at a single modulation frequency. The displayed data was acquired with a lock time constant of 1 second (chosen to conform to the criteria of a 1 second read time), which corresponds to...
PUM
 Abstract
Description
Claims
Application Information
 - R&D Engineer
- R&D Manager
- IP Professional
- Industry Leading Data Capabilities
- Powerful AI technology
- Patent DNA Extraction
Browse by: Latest US Patents, China's latest patents, Technical Efficacy Thesaurus, Application Domain, Technology Topic, Popular Technical Reports.
© 2024 PatSnap. All rights reserved.Legal|Privacy policy|Modern Slavery Act Transparency Statement|Sitemap|About US| Contact US: help@patsnap.com


