
Melting curve analysis with exponential background subtraction

a technology of melting curve and background subtraction, applied in the field of nuclear acid melting curve analysis, can solve the problems of amplified wild type sequences known, unrecommended sequencing for cystic fibrosis screening, and limited common variants

Active Publication Date: 2011-11-29
UNIV OF UTAH RES FOUND
View PDF4 Cites 16 Cited by
  • Summary
  • Abstract
  • Description
  • Claims
  • Application Information

AI Technical Summary

Benefits of technology

"The invention provides a method for analyzing the melting profile of a nucleic acid sample by measuring its fluorescence as a function of temperature. This method allows for the separation of background fluorescence signals from the nucleic acid sample signal, resulting in a corrected melting curve that includes the sample signal. The invention also provides a system for carrying out this analysis and a method for analyzing multiple melting plots. The technical effects of the invention include improved accuracy and sensitivity in detecting nucleic acid sequence variations."

Problems solved by technology

Furthermore, unbiased, hierarchal clustering can accurately group the melting curves into genotypes.
This is why sequencing is not recommended for cystic fibrosis screening.
Nevertheless, in the vast majority of genetic analysis, the amplified wild type sequence is known and potential common variants are limited.
However, the melting curve analysis prior to high-resolution capabilities provided a lack of specificity and accuracy.
With the advent of high-resolution melting curve analysis, background fluorescence noise can interfere with the use of melting curves to accurately genotype SNPs, detect sequence variations, and detect mutations.
Depending on the amplicon, previous background fluorescence removal techniques have led to some erroneous calls.
However, this and other previous normalization techniques have not worked as well with unlabeled probes (Zhou L, Myers A N, Vandersteen J G, Wang L, Wittwer C T. Closed-Tube Genotyping with Unlabeled Oligonucleotide Probes and a Saturating DNA Dye.
When linear extrapolation is used, the lines can intersect before the melting transition is complete, and when this occurs the previous techniques do not provide the most accurate means for melting curve analysis, in part due to their mathematical reliance on absolute fluorescence.

Method used


Image

  • Melting curve analysis with exponential background subtraction
  • Melting curve analysis with exponential background subtraction
  • Melting curve analysis with exponential background subtraction

Examples


example 1

Hemochromatosis (HFE) Mutation and Polymorphism Genotyping

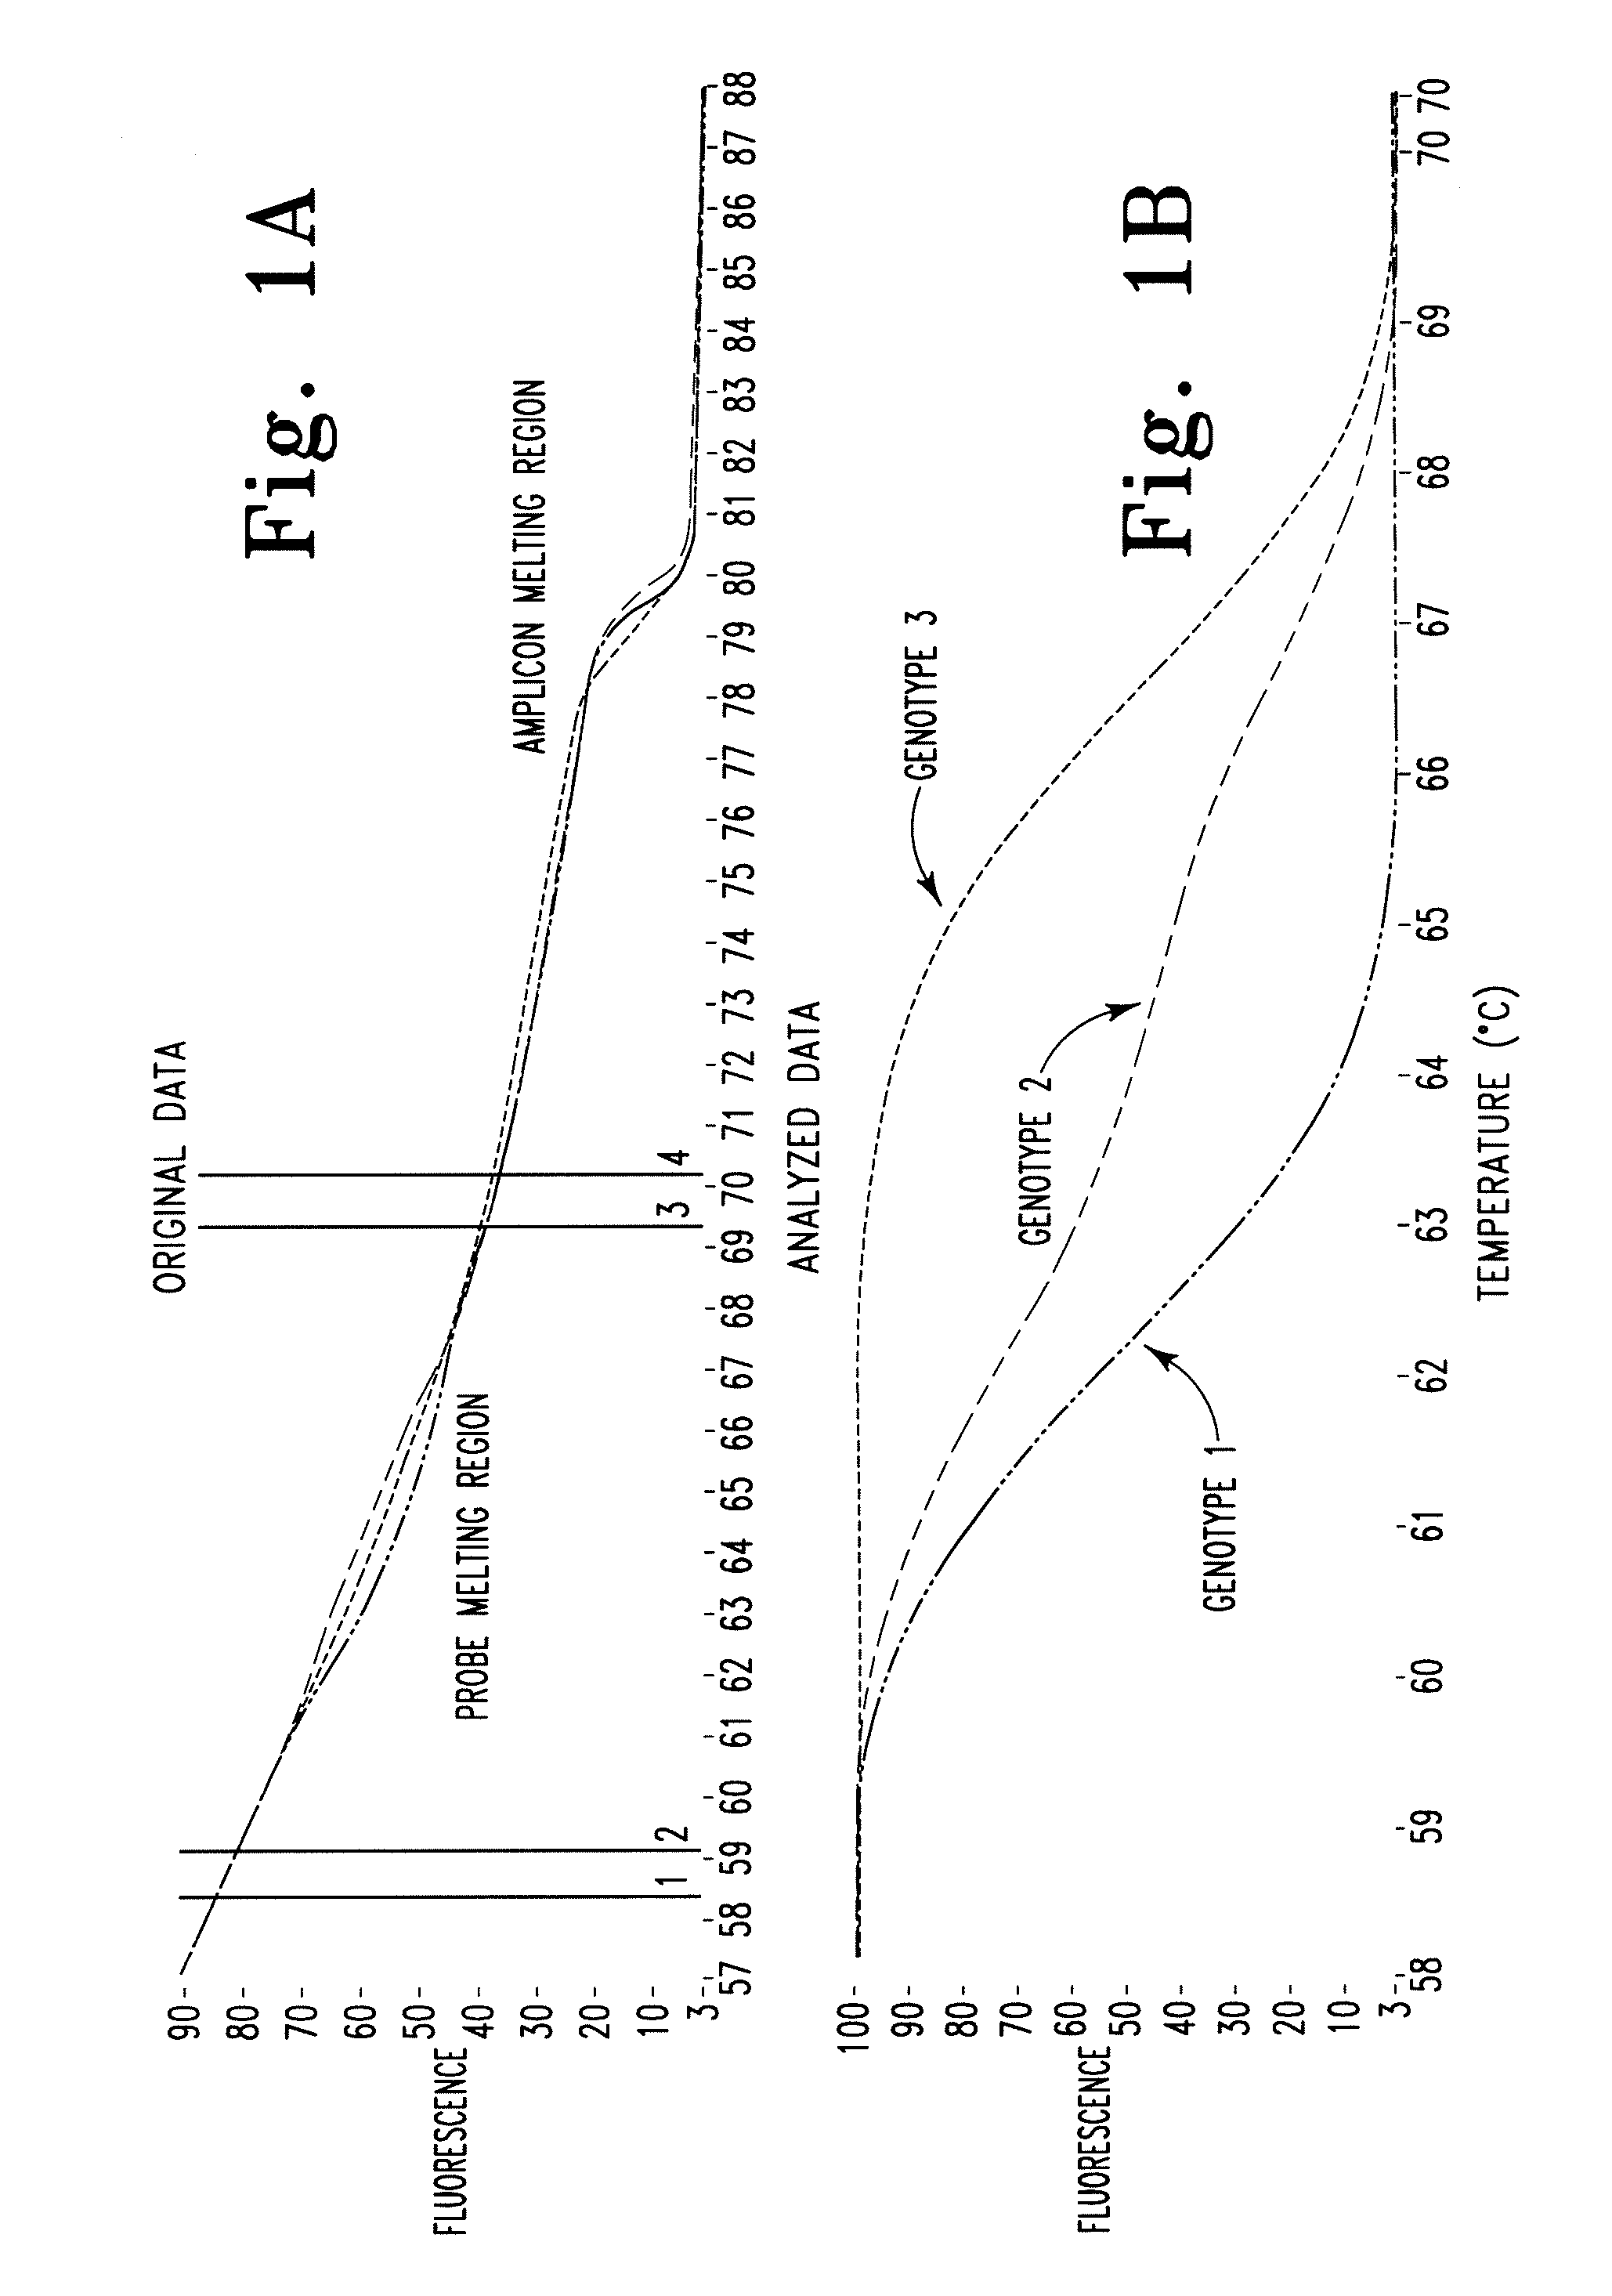
[0070]Hemochromotosis gene mutations and polymorphisms are known to interfere with normal iron metabolism in Humans. In this illustrative example, detection and identification of polymorphism and mutation genotypes through melting curve analysis is more accurate with exponential background subtraction then baseline background subtraction. Analysis was performed with small amplicons (78 bp and 40 bp) in order to increase the Tm difference between different homozygote samples. Unlabeled probes are utilized for genotyping SNPs that otherwise could not be easily genotyped by amplicon melting.

[0071]Human genomic DNA representing distinct hemochromatosis genotypes can be amplified by various PCR instruments. An exemplary method includes 10 μl reaction volumes with a Roche LightCycler® 2.0. Following PCR amplification, the HFE samples are heated in an HR-1 (Idaho Technology) melting instrument for approximately 115 seconds. The resu...

example 2

Factor V Leiden (384 Well Plate) Derivative Clustering Combined Probe and Amplicon

[0072]Factor V Leiden is the most common hereditary blood coagulation disorder in the United States. It is present in approximately 5% of the Caucasian population and approximately 1.2% of the African American population. Factor V Leiden as a gene target is important for the detection of SNPs that are linked to coagulation disorder disposition.

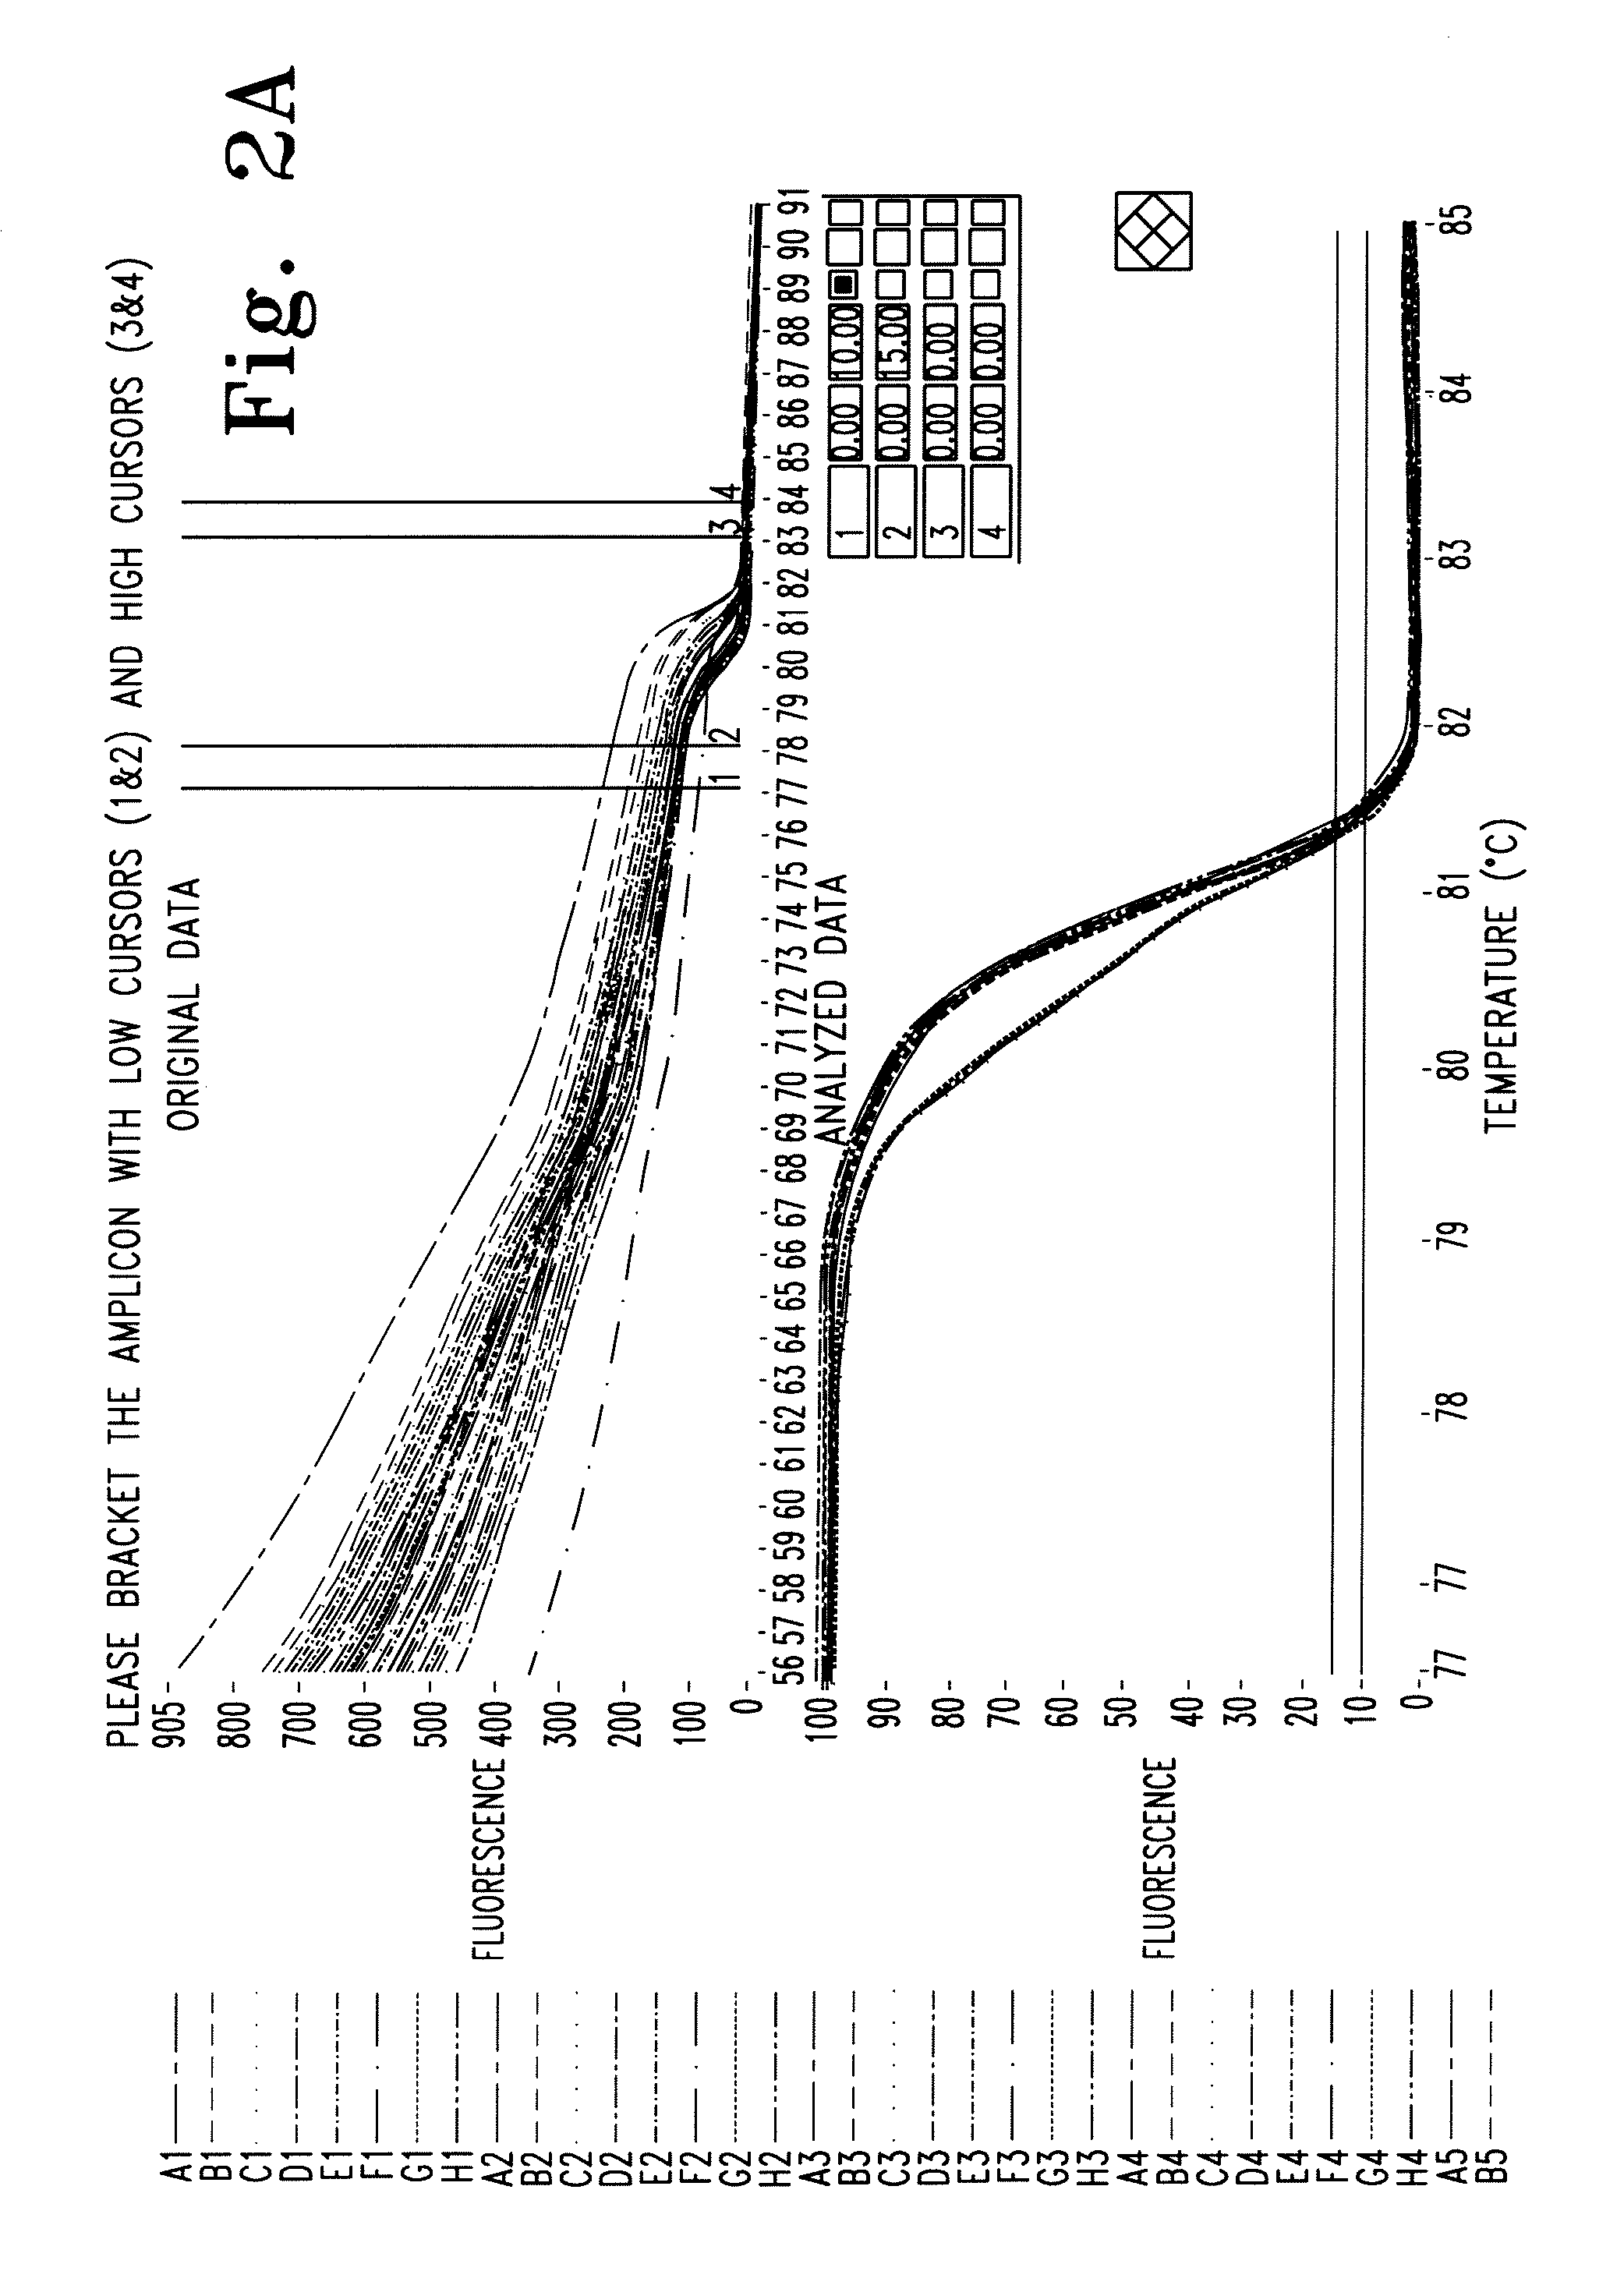
[0073]Human Factor V Leiden genomic DNA samples representing different Factor V Leiden genotypes were amplified in an ABI 9700 with 10 μl reaction volume and 12 μl oil overlay. The assay included a Factor V Leiden amplicon of approximately 100 bp having a sequence of 5′-CTGAAAGGTTACTTCAAGGACAAAATACCTGTATTCCTCGCCTGTCCAGGG ATCTGCTCTTACAGATTAGAAGTAGTCCTATTAGCCCAGAGGCGATGTC-3′ (SEQ. ID NO:1), which was amplified by forward primer 5′-CTGAAAGGTTACTTCAAGGAC-′3 (SEQ. ID NO:2) and reverse primer 5′-GACATCGCCTCTGGG-3′ (SEQ. ID NO:3). The assay also included an unlabeled pr...

example 3

Factor V Leiden (96 Well Plate) Derivative Clustering of Probe Only

[0077]Human Factor V Leiden genomic DNA samples representing different Factor V Leiden genotypes were amplified in an ABI 9700 with 10 μl reaction volume and 12 μl oil overlay. The assay included a Factor V Leiden amplicon and an unlabeled probe, as described above in Example 2, in the presence of 1X LCGreen Plus®. The resultant PCR samples were heated from 58° C. to 88° C. at 0.1° C. / s in a LightScanner melting instrument using a 96 well reaction plate. The total melting procedure required approximately 5 minutes for completion.

[0078]The LightScanner melting instrument measured and recorded the fluorescence as a function of temperature. The raw melting curve result of the procedure is shown in FIG. 6A. A negative derivative plot as a function of temperature was performed from the melting curve data of FIG. 6A and is shown in FIG. 6B. Two sets of vertical cursor lines are present at approximately 59° C. and 60° C., a...


PUM

PropertyMeasurementUnit
temperaturesaaaaaaaaaa

Abstract

A system and methods are provided for melting curve genotyping analysis of nucleic acids. Melting curves are generated by plotting fluorescence of a sample as a function of temperature. In one illustrative example, an exponential algorithm is employed to remove the background from generated melting curves and thereby perform comparative analysis to other melting curves. Additional illustrative examples provide for measuring the differences between two or more melting curves and clustering the genotypes of the provided sample nucleic acids.

Description

CROSS REFERENCE TO RELATED APPLICATION[0001]This application claims the benefit of U.S. Provisional Patent Application No. 60 / 719,250, entitled “Removal of Background from the Melting Curve of a Double Stranded Nucleotide” filed on Sep. 20, 2005, which is hereby incorporated by reference herein.FIELD OF THE INVENTION[0002]Generally the present invention relates to nucleic acid melting curve analysis. More specifically various embodiments of the present invention relate to methods and systems for analyzing the melting profiles of double stranded nucleic acids by removing the background fluorescence signals.BACKGROUND OF THE INVENTION[0003]Methods for analyzing DNA sequence variation can be divided into two general categories: 1) genotyping for known sequence variants and 2) scanning for unknown variants. There are many methods for genotyping known sequence variants, and single step, homogeneous, closed tube methods that use fluorescent probes are available (Lay M J, et al., Clin. Che...

Claims


Application Information

Patent Timeline
Patent Type & Authority Patents(United States)
IPC IPC(8): G06F19/00G06F15/00C12Q1/68G16B25/10G16B40/30
CPCC12Q1/6816G06F19/20C12Q2527/107C12Q2537/113C12Q2537/165G16B40/30G16B25/10G16B20/10G16B40/00G16B25/00
Inventor PALAIS, ROBERT ANDREWWITTWER, CARL THOMAS
Owner UNIV OF UTAH RES FOUND
Learn More