
Methods and systems for planning and tracking software reliability and availability

Inactive Publication Date: 2010-06-15
MICROSOFT TECH LICENSING LLC
View PDF26 Cites 12 Cited by
  • Summary
  • Abstract
  • Description
  • Claims
  • Application Information

AI Technical Summary

Benefits of technology

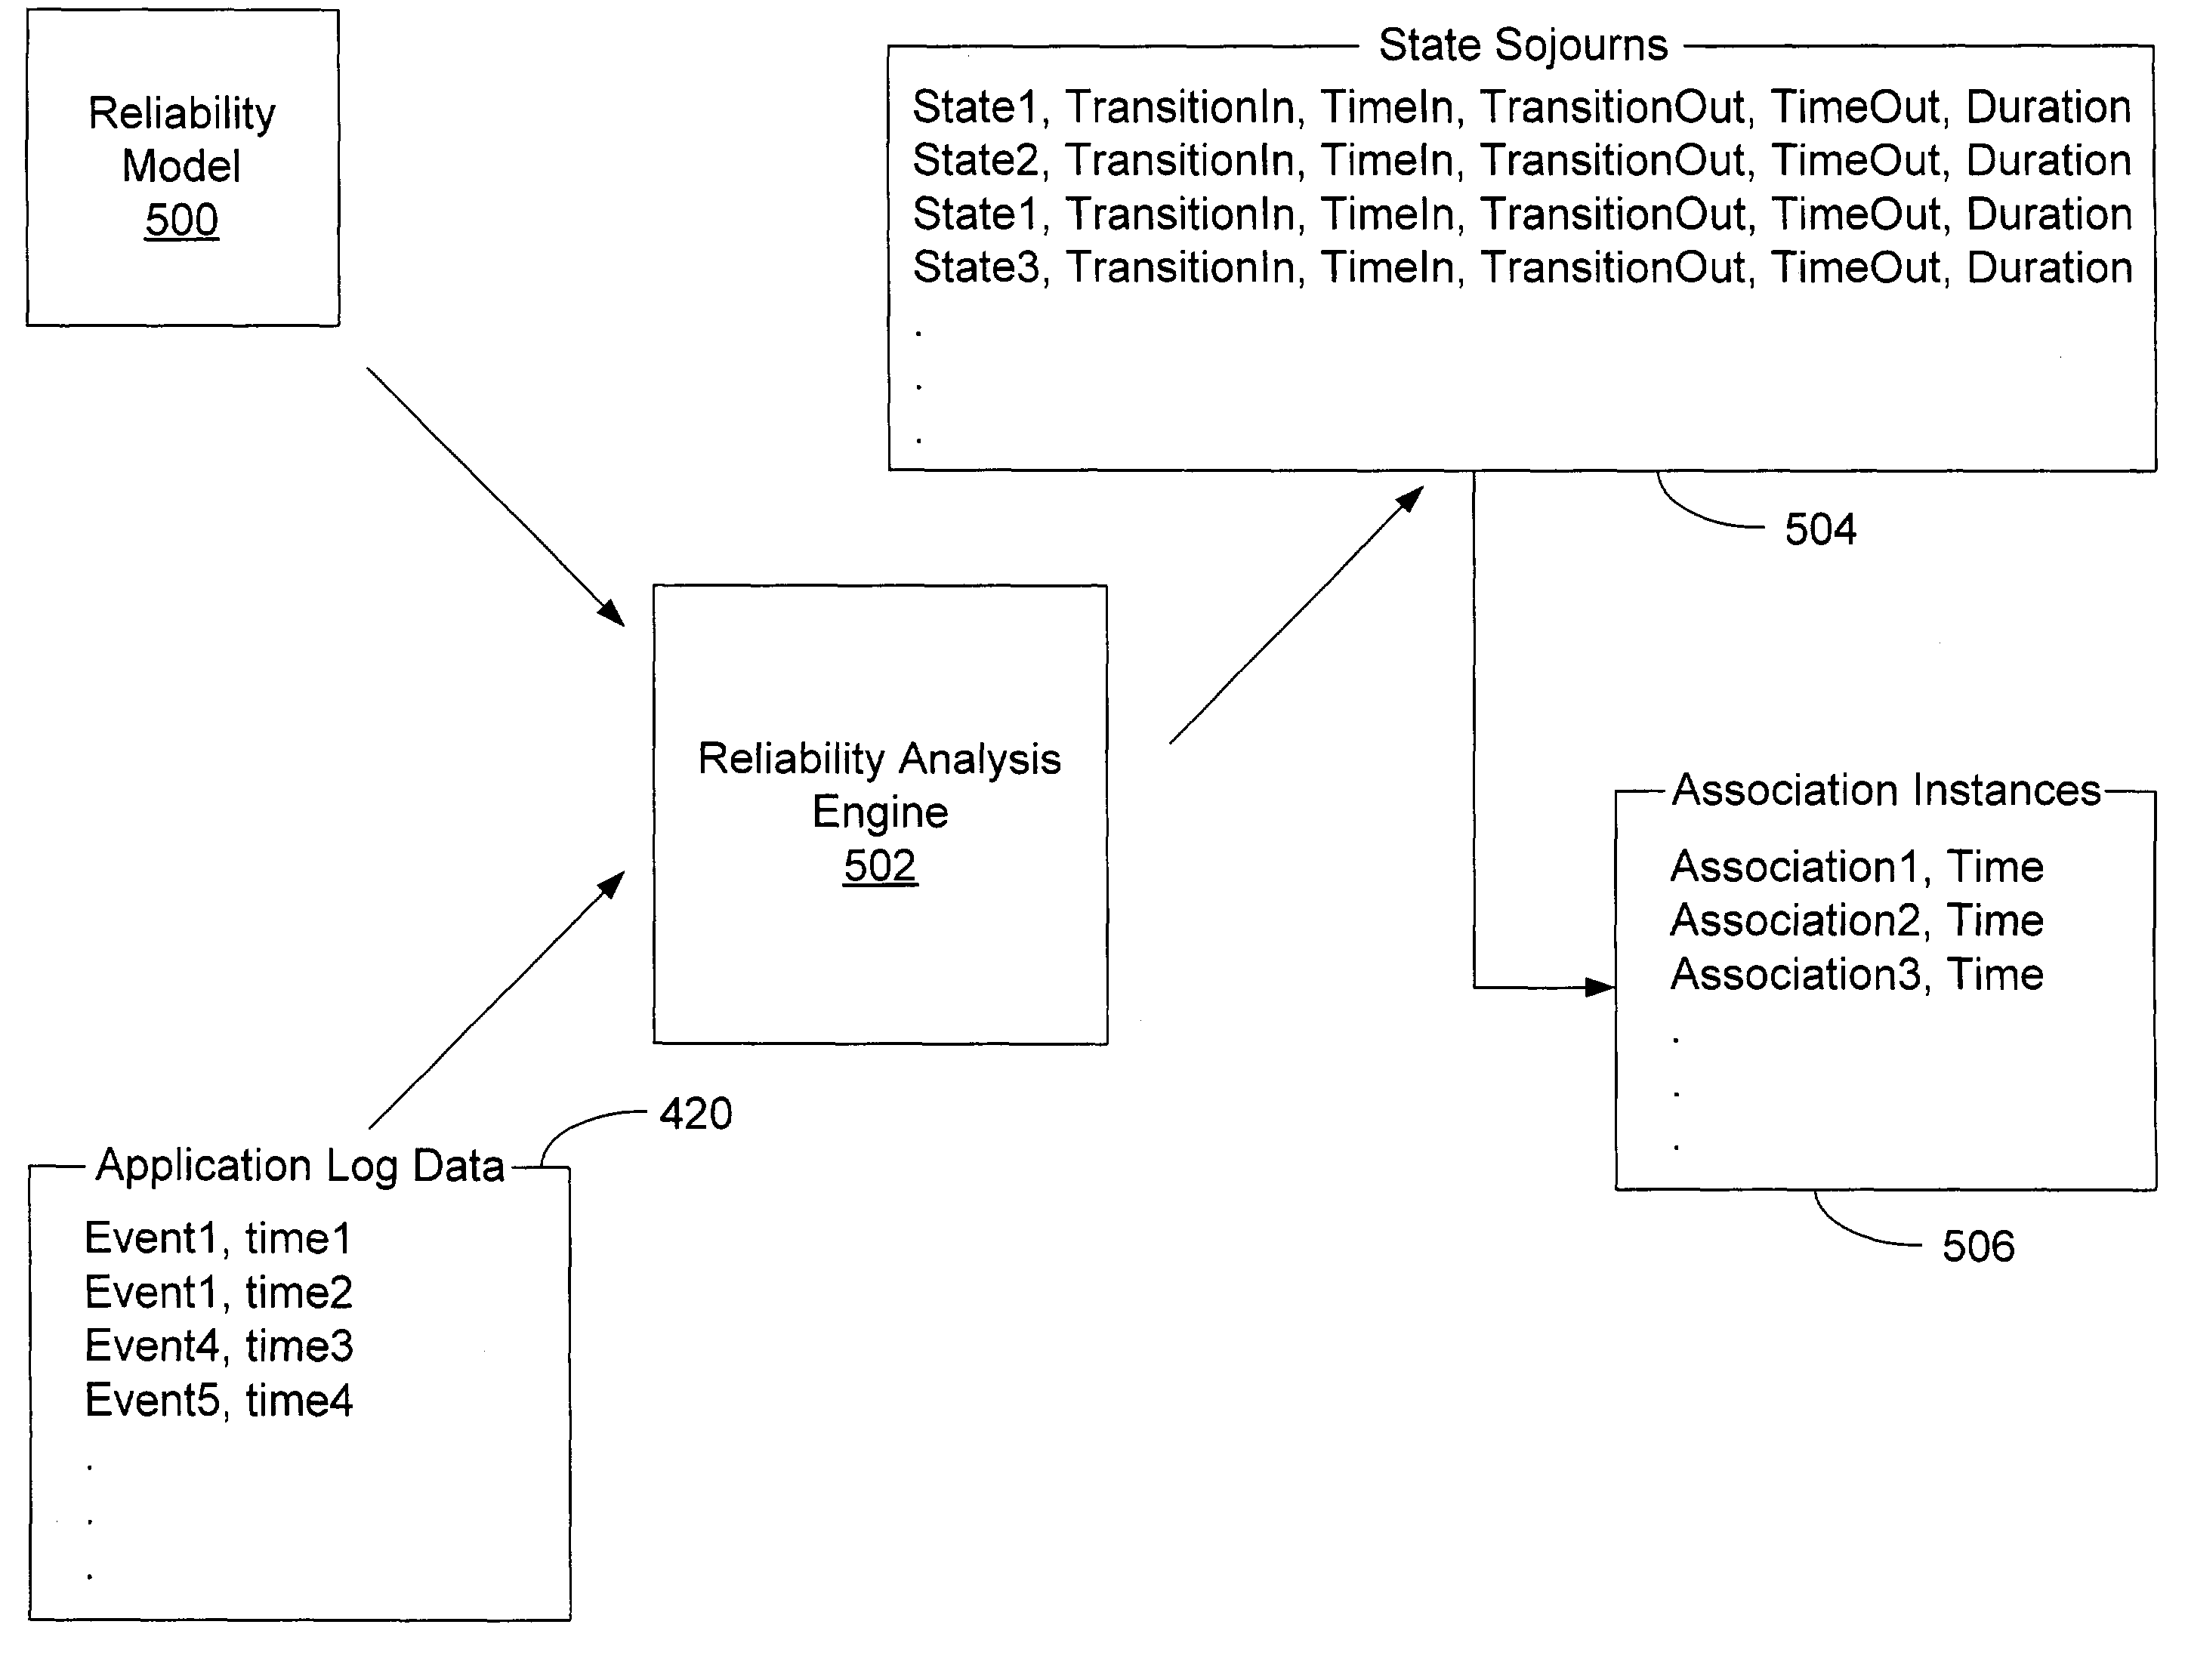
[0008]In view of the foregoing, the present invention provides a method for analyzing computer reliability and availability data and tracking data against customer-defined objectives. This method enables network administrators to track the reliability and availability of software and hardware components within their systems, to identify root causes of both planned and unplanned downtime, and to take preventive measures to improve system reliability and availability.

Problems solved by technology

If the service availability is low, there will be a very definite cost in terms of lost revenue as well as in opportunity and customer goodwill costs.
If the business is providing a higher level of availability than that required, say striving for 99.99% availability on a 24×7 basis, when the business really only requires 8×5, then the business is incurring a higher cost than necessary in terms of hardware, software, and operations overhead to meet the additional—and unneeded—level of availability.
Yet today many businesses do not have service reliability and availability objectives set in accordance with their business needs, and furthermore they do not have accurate measurements to characterize either their long term (i.e., non-real time) availability or their areas for improvement.
Even when objectives are set and reliability data are collected, accurately analyzing and interpreting the results are difficult due to the need for specialized expertise which is often not available.
The lack of specialized expertise can lead to improper interpretation of the data, and thus an incorrect estimation of the achieved service availability.
If the level of service availability being delivered is incorrectly overestimated, the company's customers can become dissatisfied.
If the level of availability is underestimated, the requested improvements, to achieve the desired objective, are unnecessary.
While ticketing systems can be a rich source of individual failure troubleshooting data, the timing values recorded by the operations staff are often inaccurate, especially when considering the level of accuracy required for these types of measurements (e.g., 99.999% availability is only 5 minutes of downtime a year).
The degree of inaccuracy varies from event to event and occurs for many reasons, including unwillingness to document all of the work if the right troubleshooting steps were not taken, and the business of the staff was during the time of the failure, sometimes not closing the ticket for hours or even days after resolution.
However they do not provide an accurate measure of availability if their polling rate (i.e., the frequency with which they ping the web servers) is insufficient to measure the desired level of accuracy (e.g., pinging a server every 15 minutes is certainly insufficient for measuring 99.999% availability).
Even in cases where the polling frequency is appropriate, these measurement tools do not provide insight into what portion of the system is at fault when there is a failure or even the frequency of server shutdowns (i.e., the reliability of the servers) making it difficult to troubleshoot problems and improve results.
In addition, the tools do not provide insight into the cost of maintaining a given level of availability, that is, into the amount of work required by the operations staff to meet the objectives.
For example, when pinging a web-server farm, the tools do not usually know which server is responding behind the load balancing technology in use.
The responding server may or may not change between service pings making it very hard to determine individual server behavior.

Method used


Image

  • Methods and systems for planning and tracking software reliability and availability
  • Methods and systems for planning and tracking software reliability and availability
  • Methods and systems for planning and tracking software reliability and availability

Examples


Embodiment Construction

[0020]In the description that follows, the invention is described with reference to acts and symbolic representations of operations that are performed by one or more computers, unless indicated otherwise. As such, it will be understood that such acts and operations, which are at times referred to as being computer-executed, include the manipulation by the processing unit of the computer of electrical signals representing data in a structured form. This manipulation transforms the data or maintains them at locations in the memory system of the computer, which reconfigures or otherwise alters the operation of the computer in a manner well understood by those skilled in the art. The data structures where data are maintained are physical locations of the memory that have particular properties defined by the format of the data. However, while the invention is being described in the foregoing context, it is not meant to be limiting as those of skill in the art will appreciate that several...


PUM


Abstract

Disclosed is a software application reliability and availability tracking and reporting mechanism that collects event data from target computers, analyzes the data, and produces reliability and availability reports. A network administrator specifies target computers for which event data are collected. The collected event data along with a reliability model are provided to a reliability and availability analysis engine. Output from the engine includes reliability and availability data expressed as durations of time spent in each state and as associations with the events. The reliability and availability data are fed to a report generator which computes reliability and availability metrics. The metrics are used to generate reports that can be interpreted by the network administrator without the need for specialized data analysis skills. The metrics are also aggregated to provide historical and relative ranking reliability and availability data useful for planning and tracking against reliability and availability objectives.

Description

RELATED APPLICATIONS[0001]This application contains information related to United States Patent Application for “Methods And Systems For Collecting, Analyzing, and Reporting Software Reliability And Availability,” Joseph P. Mullally et al., inventors, filed on May 14, 2003, and to United States Patent Application for “Methods And Systems For Analyzing Software Reliability And Availability,” Silvio M. Susskind inventor, filed on May 14, 2003.TECHNICAL FIELD[0002]The present invention relates generally to software application reliability and availability tracking and, more particularly, to analyzing, reporting, and planning software application reliability and availability.BACKGROUND OF THE INVENTION[0003]Providing customers with a high level of service availability at a low cost is imperative in today's business computing environment. Meeting this goal requires corporations to establish the right availability objectives to meet their business needs, to track the level of availability...

Claims


Application Information

Patent Timeline
IPC IPC(8): G06F9/44G06F9/45
CPCG06F11/008
Inventor GARZIA, MARIO R.CRITTENDEN, HEIDI
Owner MICROSOFT TECH LICENSING LLC
Learn More