
Segmenting audio signals into auditory events

a technology of audio signals and segments, applied in the field of psychoacoustic processing of audio signals, can solve the problems of computational complexity, specialized techniques for sound separation, and the practicability of auditory scene analysis, and achieve the effect of reducing the number of audio signals

Inactive Publication Date: 2010-05-04
DOLBY LAB LICENSING CORP
View PDF98 Cites 92 Cited by
  • Summary
  • Abstract
  • Description
  • Claims
  • Application Information

AI Technical Summary

Benefits of technology

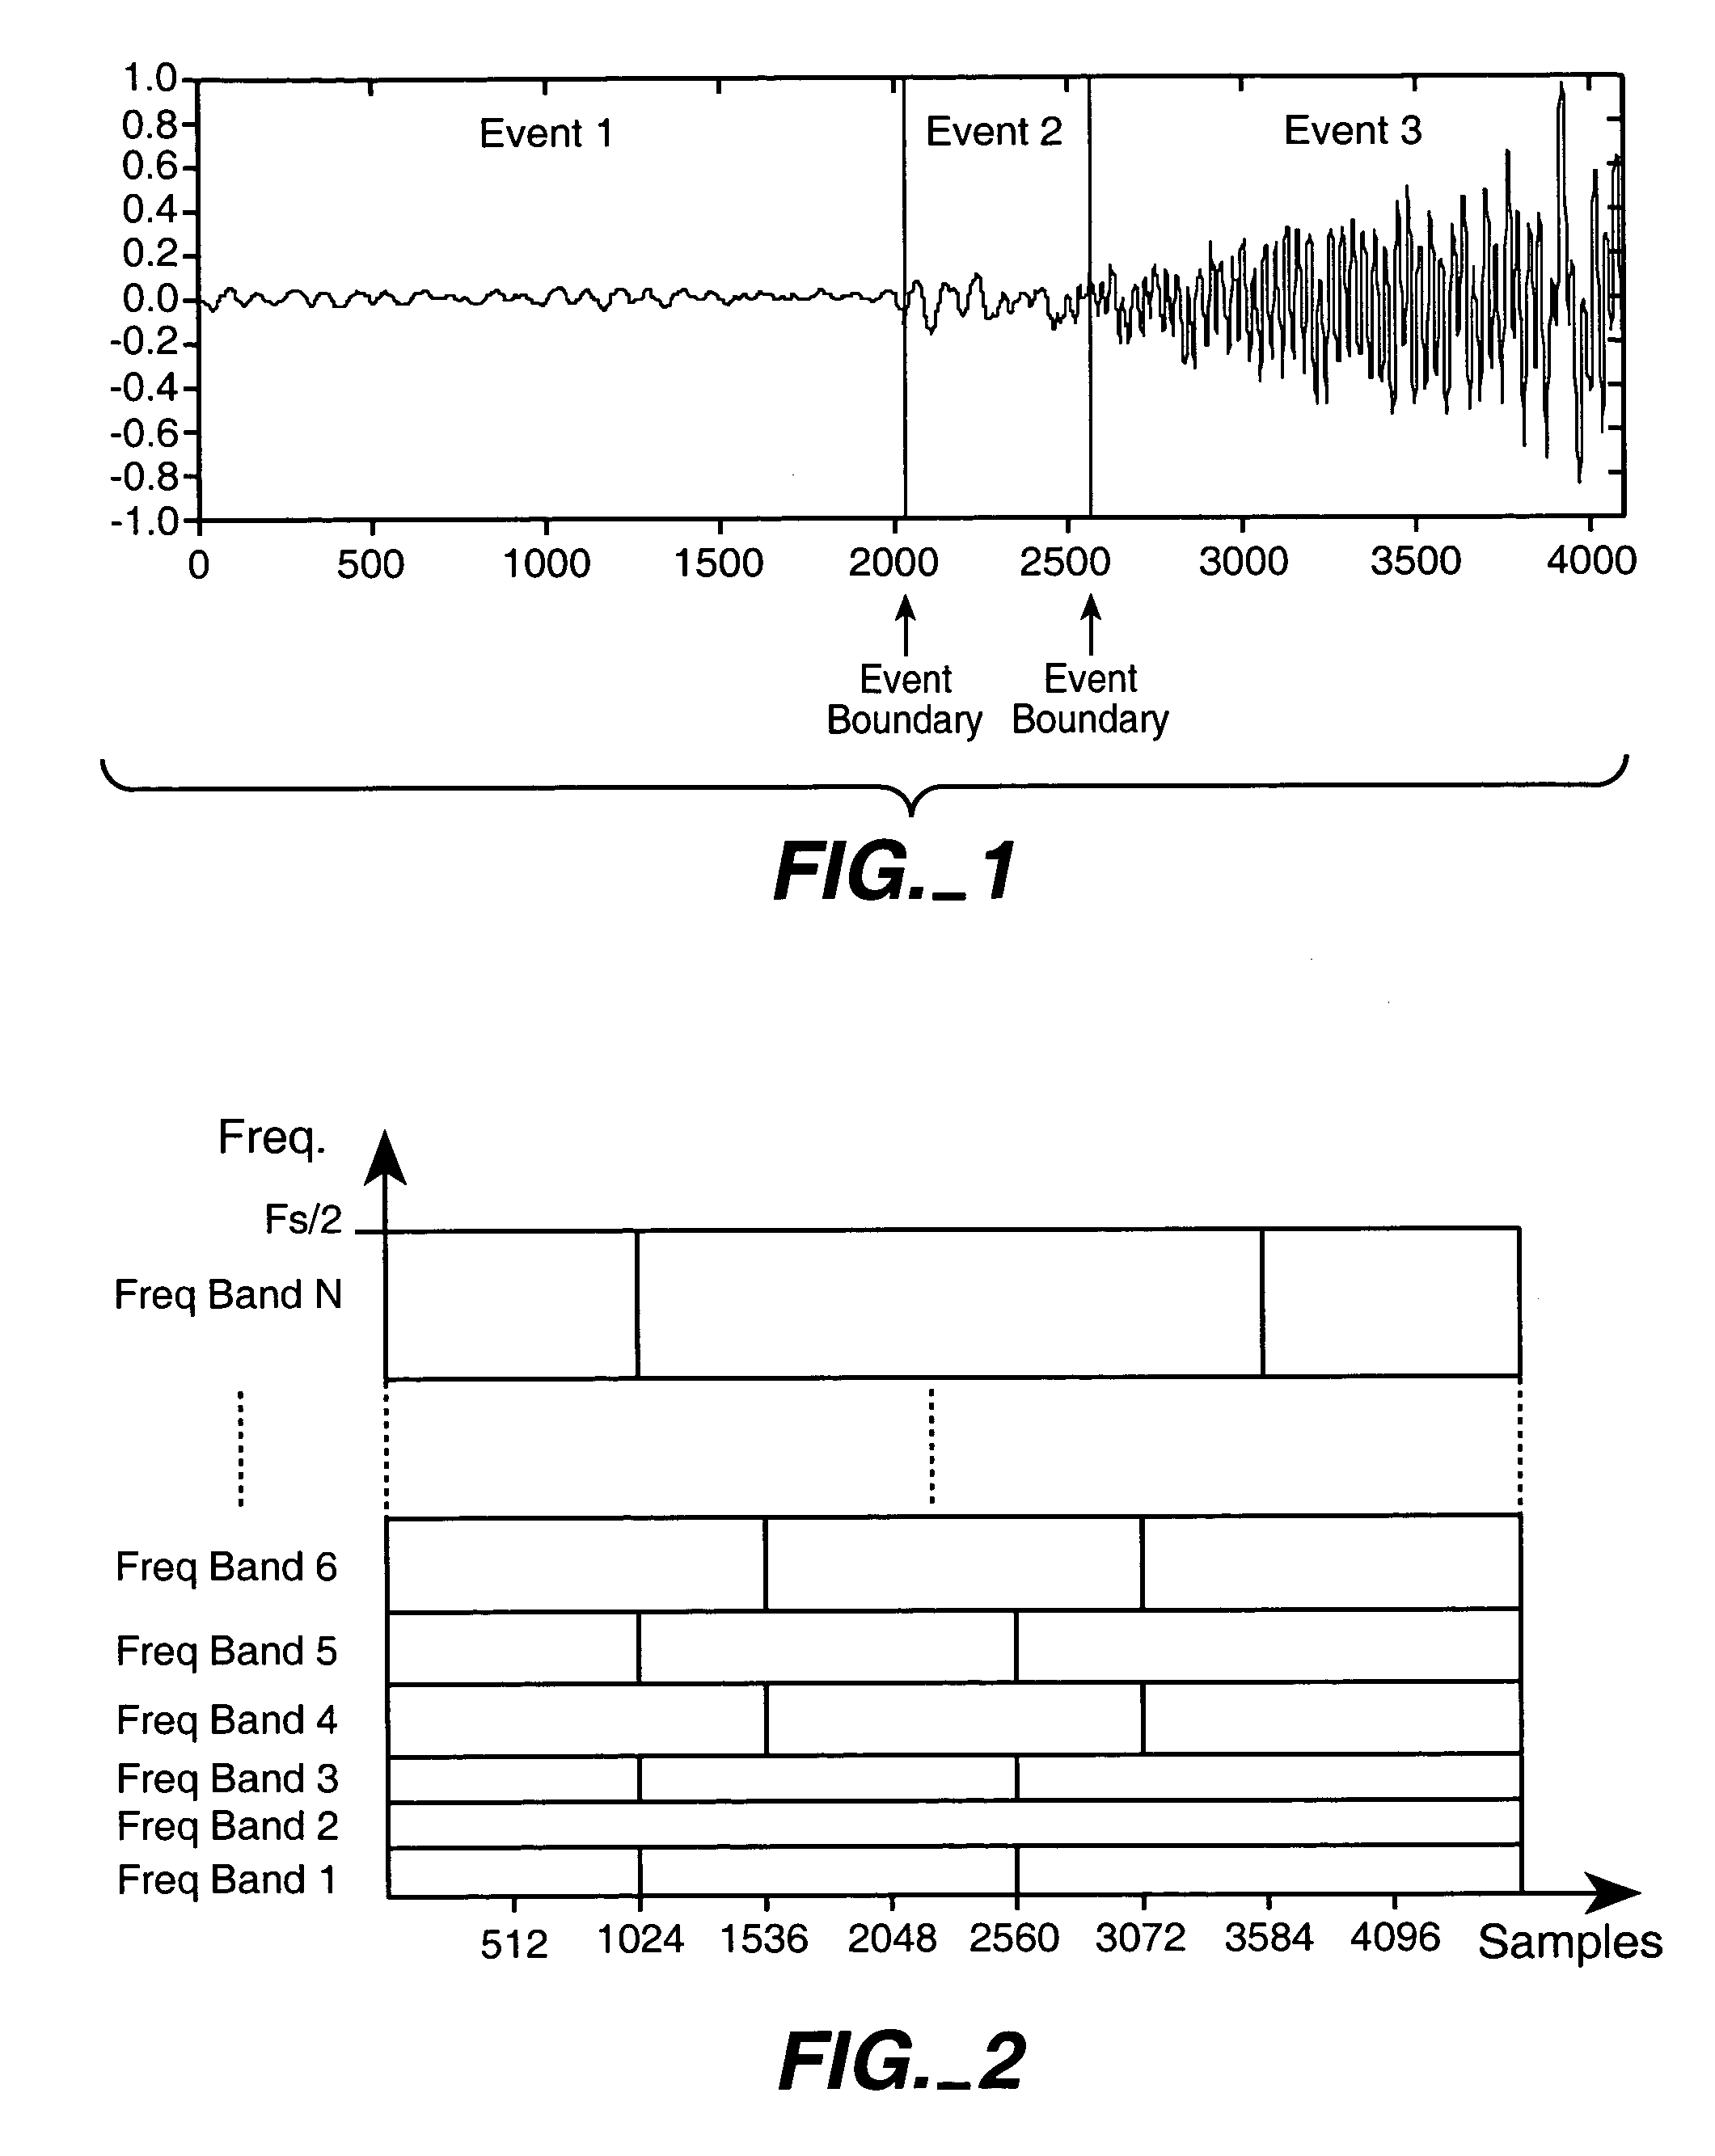
[0017]In its least computationally demanding implementation, the process divides audio into time segments by analyzing the entire frequency band (full bandwidth audio) or substantially the entire frequency band (in practical implementations, band limiting filtering at the ends of the spectrum is often employed) and giving the greatest weight to the loudest audio signal components. This approach takes advantage of a psychoacoustic phenomenon in which at smaller time scales (20 milliseconds (ms) and less) the ear may tend to focus on a single auditory event at a given time. This implies that while multiple events may be occurring at the same time, one component tends to be perceptually most prominent and may be processed individually as though it were the only event taking place. Taking advantage of this effect also allows the auditory event detection to scale with the complexity of the audio being processed. For example, if the input audio signal being processed is a solo instrument, the audio events that are identified will likely be the individual notes being played. Similarly for an input voice signal, the individual components of speech, the vowels and consonants for example, will likely be identified as individual audio elements. As the complexity of the audio increases, such as music with a drumbeat or multiple instruments and voice, the auditory event detection identifies the “most prominent” (i.e., the loudest) audio element at any given moment.
[0021]Even a simple and computationally efficient process according to aspects of the present invention has been found usefully to identify auditory events.
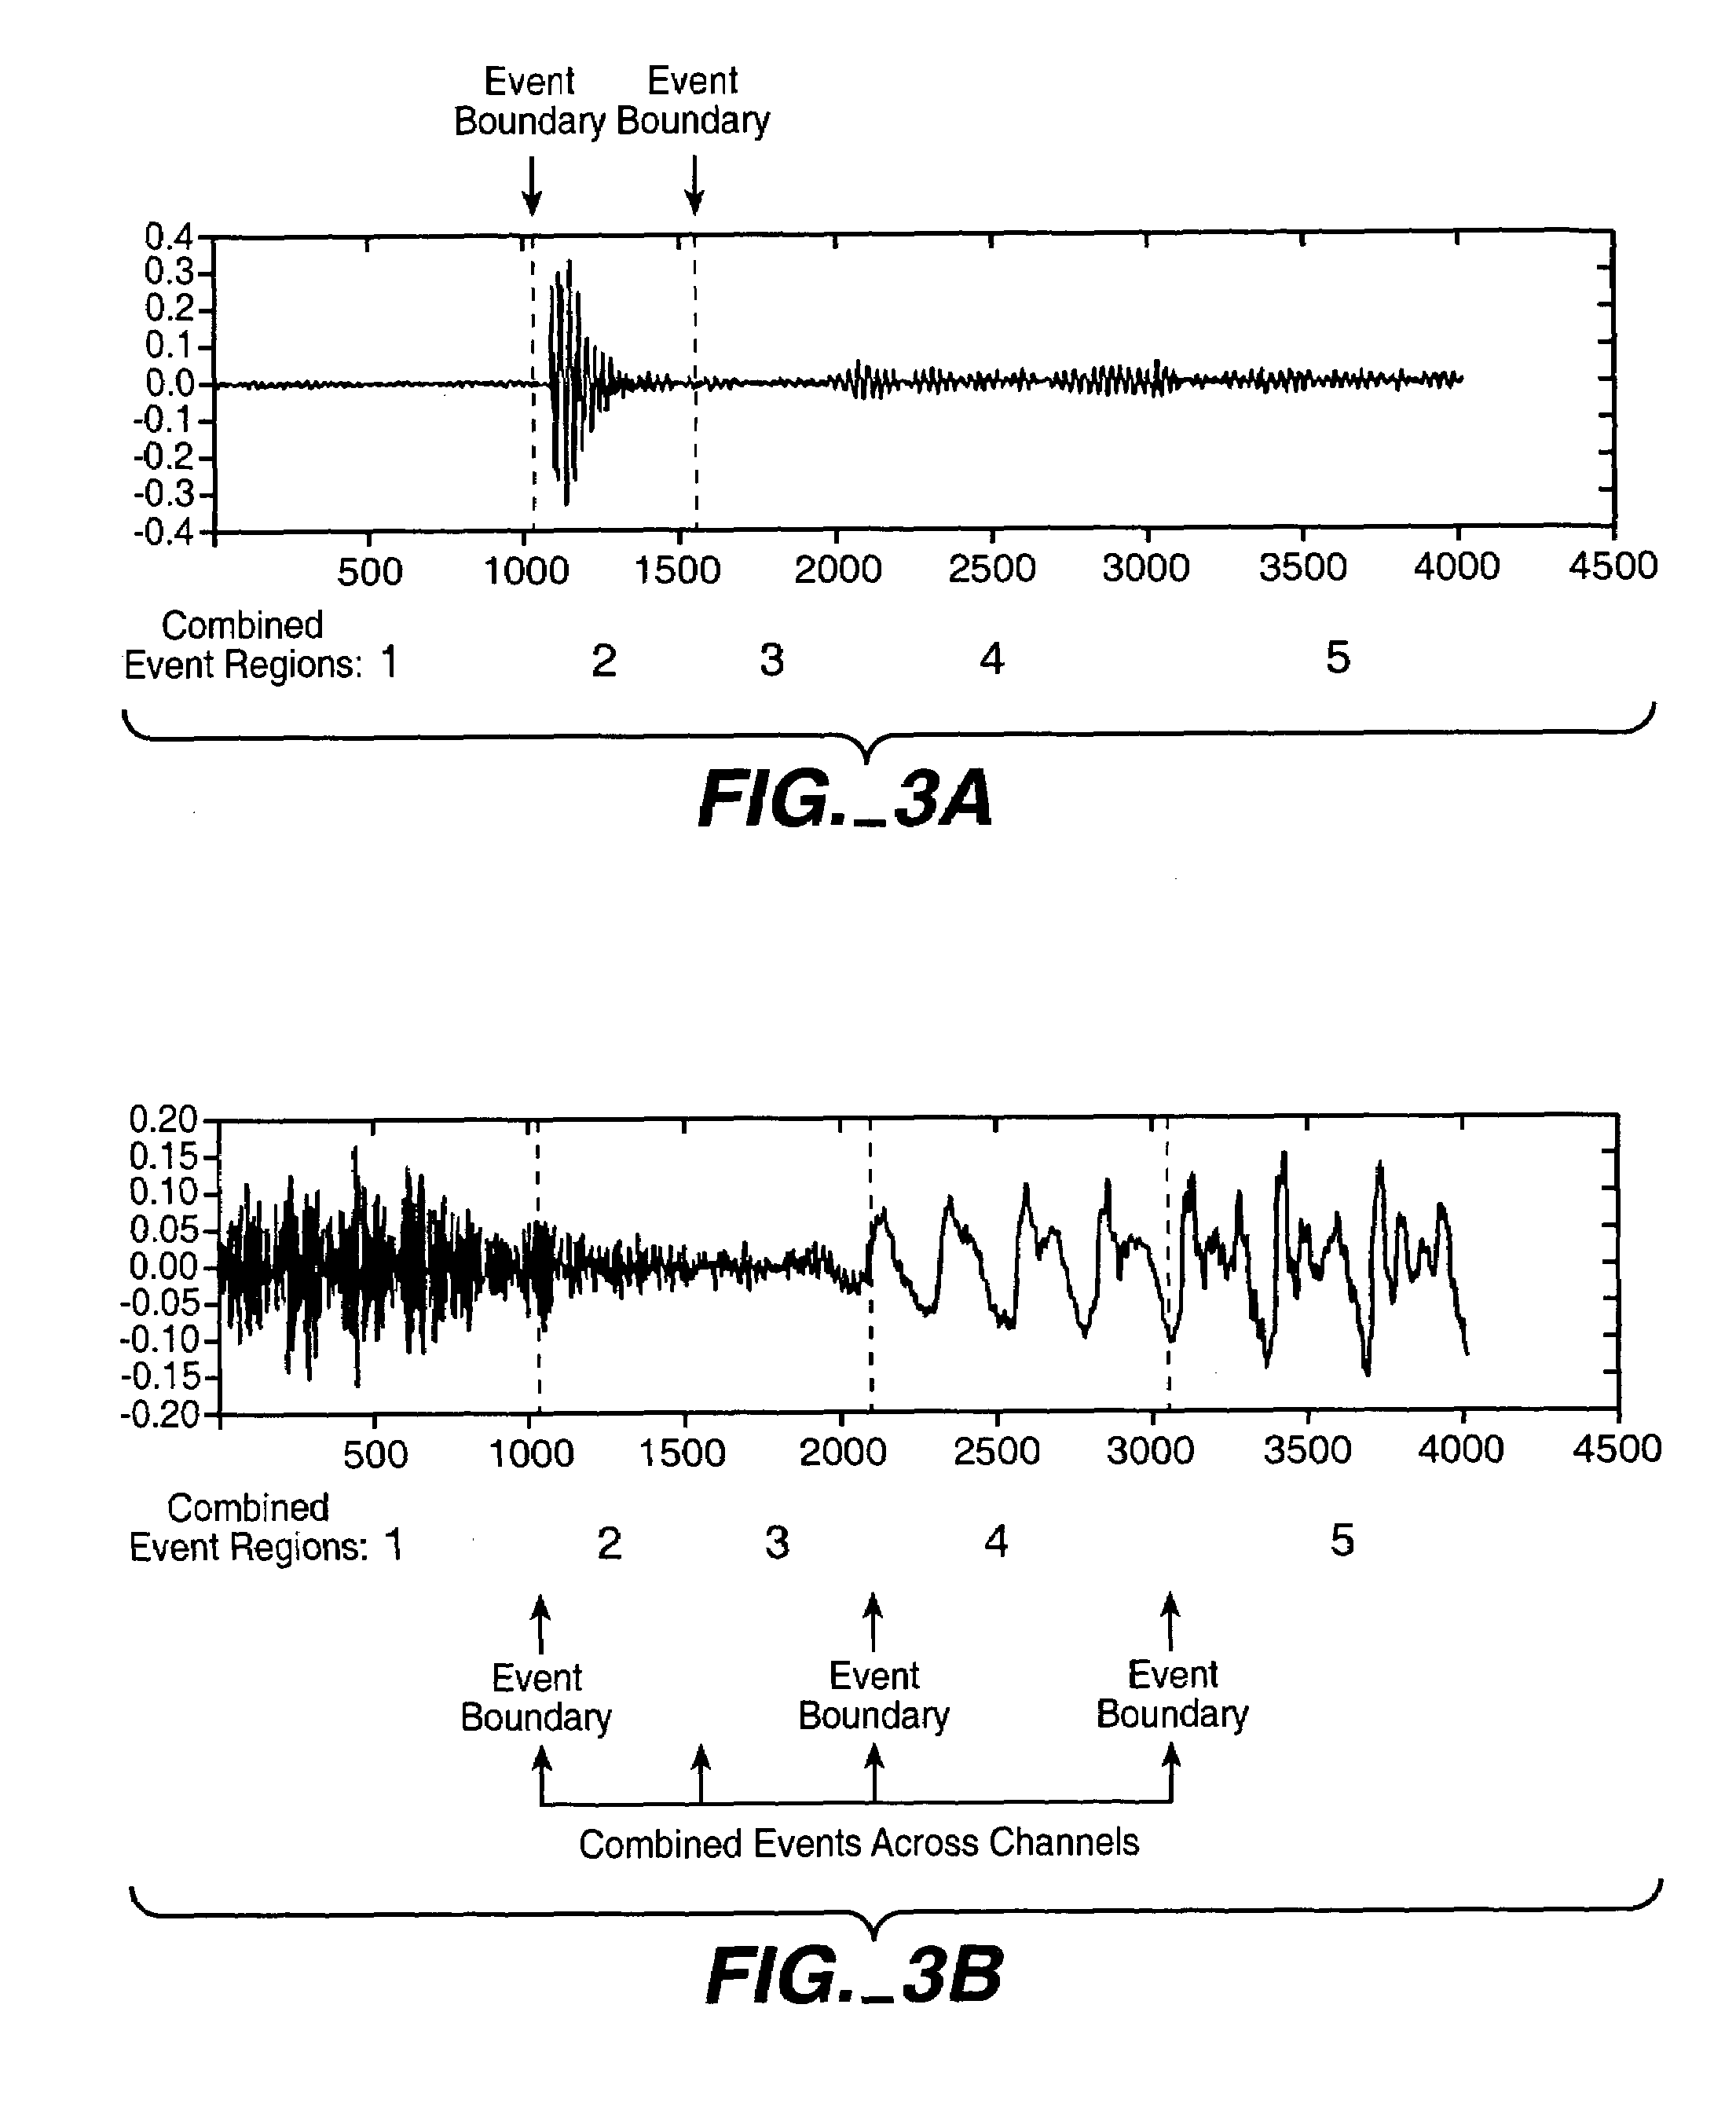
[0030]The subband auditory event information may be used to derive an auditory event signature for each subband. While this would increase the size of the audio signal's signature and possibly increase the computation time required to compare multiple signatures it could also greatly reduce the probability of falsely classifying two signatures as being the same. A tradeoff between signature size, computational complexity and signal accuracy could be done depending upon the application. Alternatively, rather than providing a signature for each subband, the auditory events may be ORed together to provide a single set of “combined” auditory event boundaries (at samples 1024, 1536, 2560, 3072 and 3584. Although this would result in some loss of information, it provides a single set of event boundaries, representing combined auditory events, that provides more information than the information of a single subband or a wideband analysis.

Problems solved by technology

In addition, U.S. Pat. No. 6,002,776 to Bhadkamkar, et al, Dec. 14, 1999 cites publications dating back to 1976 as “prior art work related to sound separation by auditory scene analysis.” However, the Bhadkamkar, et al patent discourages the practical use of auditory scene analysis, concluding that “[t]echniques involving auditory scene analysis, although interesting from a scientific point of view as models of human auditory processing, are currently far too computationally demanding and specialized to be considered practical techniques for sound separation until fundamental progress is made.”
Such parameters, while providing useful information, do not analyze and characterize audio signals into elements perceived as separate and distinct according to human cognition.

Method used


Image

  • Segmenting audio signals into auditory events
  • Segmenting audio signals into auditory events
  • Segmenting audio signals into auditory events

Examples


Embodiment Construction

[0045]In accordance with an embodiment of one aspect of the present invention, auditory scene analysis is composed of three general processing steps as shown in a portion of FIG. 5. The first step 5-1 (“Perform Spectral Analysis”) takes a time-domain audio signal, divides it into blocks and calculates a spectral profile or spectral content for each of the blocks. Spectral analysis transforms the audio signal into the short-term frequency domain. This can be performed using any filterbank, either based on transforms or banks of bandpass filters, and in either linear or warped frequency space (such as the Bark scale or critical band, which better approximate the characteristics of the human ear). With any filterbank there exists a tradeoff between time and frequency. Greater time resolution, and hence shorter time intervals, leads to lower frequency resolution. Greater frequency resolution, and hence narrower subbands, leads to longer time intervals.

[0046]The first step, illustrated c...


PUM


Abstract

In one aspect, the invention divides an audio signal into auditory events, each of which tends to be perceived as separate and distinct, by calculating the spectral content of successive time blocks of the audio signal (5-1), calculating the difference in spectral content between successive time blocks of the audio signal (5-2), and identifying an auditory event boundary as the boundary between successive time blocks when the difference in the spectral content between such successive time blocks exceeds a threshold (5-3). In another aspect, the invention generates a reduced-information representation of an audio signal by dividing an audio signal into auditory events, each of which tends to be perceived as separate and distinct, and formatting and storing information relating to the auditory events (5-4). Optionally, the invention may also assign a characteristic to one or more of the auditory events (5-5).

Description

CROSS-REFERENCES TO RELATED APPLICATIONS AND PATENTS[0001]The present application is related to United States Non-Provisional Patent Application Ser. No. 10 / 474,387, entitled “High Quality Time-Scaling and Pitch-Scaling of Audio Signals,” by Brett Graham Crockett, filed Oct. 7, 2003, published as US 2004 / 0122662 on Jun. 24, 2004, The PCT counterpart application was published as WO 02 / 084645 A2 on Oct. 24, 2002.[0002]The present application is also related to United States Non-Provisional Patent Application Ser. No. 10 / 476,347, entitled “Improving Transient Performance of Low Bit Rate Audio Coding Systems by Reducing Pre-Noise,” by Brett Graham Crockett, filed Oct. 28, 2003, published as US 2004 / 0133423 on Jul. 8, 2004, now U.S. Pat. No. 7,313,519. The PCT counterpart application was published as WO 02 / 093560 on Nov. 21, 2002.[0003]The present application is also related to United States Non-Provisional Patent Application Ser. No. 10 / 478,397, entitled “Comparing Audio Using Character...

Claims


Application Information

Patent Timeline
Patent Type & Authority Patents(United States)
IPC IPC(8): H04R29/00G06F17/00H04B15/00H04B3/00G10L17/00H04N5/04H04N5/60
CPCG10L15/04G10L17/26H04N5/60H04R29/00H04N5/04G10L19/0204G10L19/025
Inventor CROCKETT, BRETT G.
Owner DOLBY LAB LICENSING CORP
Learn More