Method for the determination of local similitude from seismic 3d measured data

a technology of measured data and local similitude, which is applied in the field of method for the determination of local similitude from seismic 3d measured data, can solve the problems of large computer resources and software, reduce resolution, and limit the comparison to neighbor traces that are not suitable for detection, so as to improve the analysis result and influence the effect of results

Inactive Publication Date: 2006-01-17
TRAPPE HENNING
View PDF10 Cites 39 Cited by
  • Summary
  • Abstract
  • Description
  • Claims
  • Application Information

AI Technical Summary

Benefits of technology

[0045]By using a weight function that decays with distance (d) from the analysis point up to infinity, especially by using d−c, e−cd, e−cdd with c=arbitrary constant, and by setting the weight to zero beyond a maximum distance (dmax) from the analysis point, the calculation effort for functions that decay for an infinite distance range, is limited as well. At the maximum distance from the analysis point, the transition to the weight factor zero can be smoothed, e.g. by an additional linear transition function, in order to reduce edge effects in the calculation of similarity values.
[0049]If the analysis interval between neighboring analysis points in the 3-D dataset is selected as a multiple, and especially as an integer multiple of the data point interval, preferably between one and several tens, especially preferred between three and ten such data point intervals, the computation time can be significantly reduced, since a similarity measurement must not be performed for every sample position. The selection of the analysis points is defined by lateral and vertical analysis intervals. These analysis intervals are preferably integer multiples of the data point intervals, i.e., the sample intervals. However, rational multiples are as well possible, requiring an assignment of interpolated data values to positions that are defined between the measured data points. After calculating a similarity value and a dip with corresponding azimuth at an analysis point, the used weighted environment is centered at the analysis point that is next according to the pre-defined analysis interval. For environments with a large spatial extension, large analysis intervals between neighboring analysis points can generally be used in order to reduce the computation effort, without deteriorating the resolution.
[0053]Preferably, the representative attribute is the weighted median of the attributes to be analyzed. The application of the weighted median of the amplitude (the attribute) implies a sorting out of single strong spikes and noise amplitude, which in case of the semblance can have a strong influence on the result. This sorting-out improves the analysis result.

Problems solved by technology

These processes require large computer resources and software, in order to process and correct the recorded signal.
Large time windows have to be chosen in order to obtain stable results, thus reducing the resolution.
The limitation of the comparison to neighbor traces is not suited to detect gradual changes of the seismic behavior, which extend over distances of the order of many trace intervals, and where the change in the range of one trace interval is below the noise level of the data.
The radial grid is hereof regarded as disadvantageous.
If the directions of geologic strike, which are assumed during the dip dependent similarity measurements, vary with respect to the direction of preference of the cell, this may be disadvantageous, since the direction of largest continuity in geological bodies often has a relation to the direction of geological strike.
However, here it is possible that the measured similarity values render a distorted view of the exising dip dependence in the data, since the measurement renders systematically increased, or decreased similarity for some azimuth ranges due to the orientation of the analysis cell.
Moreover it is disadvantageous, that the Hilbert transformed imaginary trace must be calculated for each real trace within the calculation of similarity with consideration of dip and dip azimuth.
This additionally requires significant calculation capacities.
This means, that all methods cannot the take into account the degree of spatial continuity of geological bodies, as it is derived e.g. by variographic analysis, since neighborhood relations are not weighted.

Method used


Image

  • Method for the determination of local similitude from seismic 3d measured data
  • Method for the determination of local similitude from seismic 3d measured data
  • Method for the determination of local similitude from seismic 3d measured data

Examples


Embodiment Construction

[0061]First, the basis for calculation and data evaluation according to the invention is described in the following.

Weight Function

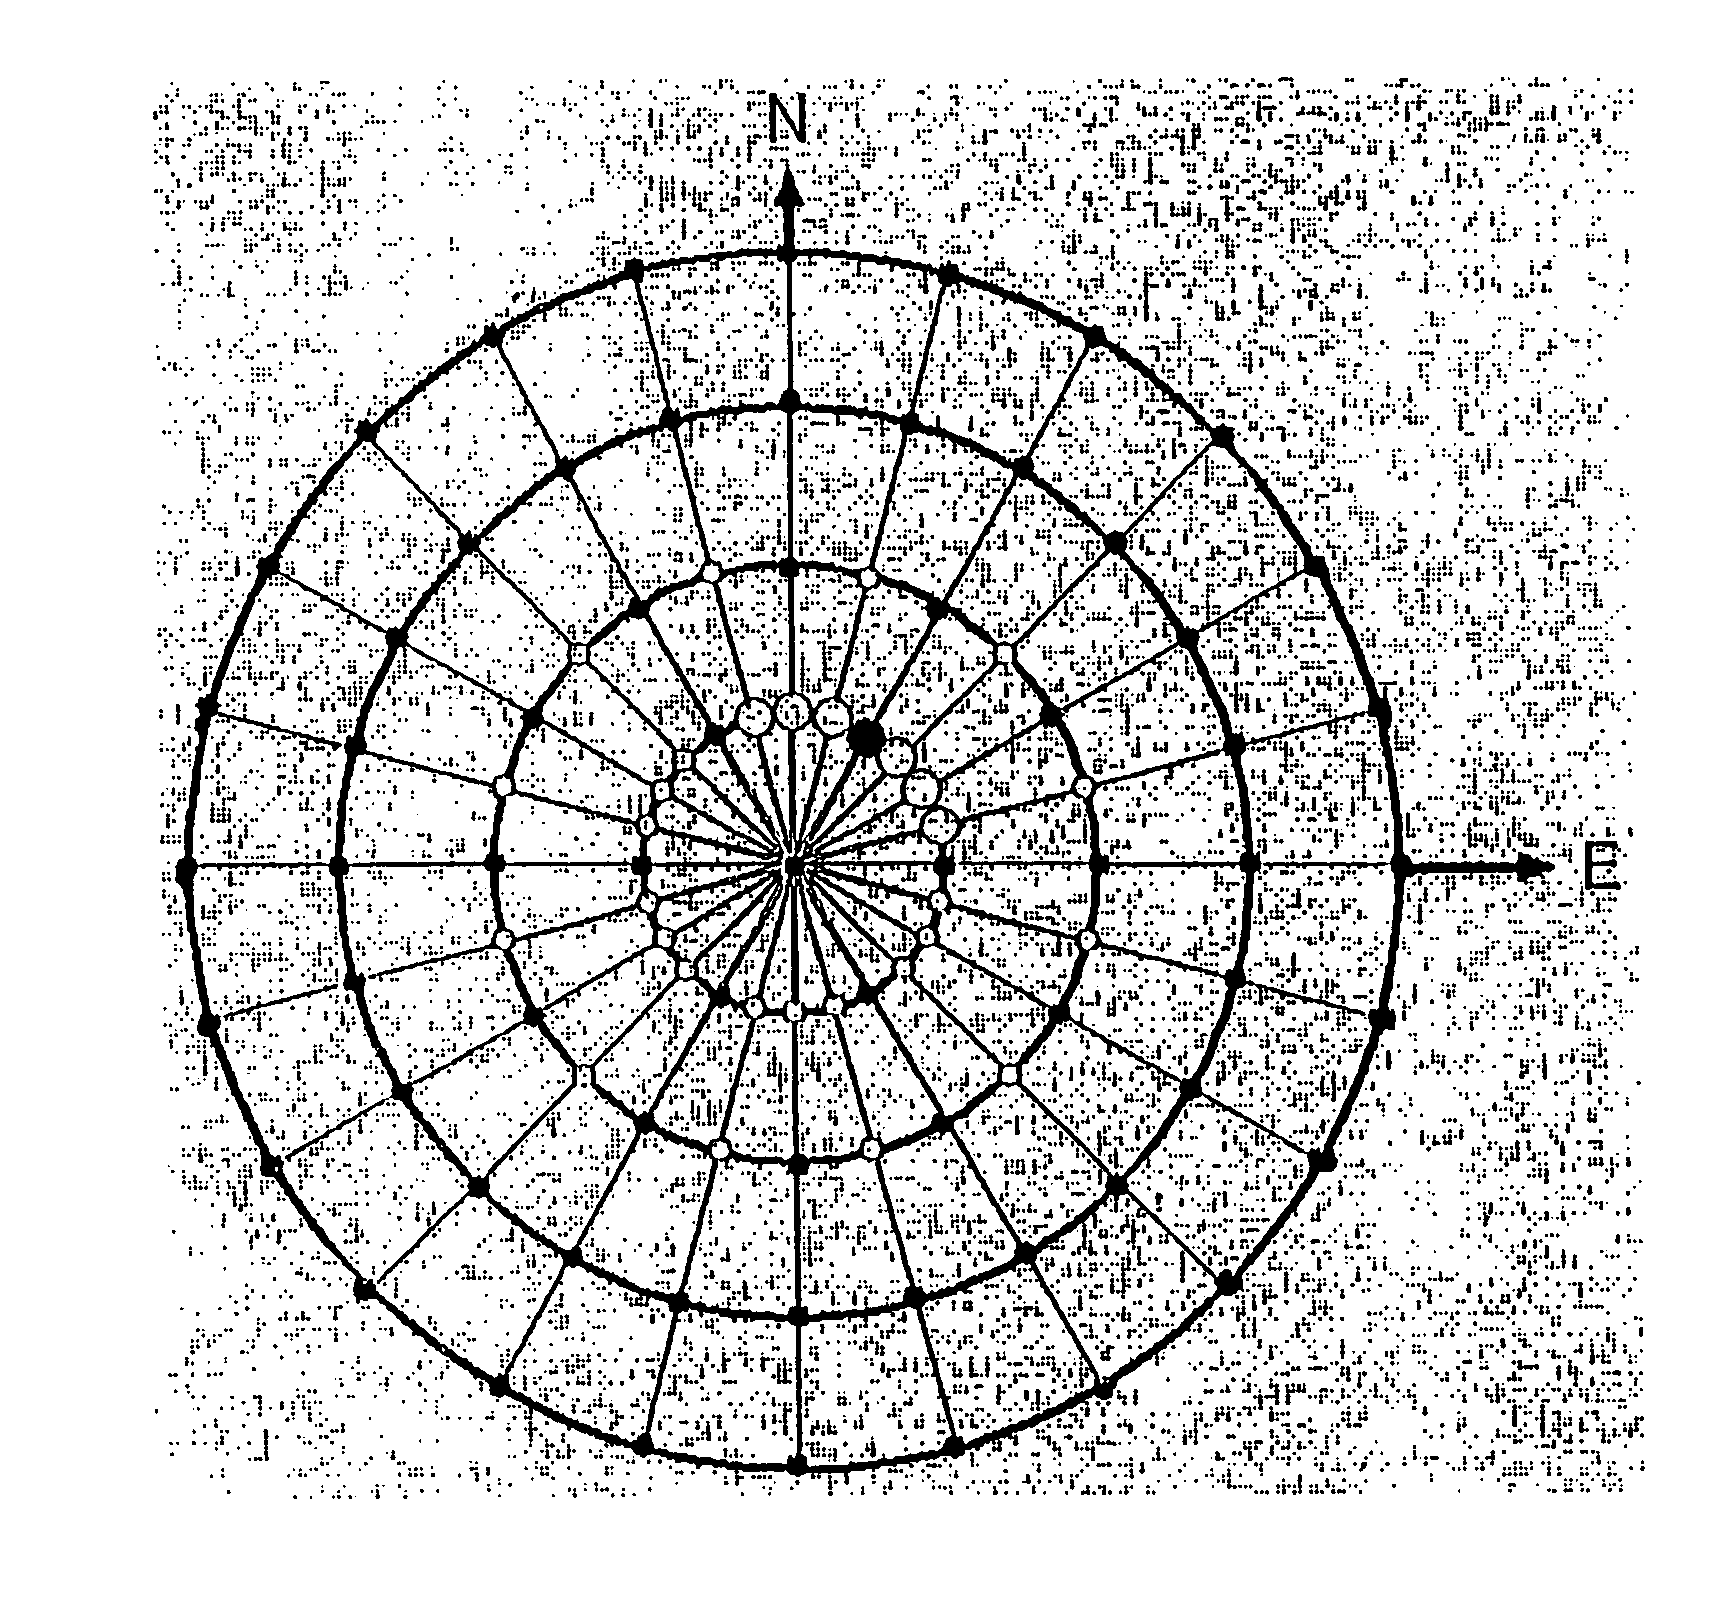
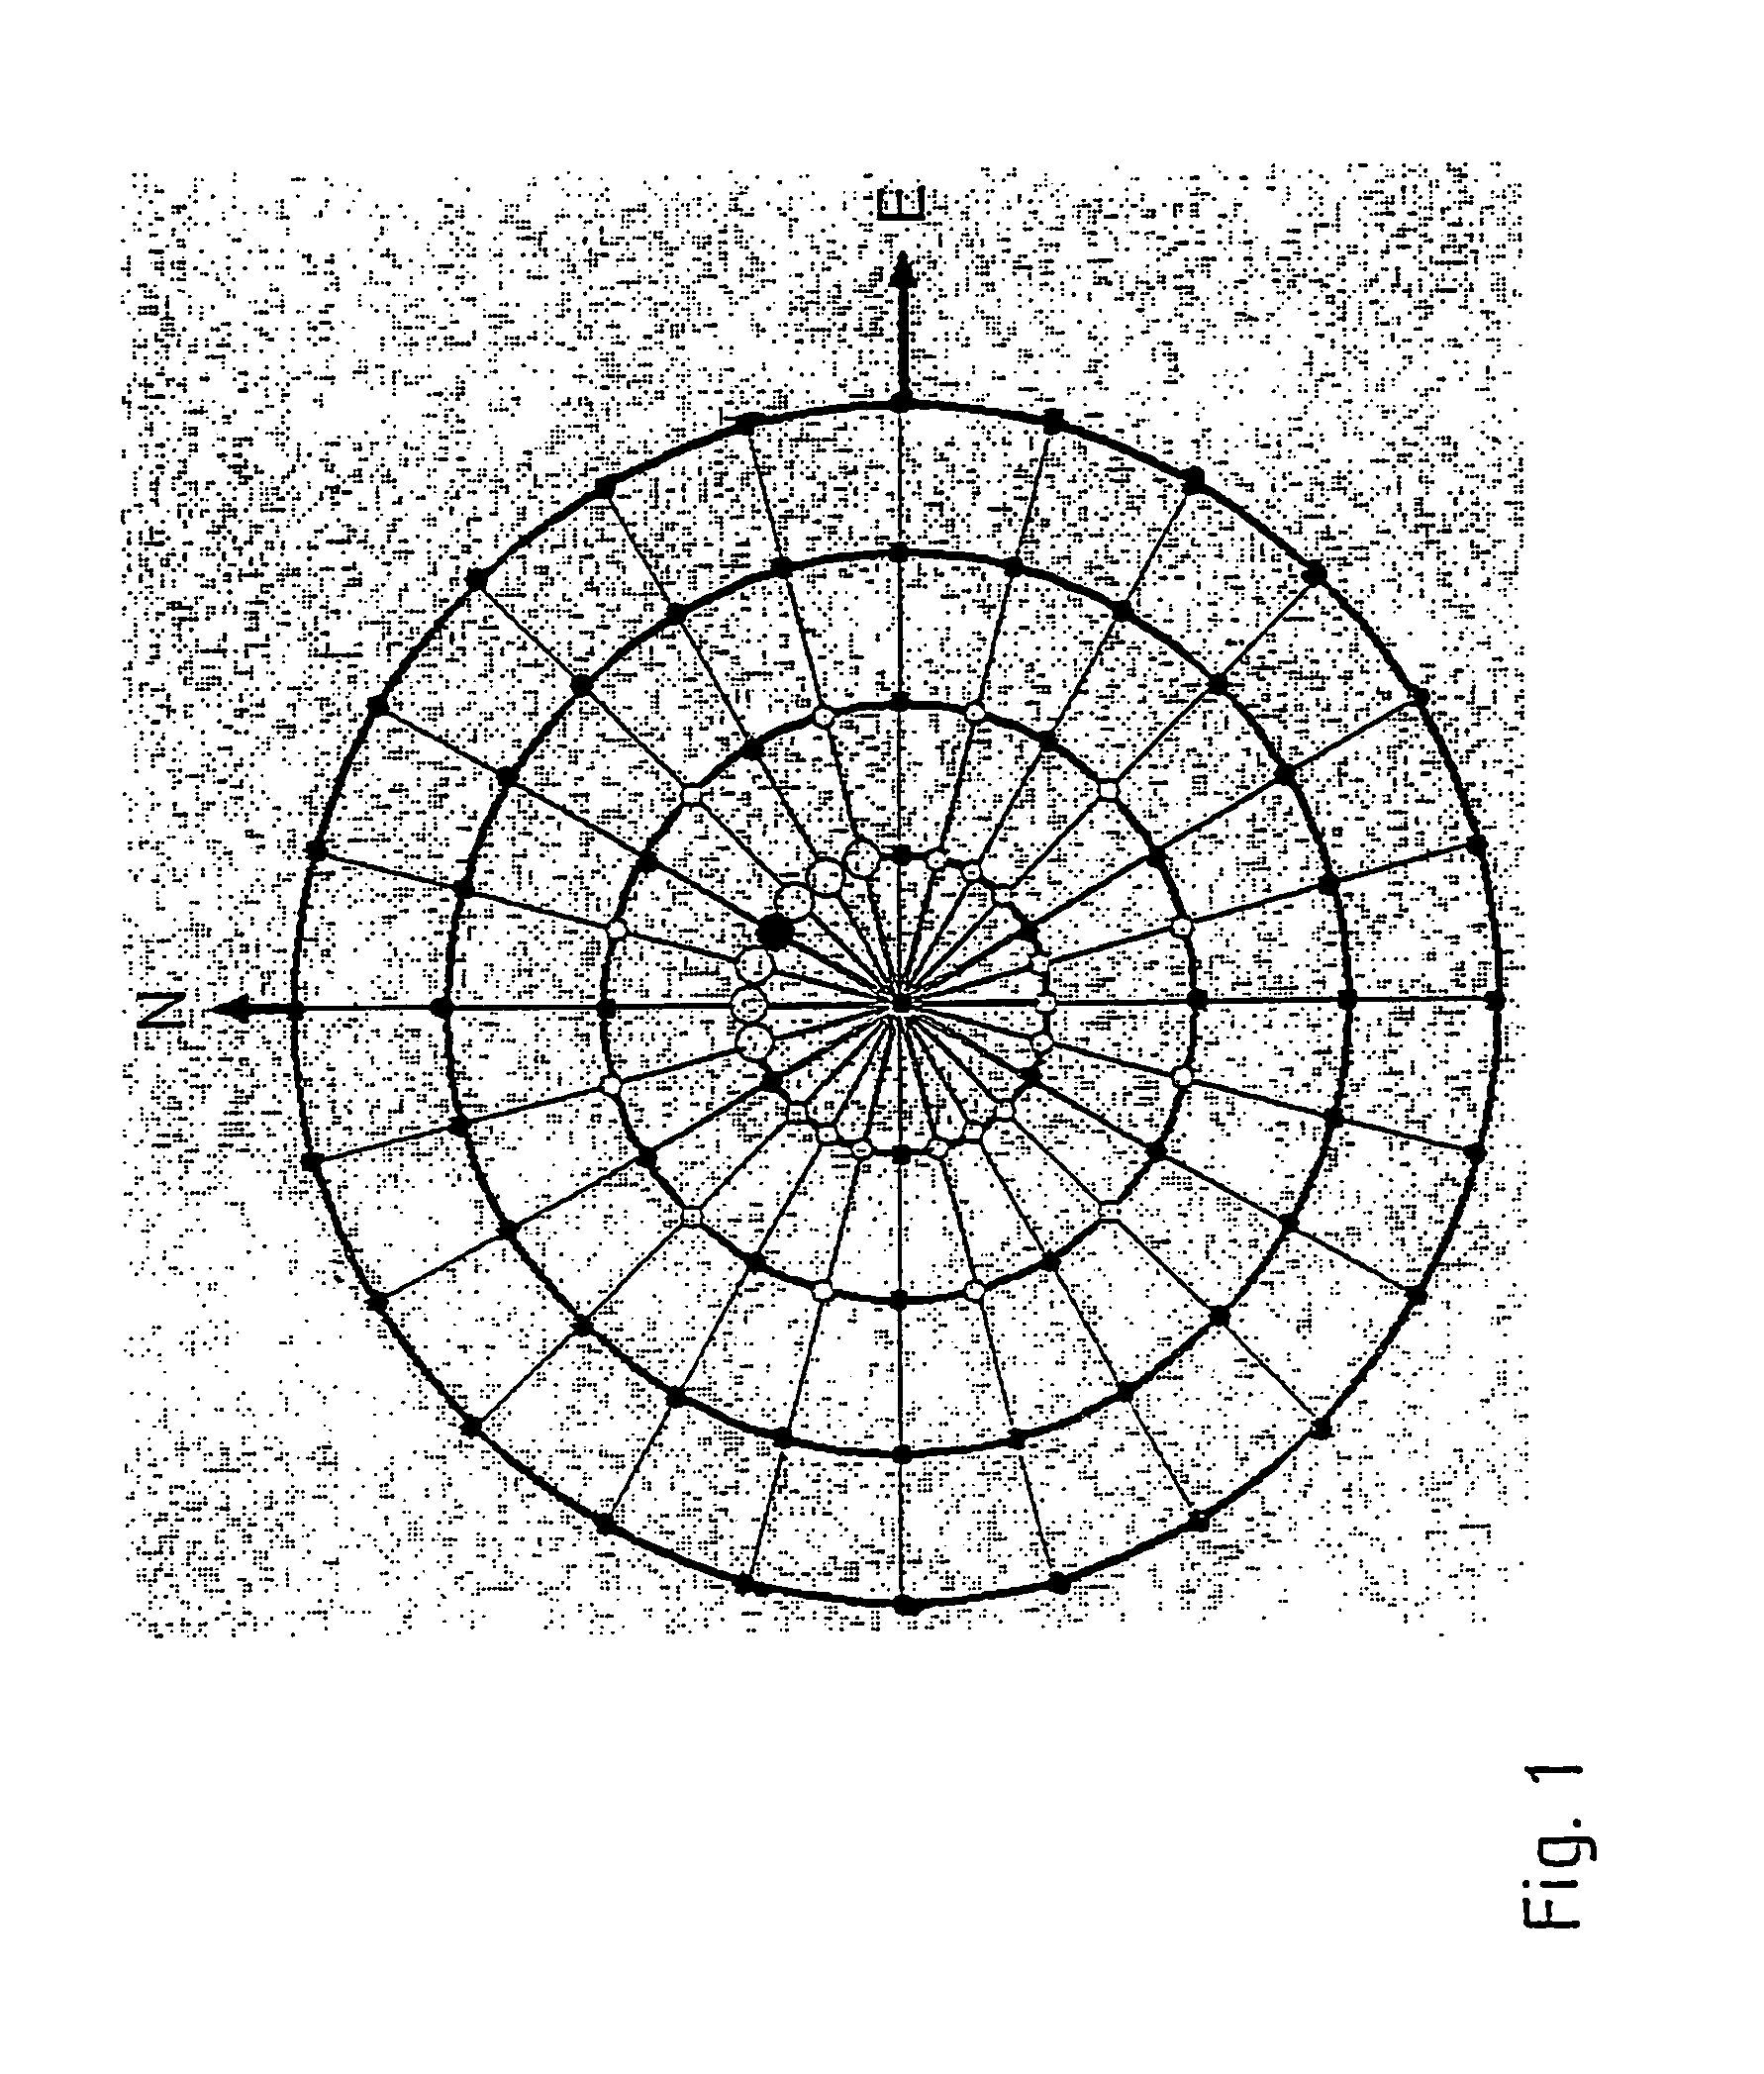
[0062]Around each analysis position (xI,yJ,zK) that is selected for the calculation of a similarity value, a three-dimensional environment is defined by a weight function

gIJK(xi,yj,zk)=g(xi−xI,yj−yJ,zk−zK).  (1)

[0063]This weight function contains arbitrary values g(x,y,z)>0 in a three-dimensional environment of arbitrary shape and arbitrary extent, around the co-ordinate origin (x,y,z)=(0,0,0), and it contains values g(x,y,z)=0 outside this environment. It contains the weights, which are imposed on the seismic data values located in the environment, when they are entered into the calculation of a similarity value at the selected analysis location (xI,yJ,zK).

[0064]This function can e.g. exhibit decaying weights at the edge of the environment, and thus reduce edge effects in the calculation of similarity values. Just as well, a stronger weighting of the va...


PUM


Abstract

The invention concerns a method for the determination of local similarity values for geological units in the subsurface from a seismic 3-D dataset, which consists of a multitude of traces, each of which being formed by a sequence of data points that carry amplitude values, and especially a method for the determination of local dip-dependent similarity values, in each weighted environment of an analysis point, determining the maximum similarity value, which is assigned, together with the corresponding dip angle and dip azimuth, to the respective analysis point.

Description

CROSS REFERENCE TO RELATED APPLICATION[0001]This application is a national stage of PCT / DE02 / 02795 filed Jul. 31, 2002 and based upon DE 101 42 785.9 filed Aug. 31, 2001 under the International Convention.BACKGROUND OF THE INVENTION[0002]1. Field of Invention[0003]The invention concerns a method for the determination of local similarity of geological units in the subsurface from a seismic 3-D dataset, which consists of a multitude of traces, each of which being formed by a sequence of data points that carry amplitude values, or seismic attributes derived therefrom.[0004]2. Related Art of the Invention[0005]Seismic reconnaissance methods are used worldwide in order to obtain additional knowledge on the distribution of geological structures in the subsurface, in addition to the information from drilled wells. The information from seismic data often allows to renounce on further reconnaissance wells, or to reduce their number to a minimum.[0006]For the seismic reconnaissance of the sub...

Claims


Application Information

Patent Timeline
Patent Type & Authority Patents(United States)
IPC IPC(8): G01V1/28G01V1/32G06F17/18
CPCG06F17/18G01V1/32
Inventor TRAPPE, HENNINGPRUESSMANN, JUERGEN
Owner TRAPPE HENNING
Why Eureka
Try Eureka