
Method and apparatus for categorizing unexplained residuals

a residual and classification technology, applied in the field ofsignal processing, can solve the problems of low statistical confidence in the predicted model, additional noise, and typical contain noise, and achieve the effect of reducing computational processing and being easy to interpr

Active Publication Date: 2005-11-01
HARRIS CORP
View PDF17 Cites 7 Cited by
  • Summary
  • Abstract
  • Description
  • Claims
  • Application Information

AI Technical Summary

Benefits of technology

[0013]Another object of the present invention is to reduce the computational processing associated with the analysis of signal residuals.
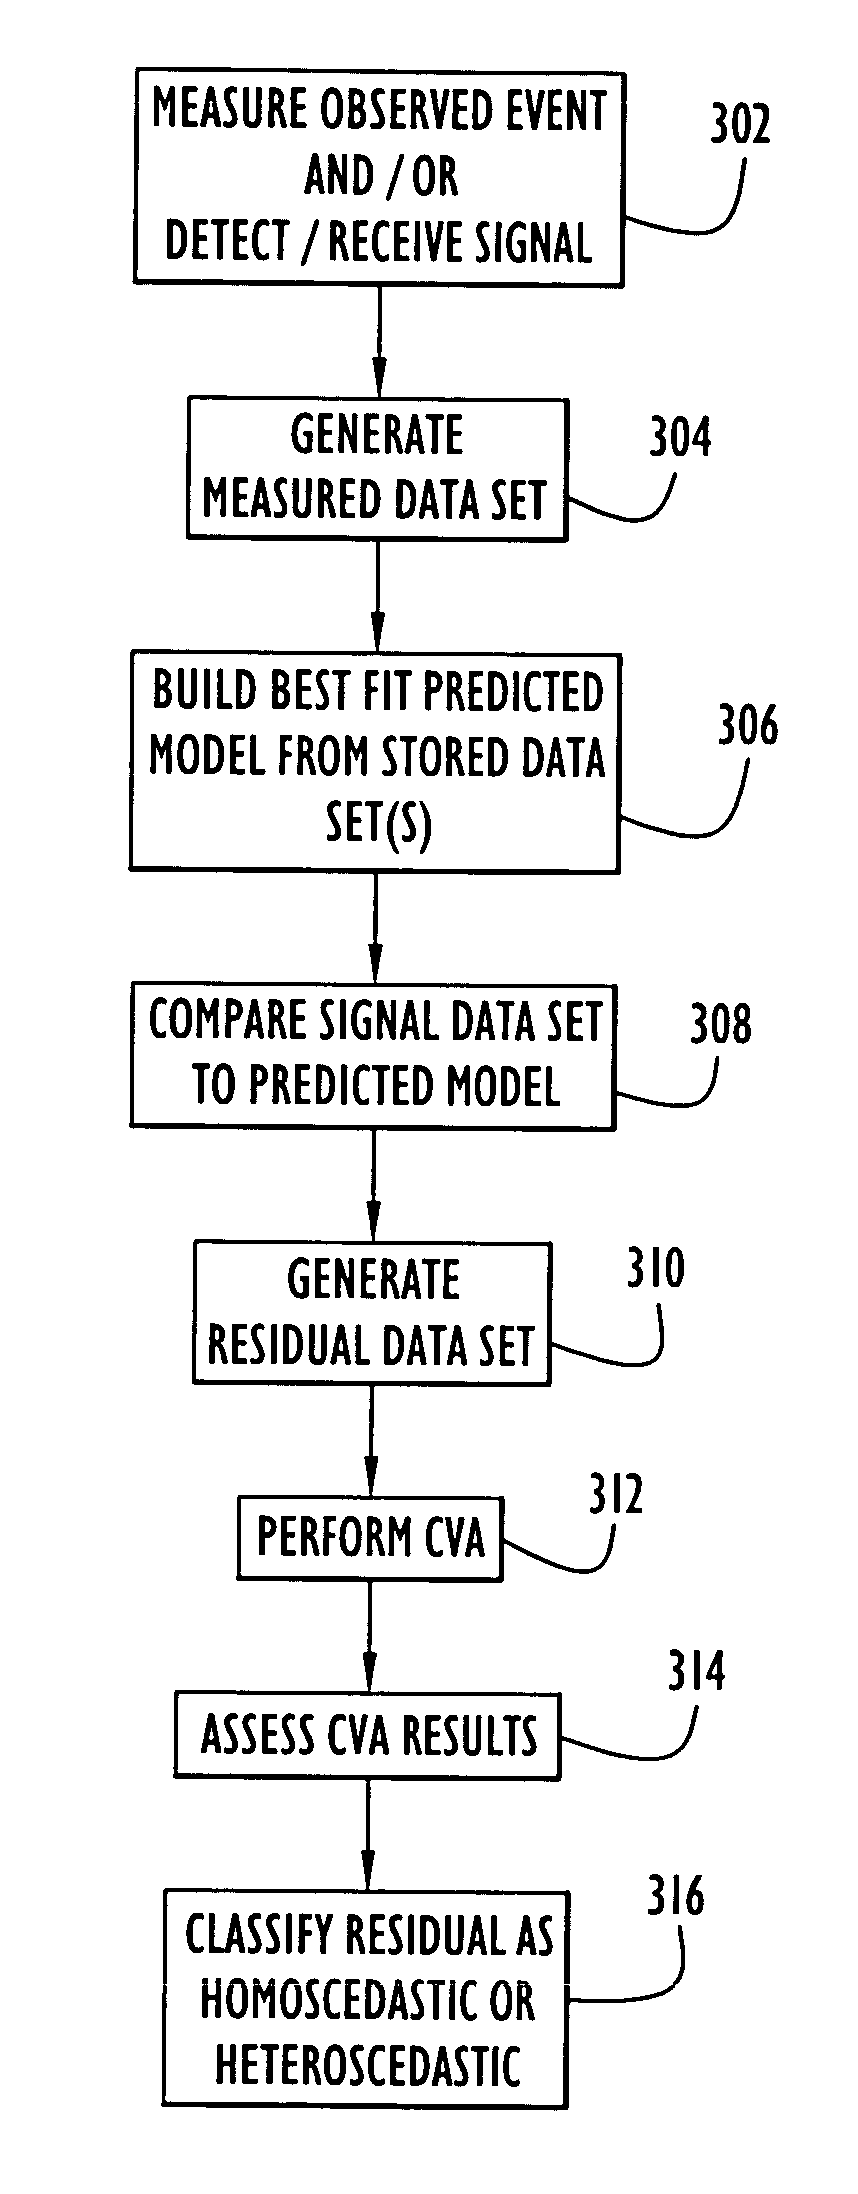
[0020]The CVA output matrix (or vector) can be interpreted visually by a technician and / or using an automatic numerical analysis tool. Whether assessing the CVA output visually or numerically, the assessment process attempts to identify significant differences in the measures of variation determined for the respective windows. For example, the magnitude of changes in the calculated measures of variation that trigger classification of a residual as heteroscedastic can be defined with respect to a threshold window size and a maximum allowed difference. If during visual or numeric assessment of the CVA output a change greater than the maximum allowed difference is detected across a set of measures of variance calculated for windows of size greater than the threshold window size, the residual data set is classified as heteroscedastic. Otherwise, the data set is characterized as homoscedastic. For example, a technician can visually interpret CVA results via direct inspection the CVA numeric output, inspection of an image plot of CVA numeric output, or inspection of output from a numerical analyzer that has further numerically processed the CVA output. The CVA enabled apparatus and method described here is compatible with any apparatus / approach that uses numerical analysis techniques, such as multiple linear regression (MLR), classical least squares (CLS), and other linear and nonlinear techniques to generate a predicted model based upon stored library components and / or mathematical models. CVA is compatible with any programming language and can be readily added to a new and / or existing apparatus to compliment existing statistical analysis of residual data sets and / or independent data sets. CVA is less complex that conventional techniques, and requires less computer processing capacity, yet results in more readily interpretable results.

Problems solved by technology

Recorded measurements, or measurement values, whether associated with an observed natural or man-made phenomenon or associated with a signal originating from a natural or man-made transmission source, typically contain noise.
Such noise is typically the result of errors introduced by measurement equipment, unknown sources of signal interference, background signals and / or a host of other unknown causes.
Measurements, or measurement values, made in a less controlled environment under less controlled, or uncontrolled, operating conditions typically include greater amounts of noise.
Such additional noise is typically the result of additional uncontrolled factors affecting the equipment used to make the measurements, additional sources of interference and / or additional unknown factors contributing to the measurement values.
Problems arise, however, in cases in which there is a high level of noise compared to the level of a measured (or received) signal, and hence, a low statistical confidence in the predicted model.
Often, it is important to determine whether a system has measured a weak signal, thereby resulting in the high noise level compared to the magnitude of the measured signal, or whether the measured signal includes contributions from an unknown signal contributor not included in the predicted model, thereby resulting in the high noise level.
Unfortunately, conventional techniques for analyzing unexplained residuals are not adequate for determining whether an unexplained residual is homoscedastic or heteroscedastic in nature or for characterizing a residual in other meaningful ways.
The CWT approach is computationally intense to compute, and application of the approach typically requires more specialized knowledge than an operator may possess.
Additionally, the diagnostics that the CWT approach generates are not easily interpretable.
Further, it is difficult to program a CWT application from scratch for use within the wide range of existing systems in which the approach could be applied.
Moreover, the output of a CWT analysis is a matrix of fitting coefficients at different scales, which is not useful for numerical analysis or automatic decision making, since the coefficients are ambiguous with regard to their discrimination between heteroscedastic signals and homoscedastic signals and the coefficients are not associated with any qualitative characteristics.

Method used


Image

  • Method and apparatus for categorizing unexplained residuals
  • Method and apparatus for categorizing unexplained residuals
  • Method and apparatus for categorizing unexplained residuals

Examples


Embodiment Construction

[0042]Preferred embodiments according to the present invention are described below with reference to the above drawings, in which like reference numerals designate like components.

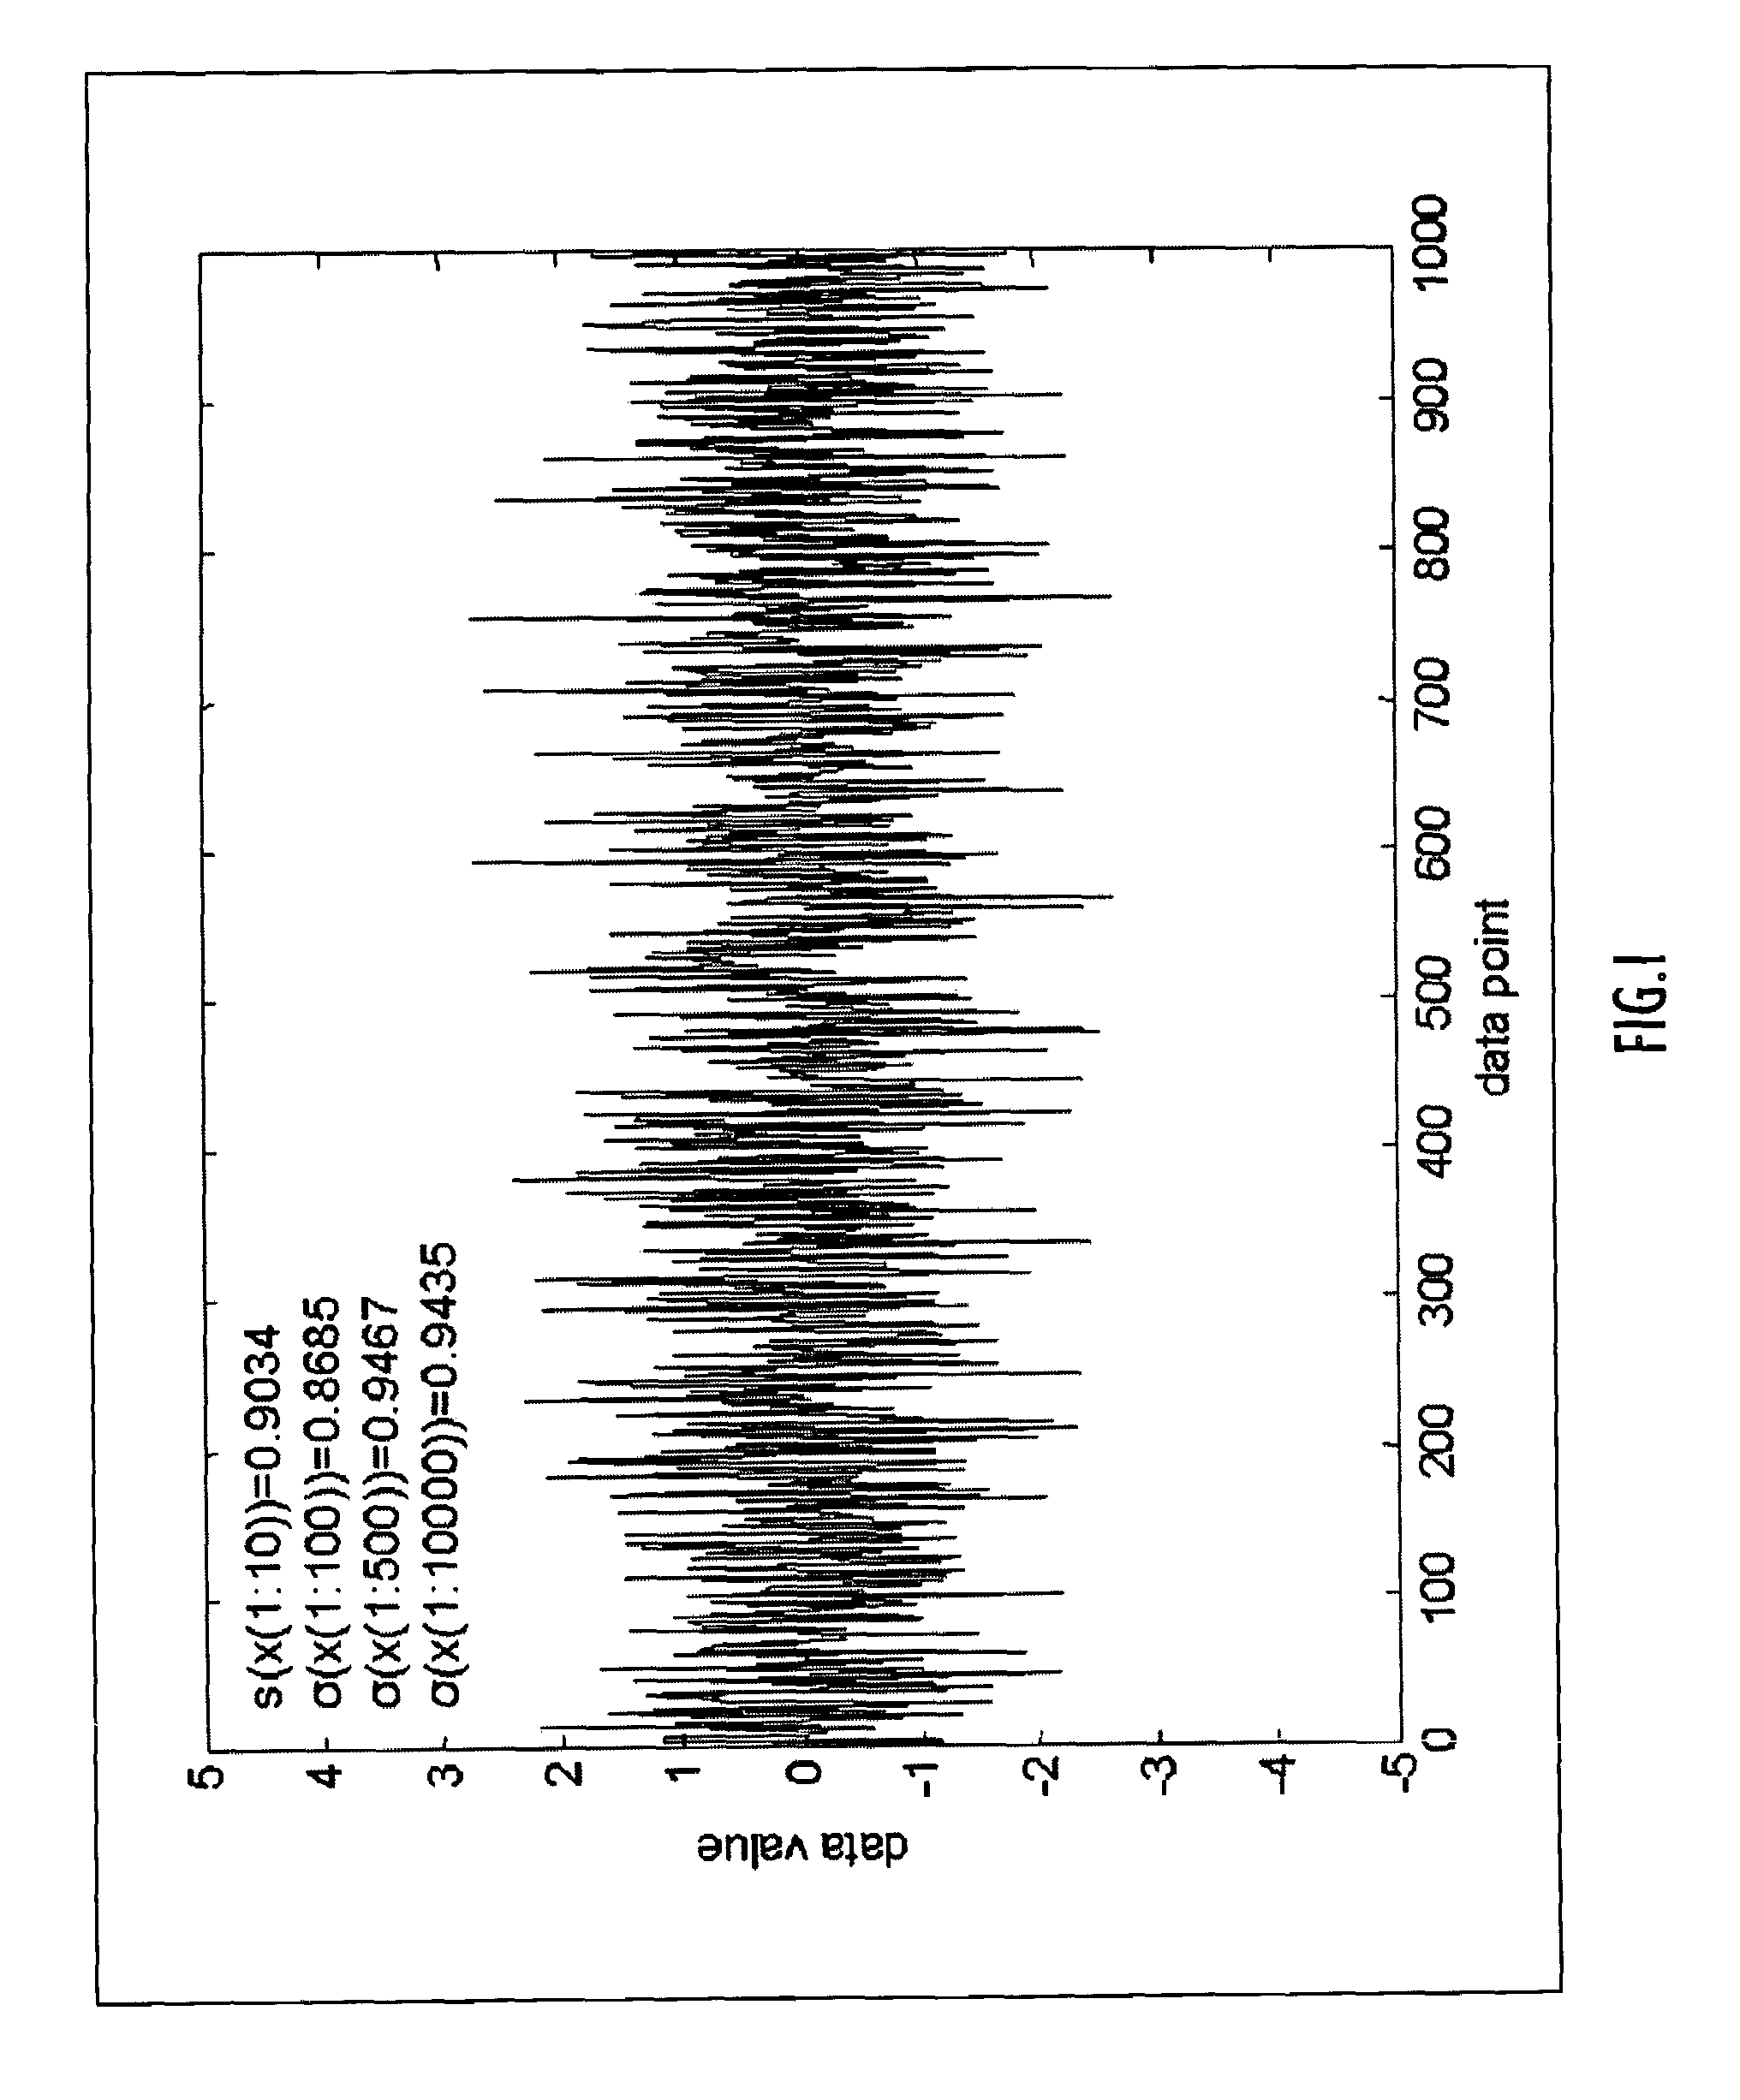
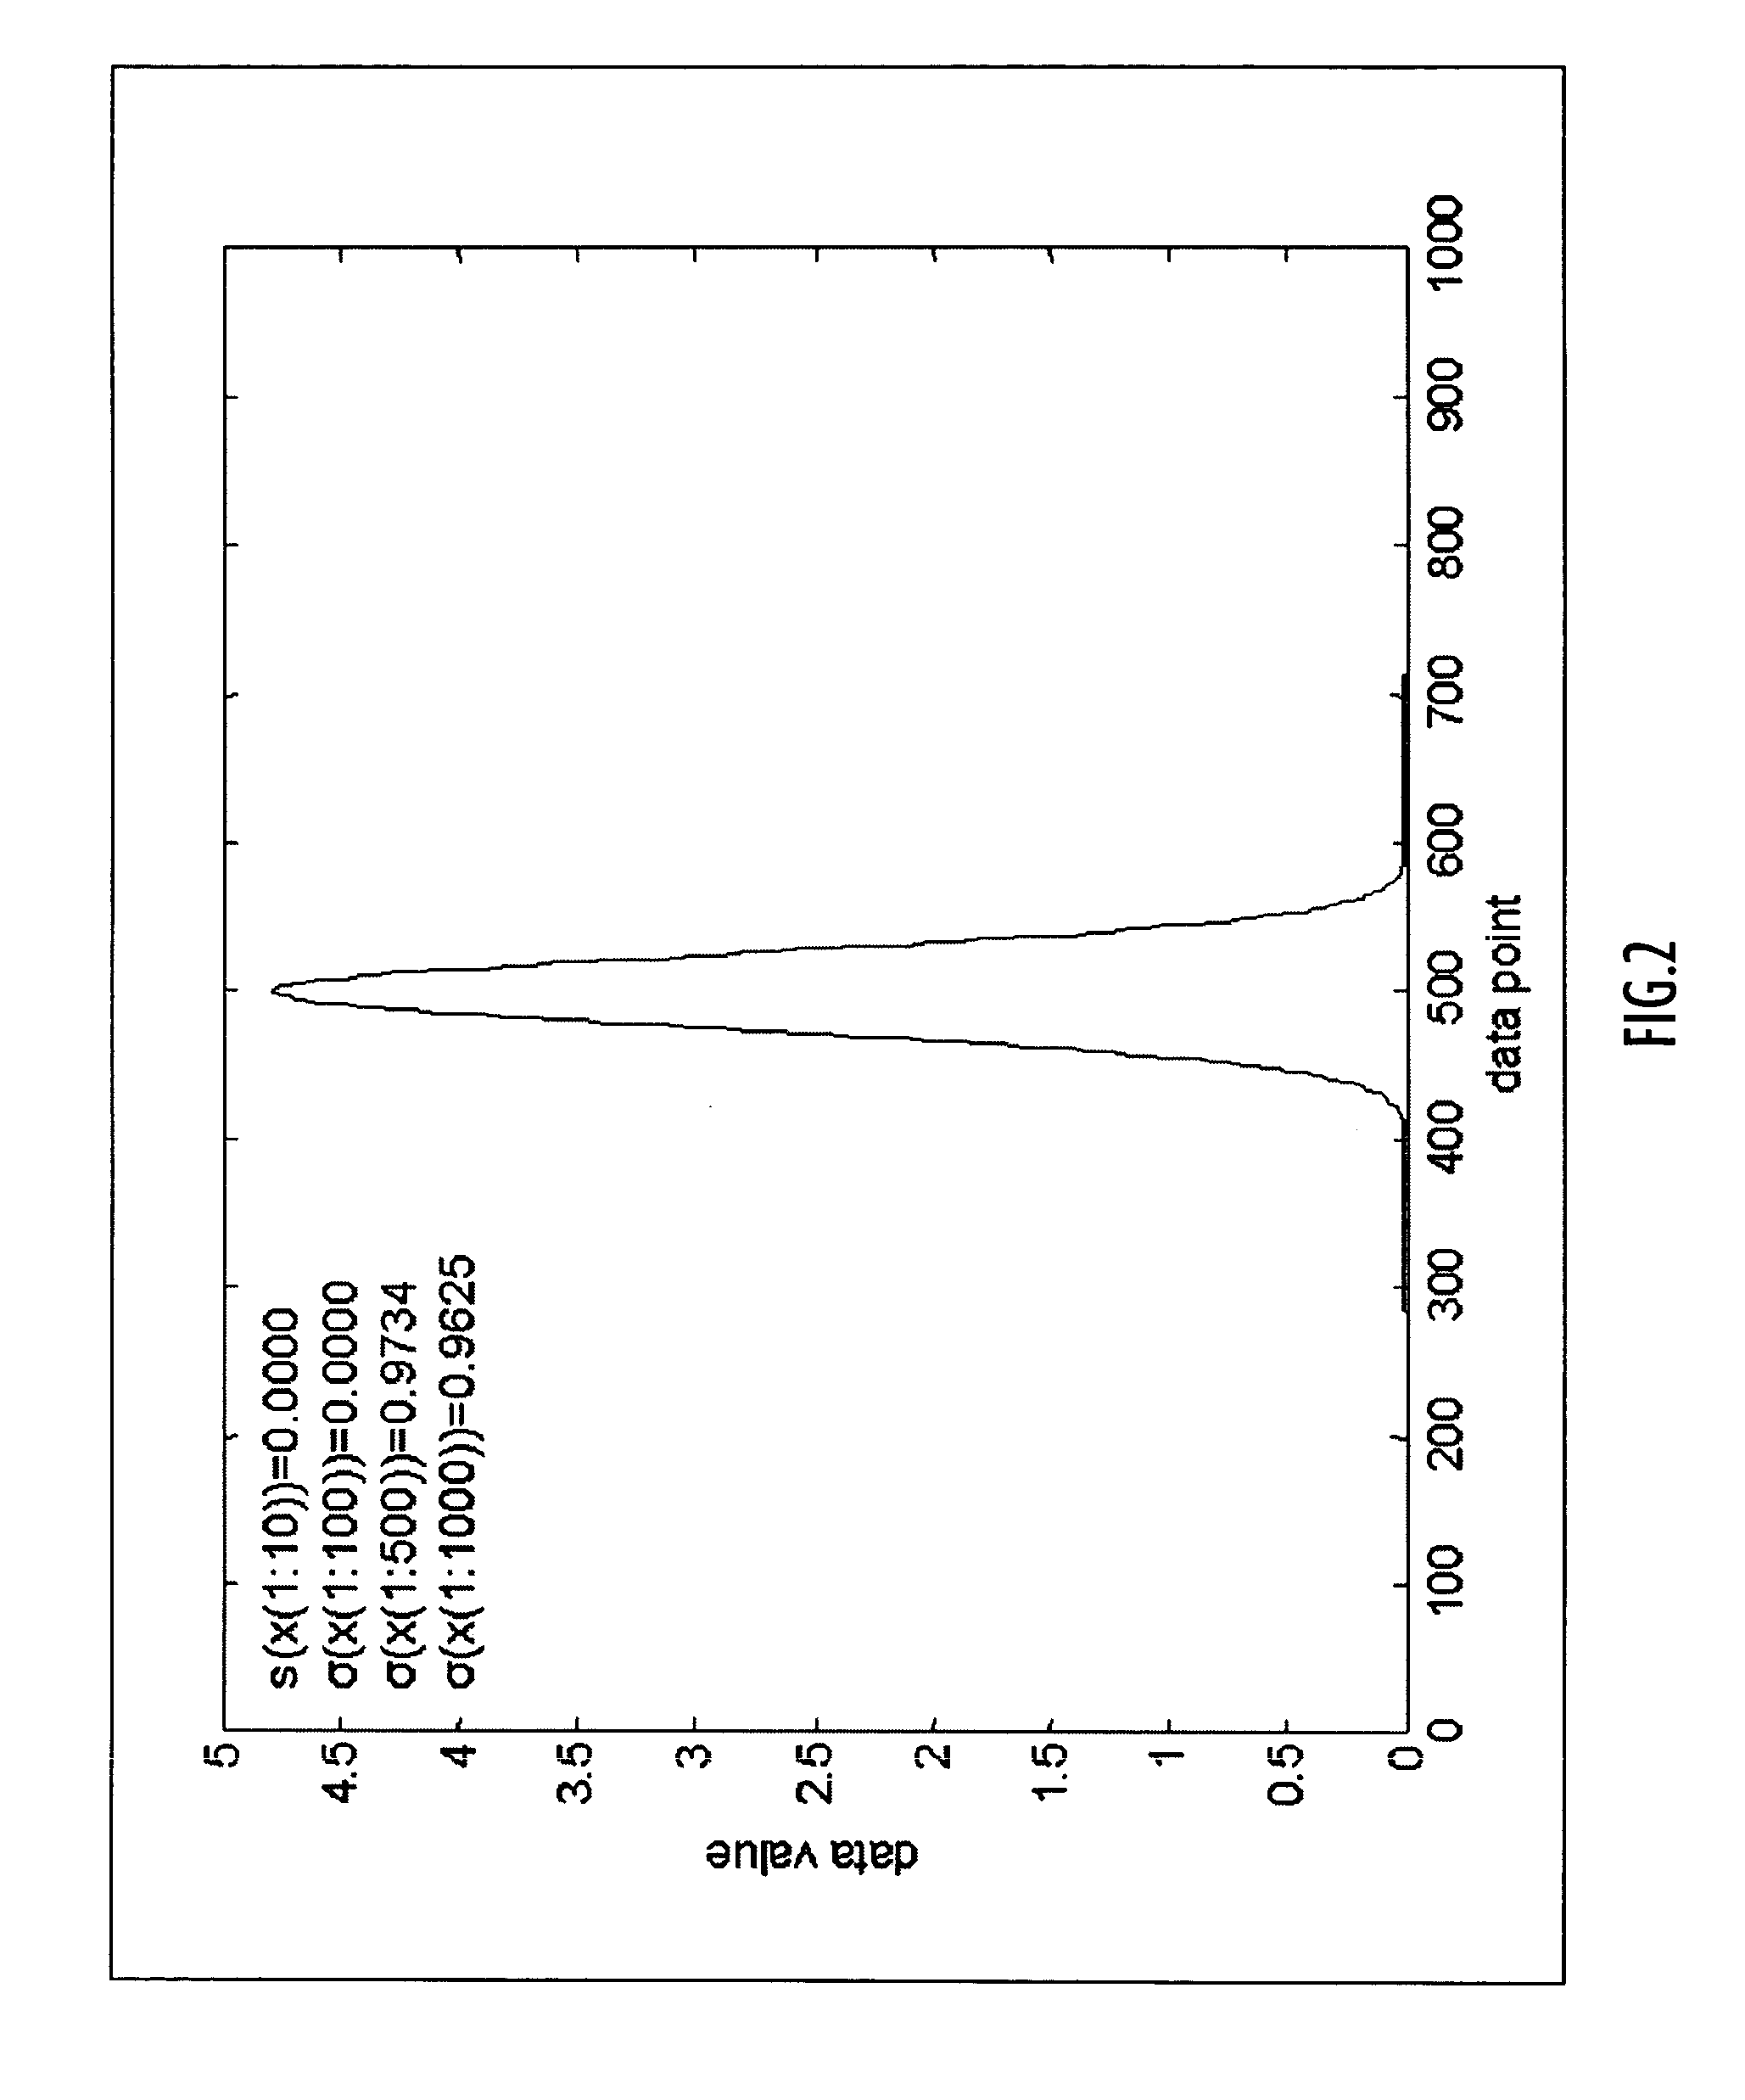
[0043]The present invention relates to a novel method and apparatus for assessing residual noise, associated with virtually any measured observation or communication signal, to determine whether the noise is homoscedastic or heteroscedastic in nature. If a residual noise signal is homoscedastic, a measure of variation calculated for a subset, or window, taken from anywhere within the residual signal, is similar to the measure of variation of the entire residual. If a residual noise signal is heteroscedastic, the measure of variation calculated for subsets, or windows, vary significantly depending upon the size of the window and the position of the window within the residual signal.

[0044]The method and apparatus described implements a novel process, referred to as Continous Variance Analysis (CVA), which as...


PUM


Abstract

A method and apparatus for performing continuous variance analysis (CVA) to characterize a data set. Data set values may be associated with any source, including measurements of a received signal and / or measurements of natural and / or man-made phenomena. CVA generates an output matrix that contains a measure of variation for a plurality of ranges (or windows) of data elements within a data set positioned at known locations within the data set. CVA output can be interpreted visually by a technician and / or using automatic numerical analysis. CVA is compatible with any apparatus / approach that uses numerical analysis to generate a predicted model based upon stored library models and / or linear / nonlinear components. CVA is compatible with any programming language and can be readily added to new and / or existing apparatus to compliment existing capabilities. CVA is less complex than conventional techniques, and requires less computer processing capacity, yet results in more readily interpretable results.

Description

FIELD OF THE INVENTION[0001]The present invention pertains to signal processing. In particular, the present invention pertains to the categorization of unexplained residuals using numerical analysis techniques.DESCRIPTION OF THE RELATED ART[0002]Recorded measurements, or measurement values, whether associated with an observed natural or man-made phenomenon or associated with a signal originating from a natural or man-made transmission source, typically contain noise. For example, repeated measurements associated with a single unchanging event or known substance, even under controlled laboratory conditions, can result in a set of slightly varied data elements. Such noise is typically the result of errors introduced by measurement equipment, unknown sources of signal interference, background signals and / or a host of other unknown causes. Measurements, or measurement values, made in a less controlled environment under less controlled, or uncontrolled, operating conditions typically inc...

Claims


Application Information

Patent Timeline
IPC IPC(8): G06F11/34
CPCG06K9/0051G06F18/00G06F2218/04
Inventor BOYSWORTH, MARC KENNETH
Owner HARRIS CORP
Learn More