
Automated treatment selection method

Inactive Publication Date: 2000-05-16
ADVANCED BIOLOGICAL LAB
View PDF1 Cites 368 Cited by
  • Summary
  • Abstract
  • Description
  • Claims
  • Application Information

AI Technical Summary

Problems solved by technology

Problems with previous methods of analysis included: (1) the findings on outcome prediction from baseline clinical symptoms are inconclusive and sometimes inconsistent among different researchers; (2) the majority of findings resulted from analyses using only linear methods; and (3) evidence exists for nonlinear relationships between clinical variables and outcome.
However, baseline severity was not a consistent predictor of outcome, being confirmed only by 11 of 19 accounts (from thirteen studies).
In addition, the lack of reliability in baseline severity as a predictor of outcome could also be due to different outcome measures (see below), differences that result from treatment-specific responses, population differences, such as demographics, as well as the independent variables chosen to be tested as predictors.
In addition, when over-sleeping and leaden paralysis were both present, the these two symptoms (in addition to the atypical symptoms) significantly predicted less improvement with imipramine.
Furthermore, the presence of more than one symptom does not increase the differential effect.
However, when outcome is defined as percent change in HDRS, their findings are inconsistent.
For example, looking across symptoms, we see inconsistent findings for many of the symptoms.
Increased severity of middle insomnia predicted poor response for amitriptyline and tranylcypromine, but not predictive of response for any other treatment reported.
Increased late insomnia predicted favorable response for imipramine, poor response for tranylcypromine, and did not predict response for all other treatments reported.
When symptoms were reported to predict outcome, most were not consistent across treatments in that the same symptom predicted opposite effects.
Thus, those with either very mild depressions or very severe depressions do not respond well, suggesting a nonlinear relationship within the tricyclic antidepressant drug family.
Thus, inconsistencies in the predictive value of severity appear to be largely due to differences between studies.
Another subproblem was that nonlinear methods require more data because typically they have more parameters to estimate the same predictive performance and power.
The drawback of this approach is that the data are no longer homogeneous by treatment, which can obscure the results.
This yields more reliable results, but the smaller data sets decrease the predictive power of the model.
Second, although ideally all 21 HDRS items and severity would have been analyzed, enough data was not available to prevent over-fitting.
Irregularities in the data arise from limitations of instruments of this type to account for underlying probability distribution information.
However, the numeric quantity to assign these scale values is not well defined.
For the cognitive behavioral therapy data (CBT), it was not possible to run the quadratic regression model because there were too many parameters (21 ) for the number of samples (13).
They however are weak predictors of response because, in general, they account for less than half of the variance.
Statistically significant predictors of outcome have been found in individual studies, however the results are not consistent across studies.
The inability of the nonlinear models to predict outcome may be a contributing factor to previous accounts where symptoms and severity were not found to be significant predictors of outcome for desipramine, fluoxetine, and cognitive behavioral therapy.
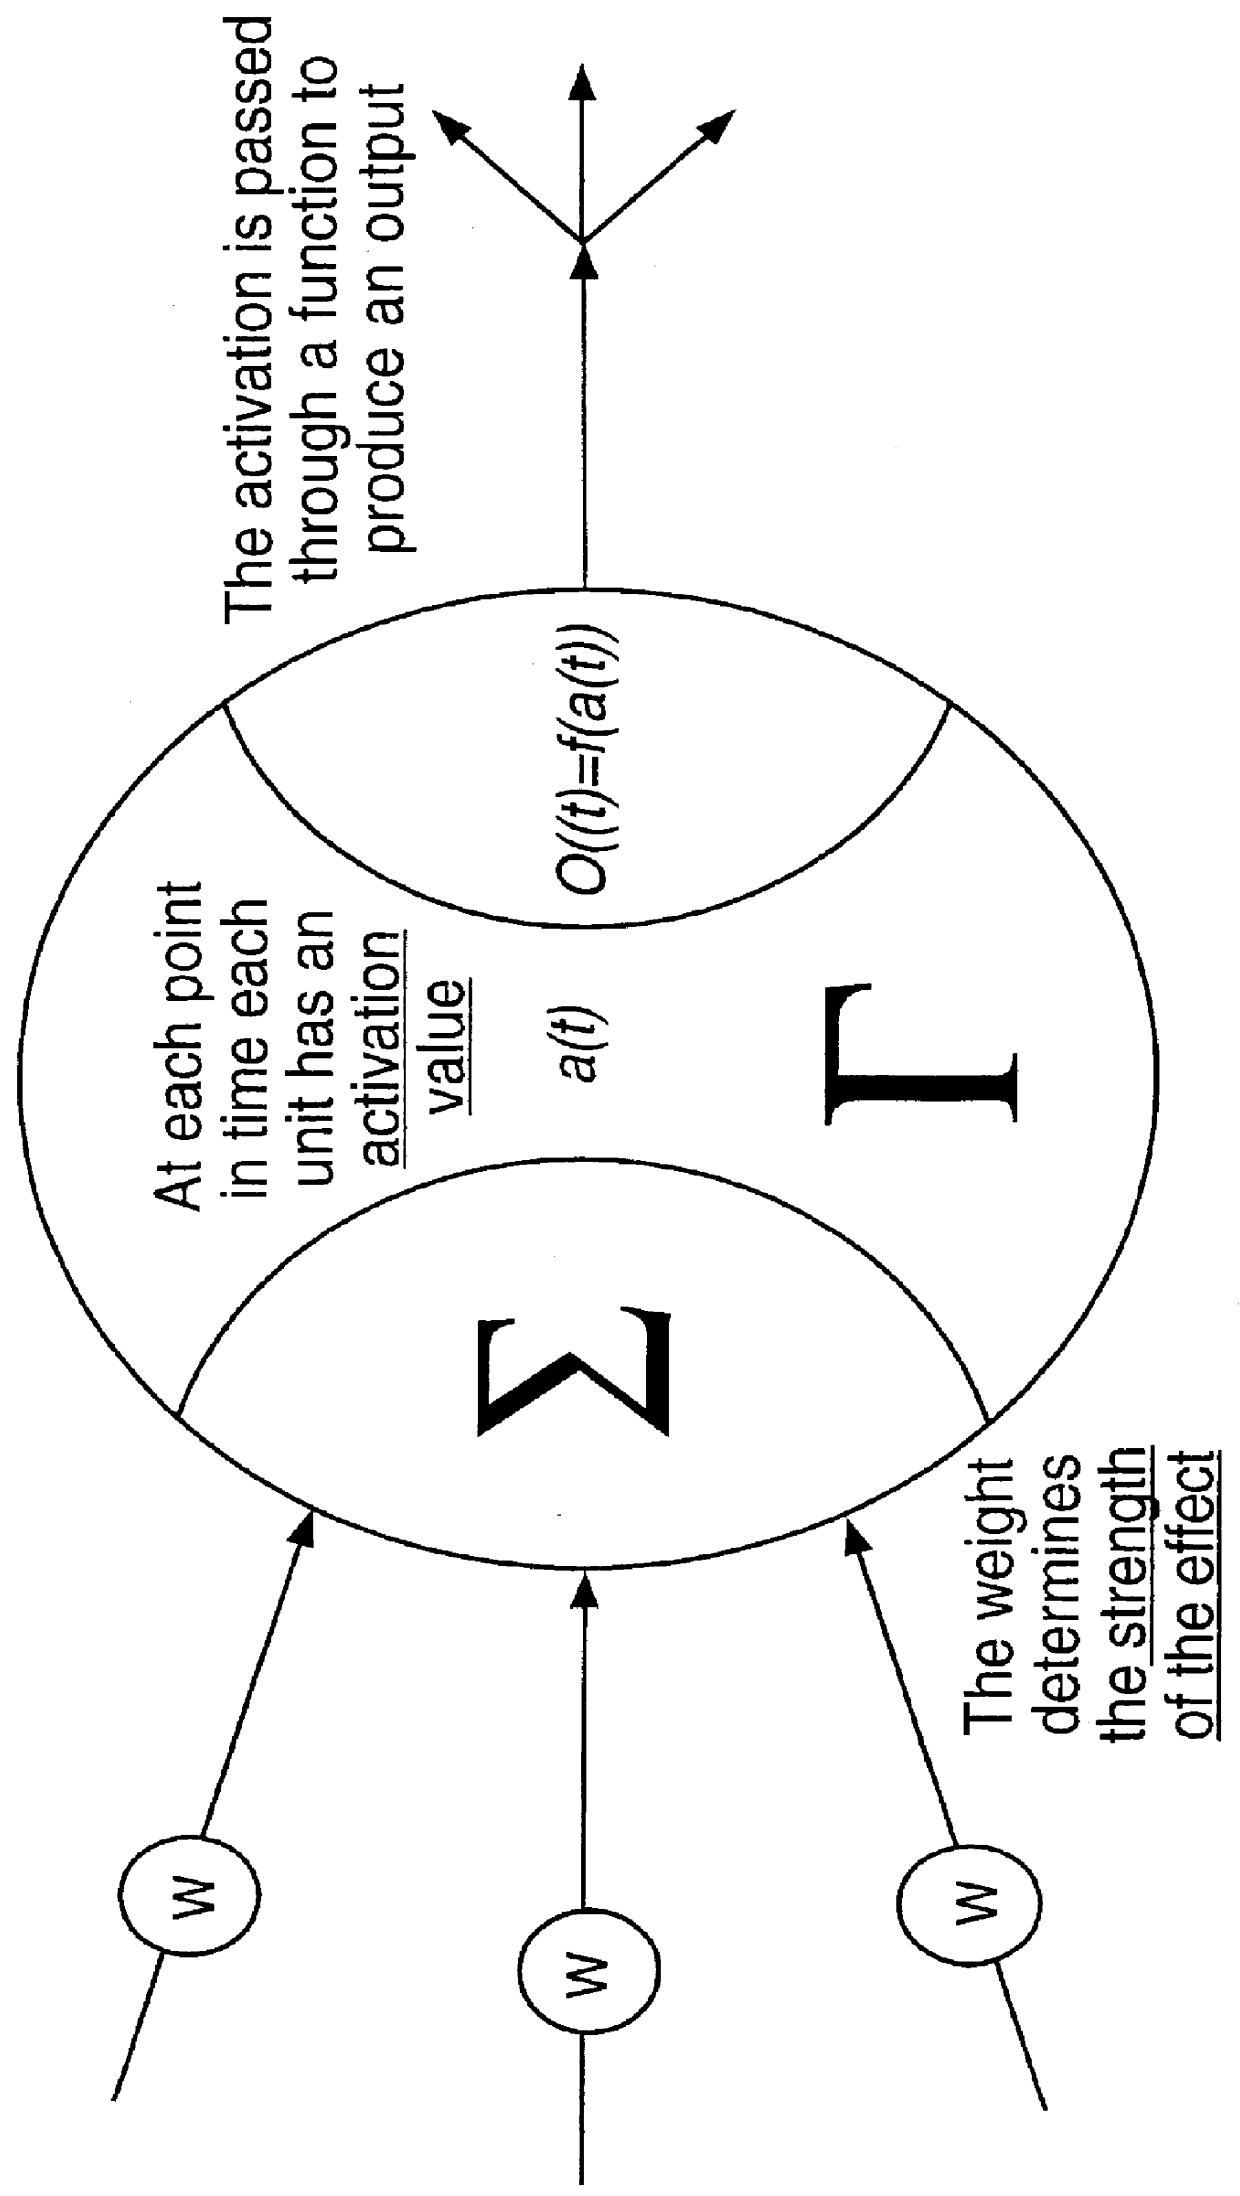
If there are nonlinearities, backpropagation will learn to approximate them by itself (FIG. 4.1), however it is harder, slower, more error-prone, and needs more data to do so.
One drawback of nonlinear systems is that they require more data to extract explanatory rules.
In situations, such as clinical research in depression, large sample sizes are difficult to achieve.
As such, sample size is a limiting factor in training neural network models such as backpropagation.
Because these data are inherently noisy, and because backpropagation, as a rule of thumb, typically requires about ten input-output pairs per free parameter, ninety-nine input-output pairs must be considered as a small sample size, which severely restricts the network's ability to generalize.

Method used


Image

  • Automated treatment selection method
  • Automated treatment selection method
  • Automated treatment selection method

Examples


Embodiment Construction

Factors for analysis of recovery patterns were selected from the Hamilton Depression Rating Scale (HDRS). Three types of factors, physical, performance and psychological, were included. Generally described these factors include: early sleep; middle and late sleep; energy; work performance; mood; cogitions; and anxiety. General methods used for statistical tests for verification of the modeling efforts as modified for use with a neural net model which correct for over-fitting are described by Luciano (Luciano; U.S. Provisional Patent Application Ser. No. 60 / 041,287, filed Mar. 21, 1997). Also described therein are time series prediction verification methods to validate results obtained and outcome prediction verification methods.

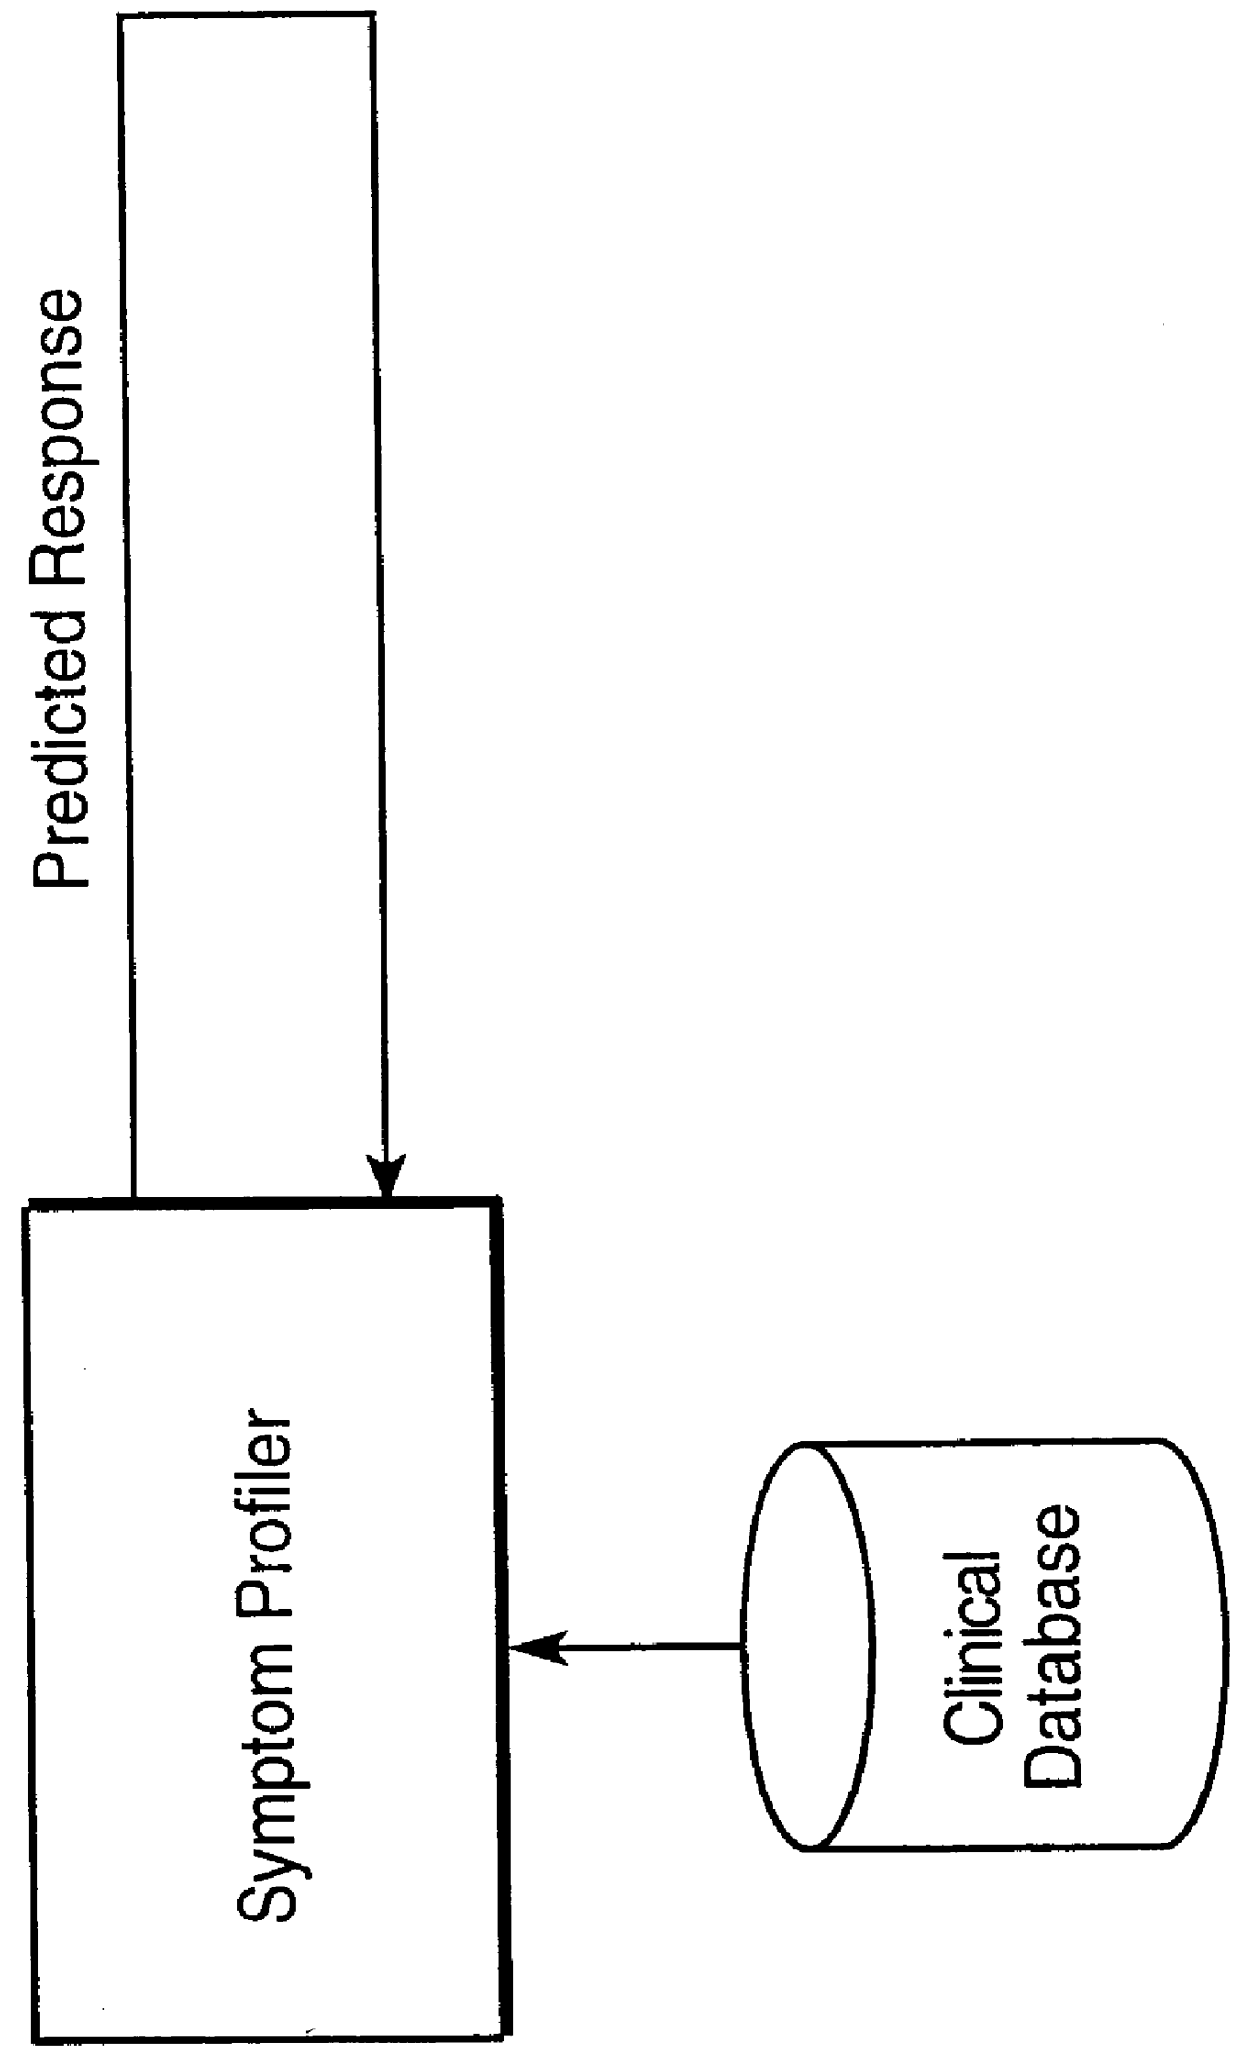
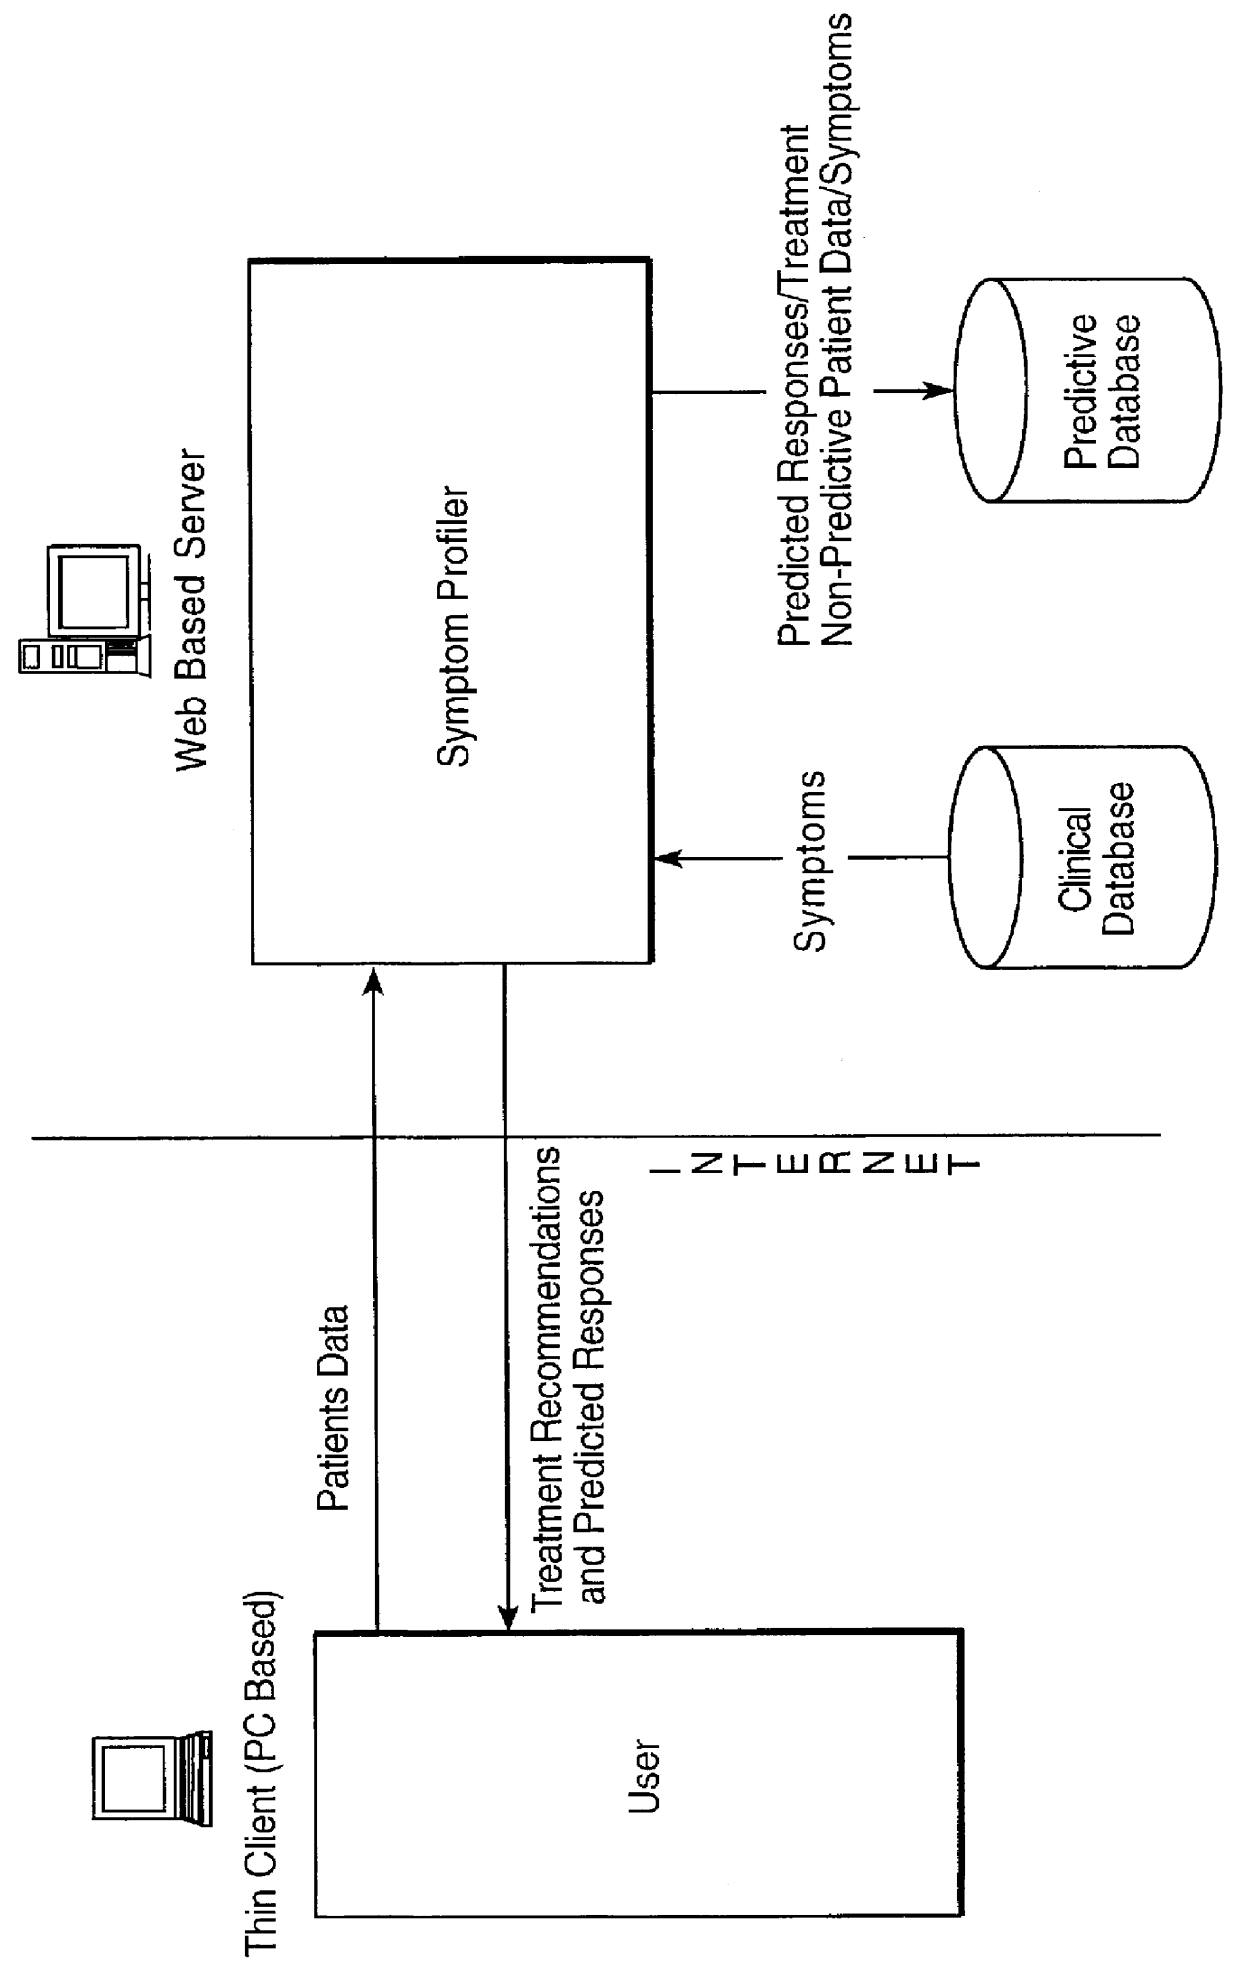
Referring now to FIGs. 1a and 1b, a symptom profile developer and a system architecture for Phase I, (idealized profile development), respectively are illustrated. FIG. 1a provides an overview of the development of the symptom profiler. A prototypical system ...


PUM


Abstract

A method useful for facilitating choosing a treatment or treatment regime and for predicting the outcome of a treatment for a disorder which is diagnosed and monitored by a physician or other appropriately trained and licensed professional, such as for example, a psychologist, based upon the symptoms experienced by a patient. Unipolar depression is an example of such a disorder, however the model may find use with other disorders and conditions wherein the patient response to treatment is variable. In the preferred embodiment, the method for predicting patient response includes the steps of performing at least one measurement of a symptom on a patient and measuring that symptom so as to derive a baseline patient profile, such as for example, determining the symptom profile with time; defining a set of a plurality of predictor variables which define the data of the baseline patient profile, wherein the set of predictor variables includes predictive symptoms and a set of treatment options; deriving a model that represents the relationship between patient response and the set of predictor variables; and utilizing the model to predict the response of said patient to a treatment. A neural net architecture is utilized to define a non-linear, second order model which is utilized to analyze the patient data and generate the predictive database from entered patient data.

Description

A method for facilitating the selection of a treatment regime and for monitoring the outcome of a particular treatment regime on a disease based upon the expected outcome is provided. The treatment is selected from a group of possible treatments based upon the pre-treatment diagnostic data where more than one treatment regime could be selected. The method finds utility, for example, in the treatment and monitoring of disease states wherein the symptoms of the disease can result from more than one physiological condition.While the method of the instant invention is useful for the treatment selection for more than one type of disorder which is diagnosed and treated based upon the symptoms, for simplicity, the treatment selection for a disorder wherein the diagnosis is made by a physician based upon somatic symptoms such as for example depression and especially unipolar depression, will be discussed therein.Recent studies suggest that in the United States about 6-10% of the population ...

Claims


Application Information

Patent Timeline
IPC IPC(8): G06F19/00
CPCG06F19/3437G06F19/322G06F19/363G06F19/3481G06F19/3456G16H10/20G16H10/60G16H40/63G16H50/20G16H50/50G16H70/20G16Z99/00
Inventor LUCIANO, JOANNE SYLVIA
Owner ADVANCED BIOLOGICAL LAB
Learn More