Method for examining biological fluid
- Summary
- Abstract
- Description
- Claims
- Application Information
AI Technical Summary
Benefits of technology
Problems solved by technology
Method used
Image
Examples
example 1
ation of Blood of a Subject Using an X-Ray Fluorescence Analysis Device
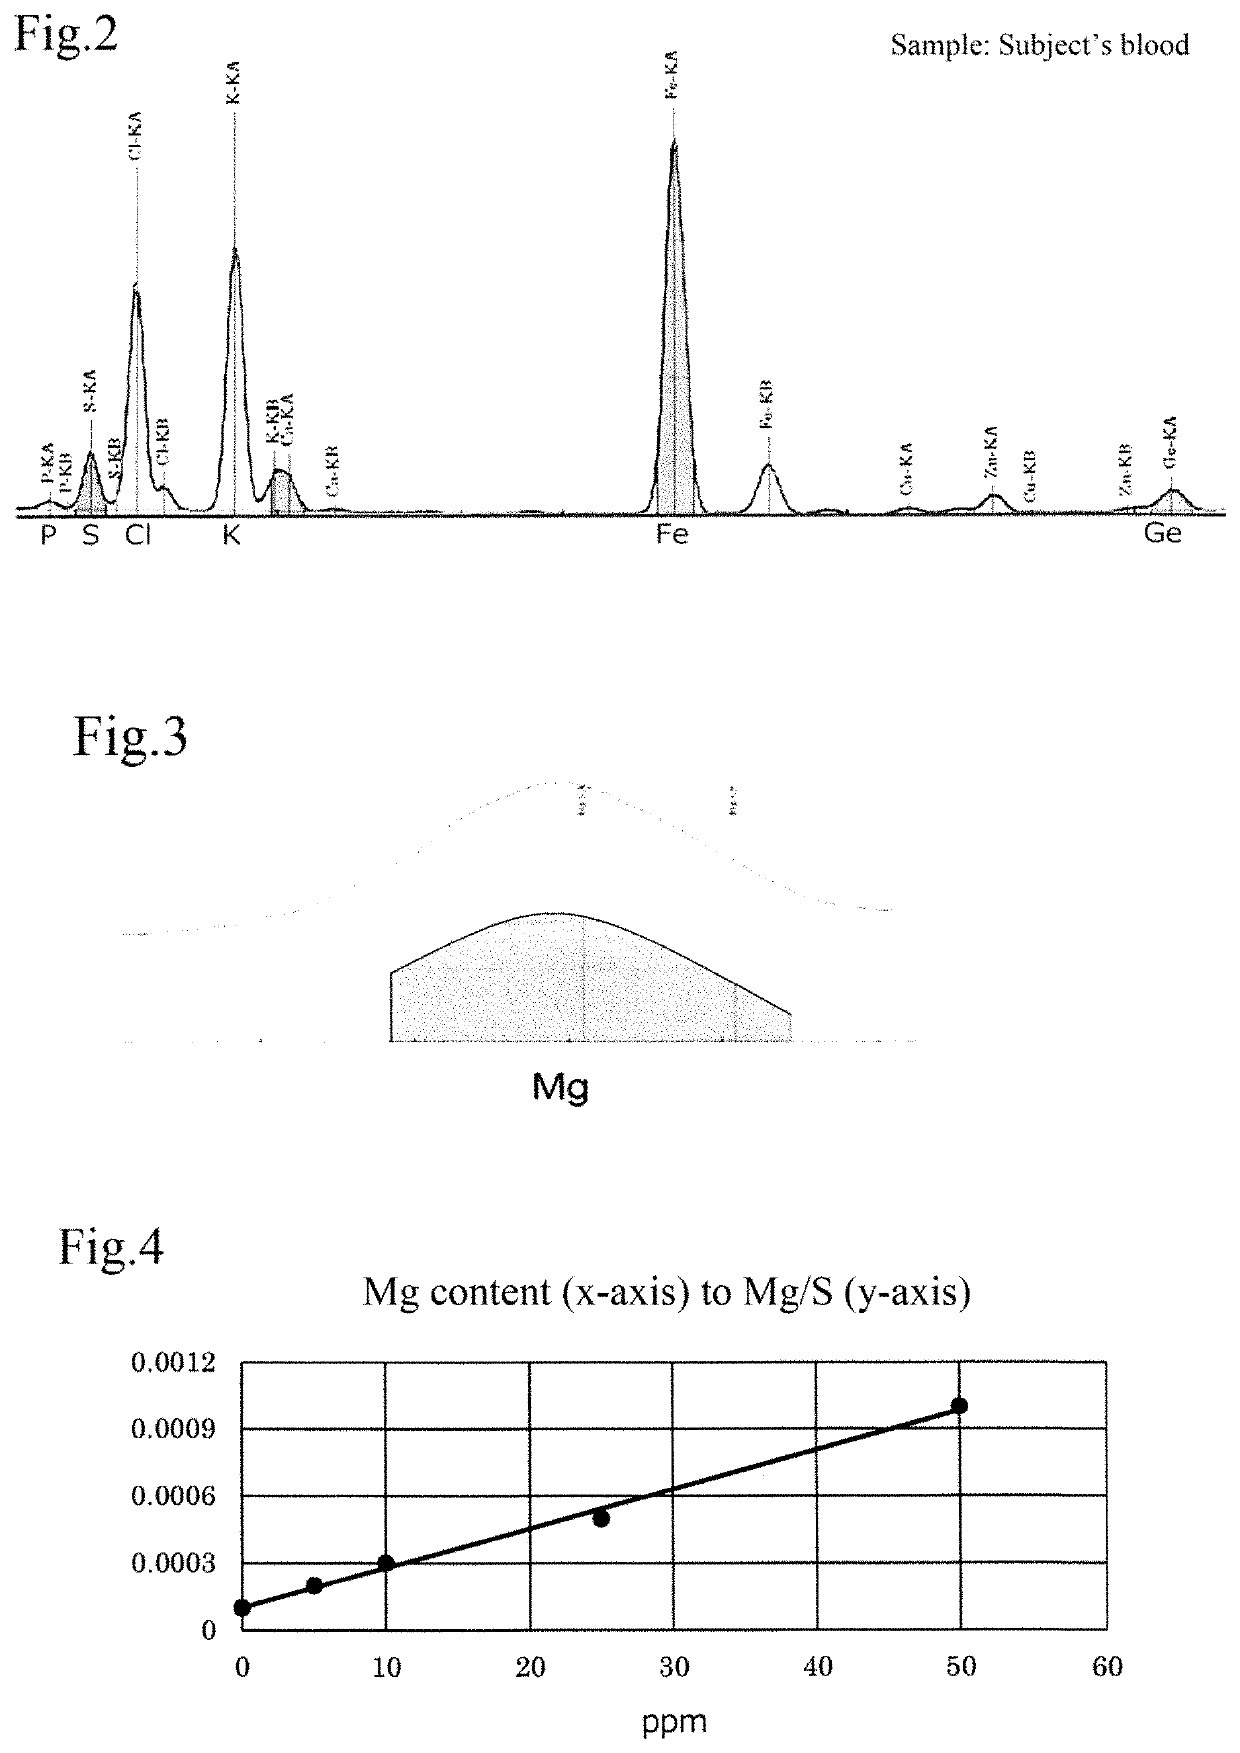
[0082]In this example, as elements in blood, magnesium (Mg), phosphorus (P), sulfur (S), chlorine (Cl), potassium (K), iron (Fe), and germanium (Ge) were analyzed using an X-ray fluorescence analysis device.
[0083]First of all, a sample is prepared by taking one or more than one drop of blood of a subject on a piece of filter paper. Taking of blood may be conducted by the subject personally, for example, using a commercially available kit for self-taking of blood (such as a kit for taking only one or a few drops of blood by pressing a puncture device on a finger). Then, the filter paper with the taken blood (sample) is set on the X-ray fluorescence analysis device, and the X-ray fluorescence intensity of each element contained in the blood taken on the filter paper is measured.
[0084]FIGS. 2 and 3 are examples of a spectrum by X-ray fluorescence analysis of minerals contained in the blood of the subject in Example ...
example 2
ation of Saliva of a Subject Using the X-Ray Fluorescence Analysis Device
[0097]FIG. 11 is an example of a spectrum by the X-ray fluorescence analysis of minerals contained in saliva of a subject in Example 2. The axis of abscissa shows energy, while the axis of ordinate shows X-ray fluorescence intensity.
[0098]In the spectrum shown in FIG. 11, peaks of phosphorus (P), sulfur (S), chlorine (Cl), potassium (K), and germanium (Ge) are detected. The sulfur (S) originates in methionine. In the saliva of the subject, iron which was detected in the blood of the subject is not detected, but the other minerals are similarly detected.
example 3
ation of Urine of a Subject Using the X-Ray Fluorescence Analysis Device
[0099]FIG. 12 is an example of a spectrum by the X-ray fluorescence analysis of minerals contained in urine of a subject in Example 3. The axis of abscissa shows energy, while the axis of ordinate shows X-ray fluorescence intensity.
[0100]In the spectrum shown in FIG. 12, peaks of phosphorus (P), sulfur (S), chlorine (Cl), potassium (K), and germanium (Ge) are detected. The sulfur (S) originates in methionine. In the urine of the subject, iron which was detected in the blood of the subject is not detected, but the other minerals are similarly detected.
[0101]In a manner similar to Example 1, the peak area of each element detected by the X-ray fluorescence analysis is obtained, and the content ratio of each mineral (Mg, P, Cl, K, Ge) to sulfur (S) originating in methionine (each mineral / sulfur) is measured.
[0102]Then, by applying the measured content ratios of each mineral (Mg, P, Cl, K, Ge) to the calibration curv...
PUM
 Abstract
Description
Claims
Application Information
 - R&D
- Intellectual Property
- Life Sciences
- Materials
- Tech Scout
- Unparalleled Data Quality
- Higher Quality Content
- 60% Fewer Hallucinations
Browse by: Latest US Patents, China's latest patents, Technical Efficacy Thesaurus, Application Domain, Technology Topic, Popular Technical Reports.
© 2025 PatSnap. All rights reserved.Legal|Privacy policy|Modern Slavery Act Transparency Statement|Sitemap|About US| Contact US: help@patsnap.com


